
Exploring Biopolymer-Clay Nanocomposite Materials
Royal Institute of Technology Exploring Biopolymer-Clay Nanocomposite Materials by Molecular Modelling Yan Wang (王燕) Doctoral Thesis in Theoretical Chemistry and Biology School of Biotechnology Royal Institute of Technology SE-10691 Stockholm, Sweden 2015 Supervisor: Hans Ågren TRITA-BIO Report 2015:11 ISSN 1654-2312 ISBN 978-91-7595-550-6 KTH, School of Biotechnology SE-10691 Stockholm Sweden AKADEMISK AVHANDLING Akademisk avhandling som med tillstånd av Kungliga Tekniska Högskolan (KTH) i Stockholm framlägges till offentlig granskning för avläggande av teknisk doktorsexamen Torsdagen den 4:e juni, 2015 kl. 10:00am i sal FB52, AlbaNova Universitetetscentrum. Roslagstullsbacken 21, Stockholm. Avhandlingen försvaras på engelska. © Yan Wang, May 2015 Printed by Universitetsservice US-AB Stockholm, Sweden, 2015 To my family Abstract In this thesis, bio-nanocomposites made from two alternative biopolymers and montmorillonite (Mnt) clay have been investigated by molecular modelling. These biopolymers are xyloglucan (XG) and chitosan (CHS), both of which are abundant, renewable, and cost-effective. After being reinforced by Mnt clay nanoparticles, the polymer nanocomposites gains in multifunctionality and in the possibility to register unique combinations of properties, like mechanical, biodegradable, electrical, thermal and gas barrier properties. I apply molecular dynamics (MD) simulations to study the interfacial mechanisms of the adhesion of these biopolymers to the Mnt nanoplatelets at an atomic level. For the XG-Mnt system, a strong binding affinity of XG to a fully hydrated Mnt interface was demonstrated. It was concluded that the dominant driving force for the interfacing is the enthalpy, i.e. the potential energy of the XG-Mnt interacting system. The adsorbed XG favors a flat conformation with a galactose residue in its side chain that facilitates the adsorption of the polymer to the nanoclay. The XG adsorption was found do depend strongly on the hydration ability of counterions. The binding affinity of XG to Mnt was found to be strongest in the K-Mnt/XG system, followed by, in decreasing order, Na-Mnt/XG, Li-Mnt/XG, and Ca-Mnt/XG. The competing mechanism between ions, water and the XG in the interlayer region was shown to play an important role. The dimensional stability upon moisture exposure, i.e. the ability of a material to resist swelling, is an important parameter for biopolymer-clay nanocomposites. While pure clay swells significantly even at low hydration levels, it is here shown that for the XG-Mnt system, at a hydration level below 50%, the inter-lamellar spacing is well preserved, suggesting a stable material performance. However, at higher hydration levels, the XG-Mnt composite was found to exhibit swelling at the same rate as the pure hydrated Mnt clay. For the CHS-Mnt system, the significant electrostatic interactions from the direct charge-charge attraction between the polymer and the Mnt clay play a key role in the composite formation. Varying the degree of acetylation (DA) and the degree of protonation (DPr) resulted in different effects on the polymer-clay interaction. For the heavily acetylated CHS (DA > 50%, also known as chitin), the strong adhesion of the neutral chitin to the Mnt clay was attributed to strong correlation between the acetyl functional groups and the counterions which act as an electrostatic “glue”. Similarly, the poor adhesion of the fully deprotonated (DPr = 0%) neutral CHS to the clay is attributed to a weak correlation between the amino functional group and the counterions. The stress-strain behavior of the CHS-Mnt composite shows that the mechanical properties are highly affected by the volume fraction of the Mnt clay and the degree of exfoliation of the composite. The material structure has a close relationship to the material properties. Biopolymer-clay nanocomposites hold a bright future to replace petroleum-derived polymer plastics and will become widely used in common life. The theme of the thesis is that further critical improvements of these materials can be accomplished by development of the experimental methods in conjunction with increased understanding of the interactions between polymer, clay, water, ions, solutions in the polymer-clay mixtures provided by molecular modelling. Keywords: bio-nanocomposite, interfacial mechanism, binding affinity, dimensional stability, counterions, hydration, stress-strain behavior, xyloglucan, chitosan, chitin, molecular dynamics, montmorillonite. i Sammanfattning I denna avhandling har molekylär modellering och molekyldynamisk (MD) simulering använts för att studera modellsystem för bio-nanokompositer bestående av montmorillonit-lera samt två olika sorters biopolymerer – xyloglukan (XG) och kitosan (CHS). Båda dessa polymerer är naturligt förekommande och mycket vanliga. De är dessutom förnyelsebara och kostnadseffektiva. Då polymererna förstärkts med nanopartiklar av montmorillonit får det resulterande kompositmaterialet en unik kombination av egenskaper såsom mekaniska, elektriska, termiska och barriär egenskaper etc. Genom att använda molekyldynamiska (MD) simuleringar, studeras här växelverkan mellan dessa biopolymerer och lernanopartiklar (Mnt) pågrundläggande atomistisk detaljnivå. Mellan XG och Mnt i ett fullt hydrerat system kunde stark bindningsaffinitet påvisas. Den dominerande drivkraften för affiniteten var entalpi, d.v.s. potentiell växelverkansenergi. Den adsorberade XG-kedjan antar en platt konformation påytan. Ett förslag utifrån simuleringsresultaten var att galaktosresidyn i xyloglukanets sidokedja underlättar adsorptionen till lerytan. Simuleringarna kunde också visa att adsorption av XG till Mnt beror starkt på motjonernas hydreringsförmåga. Bindningsaffiniteten mellan XG och Mnt var som starkast i K-Mnt/XG- systemet. Därefter följde, i minskande ordning, Na-Mnt/XG, Li-Mnt/XG och Ca-Mnt/XG. Det kunde visas att strukturen vid gränsytan styrs av konkurrerande mekanismer mellan joner, vatten och XG. Dimensionsstabilitet vid fuktexponering, d.v.s. förmågan hos ett material att motverka svällning, är en viktig egenskap för biopolymer-lernanokompositer. Ren lera sväller signifikant även vid låga fukthalter. Dock kunde MD simuleringar visa att ett modellsystem av XG-Mnt behåller sitt ursprungliga interlamellära avstånd vid hydreringsnivåer under 50%, vilket indikerar ett stabilare material. Vid högre hydrering uppmättes dock svällningen vara densamma som för ren lera. I CHS-Mnt-systemet visade det sig att direkt elektrostatisk växelverkan med signifikant styrka mellan laddningar på polymer och Mnt-yta spelar störst roll för kompositformeringen. Olika effekt på polymerlerväxelverkan uppnåddes genom att variera acetyleringsgraden (DA) respektive protoneringsgraden (DPr). För den tungt acetylerade CHS-polymeren (DA > 50%, även kallad kitin) visade sig den starka vidhäftningen bero påkorrelation mellan acetylgrupperna och motjonerna som i sin tur verkade som ett elektrostatiskt “lim”. På liknande sätt kunde den svaga vidhäftningen mellan fullt deprotonerad (DPr = 0%) neutral CHS och lera förklaras med en betydligt svagare korrelation mellan aminogrupperna och motjonerna. Spänning-töjningsbeteendet hos CHS-Mnt modellen visar att dess mekaniska egenskaper beror kraftigt på volymsandelen Mnt och graden av exfoliering i kompositen. Materialets struktur är nära relaterat till materialegenskaperna. Framtiden för nanokompositer av biopolymerer och lera är ljus dåde kan komma att ersätta oljebaserade plaster och användas frekvent i våra dagliga liv. Materialen kommer successivt förbättras genom utveckling av experimentella metoder i kombination med molekylmodellering för ökad förståelse för växelverkan mellan polymer, lera, vatten, joner och lösningsmedel. Nyckelord: bio-nanokompositer, gränsytor, affinitet, dimensionsstabilitet, jonhydrering, spännings-töjningsbeteende, xyloglukan, kitosan, kitin, molekyldynamisk, montmorillonit. ii List of appended papers Paper I Molecular dynamics simulation of strong interaction mechanisms at wet interfaces in clay–polysaccharide nanocomposites Wang, Y.; Wohlert, J.; Berglund, L. A.; Tu, Y.; Ågren, H. J. Mater. Chem. A, 2014, 2, 9541-9547 Paper II Molecular adhesion at clay nanocomposite interfaces depends on counterion hydration - molecular dynamics simulation of montmorillonite/xyloglucan Wang, Y.; Wohlert, J.; Bergenstråhle-Wohlert, M.; Kochumalayil, J. J.; Berglund, L. A.; Tu, Y.; Ågren, H. Biomacromolecules, 2015, 16, 257-265 Paper III Hydration and dimensional stability of the intercalated galleries in xyloglucan/montmorillonite nanocomposites studied by molecular dynamics simulations Wang, Y.; Wohlert, J.; Bergenstråhle-Wohlert, M.; Tu, Y.; Ågren, H. In manuscript, 2015 Paper IV Molecular mechanisms for the adhesion of chitin and chitosan to montmorillonite clay Wang, Y.; Wohlert, J.; Bergenstråhle-Wohlert, M.; Tu, Y.; Ågren, H. Submitted for publication, 2015 Paper V Stress-strain behavior in chitosan-montmorillonite nanocomposites studied by molecular dynamics simulations Wang, Y. In manuscript, 2015 iii The author’s contribution to the appended papers In paper I, II, I built the models, performed the majority part of the simulation work, and did most of the analysis and wrote the original manuscripts. In paper III, IV, I built the models, performed all the simulation work. The results were analyzed together with my co-authors. I produced the first drafts of the manuscripts. In paper V, the models, simulation work, analysis and the writing was mostly done by myself. iv Acknowledgement The thesis work was accomplished at the Department of Theoretical Chemistry and Biology, School of Biotechnology, Royal Institute of Technology (KTH), Stockholm, Sweden. The ample institutional resources and the nice atmosphere contributed by all colleagues are acknowledged. The China Scholarship Council is gratefully acknowledged for financial support. The Swedish National Infrastructure for Computing (SNIC) and the computational support from PDC at KTH, HPC2N at UmeåUniversity and NSC at Linköping University are acknowledged. Foremost, I would like to express my sincere thankfulness to my principal supervisor Professor Hans Ågren, without whose help this thesis would never have come out. Thank you for introducing me to the world of computational modelling and offering plenty of free space to let me grow up in science. I appreciate all the opportunities that you offered or supported me with, such as conferences, summer-school and workshops. I also owe my deepest gratitude to your generousness, kind encouragement and tolerance for the recklessness and impatience when facing frustrations. Thank you for always being understanding and encouraging. Many thanks are given to my co-supervisor Dr. Yaoquan Tu. I want to thank you for the serious-minded writing instructions, patient guidance, discussions and other help in many ways. I want to gratefully acknowledge my co-authors, Dr. Jakob Wohlert and Dr. Malin Bergenstråhle-Wohlert. I am truly grateful for the nice collaboration, constructive discussions and advise on all the biopolymer-clay projects. Without you, the thesis work would probably not have been well completed. Special thanks to Dr. Malin Bergenstråhle-Wohlert for the writing of “Sammanfattning”. I also want to thank Prof. Lars Berglund for showing interest in my work and giving good discussions for the first two papers. Your enthusiasm is very infectious. I would also like to mention Dr. Joby Kochumalayil. Thank you for letting me use the experimental results in Paper II, prior to your own publication, and the good discussions from the experimental point of view. Knowledge and information shared from the members at the KTH Fibre and Polymer Department is sincerely appreciated. Special thanks are directed to Xianqiang Sun, Dr. Qiong Zhang, Dr. Xin Li, Dr. Li Gao, Dr. Lu Sun, Dr. Weijie Hua, Dr Xing Chen and Dr. Yongfei Ji. You are all great people that gave me help to understand the basic topics at the very beginning, such as knowing Linux, understanding the molecular modelling process and the MD algorithms. Some programming knowledge shared from Tor Kjellsson, Guanglin Kuang, and Ignat Harczuk is acknowledged. The linguistic consultations from Martin Welz and the proof reading by Dr. Rocio Marcos, Dr. Cui Li and Susanna are gratefully acknowledged. I truly appreciate the excellent lectures given by Prof. Boris Minaev, Prof. Margareta Blomberg, Prof. Olav Vahtras, Prof. Olle Edholm, Prof. Erik Lindahl and Dr. Zilvinas Rinkevicius. Casual discussions with Dr. Mårten Ahlquist and Dr. Arul Murugan are appreciated. Computational support from Dr. Bogdan Frecus, Dr. Radovan Bast is acknowledged. I am also very grateful to Prof. Yi Luo for your immense knowledge, life experience sharing, and considerable care of all of us. Special thanks are given to Prof. Faris Gel'mukhanov and Prof. Lars Thylen for your interest in Chinese culture and some nice talks and discussions together. I also want to thank my office-mate Dr. Robert Zalesny for lots of “farther-daughter” talks that help me make deep thinking about the world. The administrative staff at Theochem Department, in particular Nina Bauer and Pia Ahnlen, are acknowledged for all administrative help. Special thanks to Nina and Kayathri for the nice co-work time on the kitchen improvement project. v Important, but less specific, thanks to all my former and present colleagues at the Theochem Department for all your advice, discussions, and contributions to the pleasant working environment. There are many of you, please excuse me for not being specific. I am truly grateful to my international friends Menghan Gao, Anna Klöfver, Anna von Zedtwitz Liebenstein, Linnéa Björkdahl, Emely Lindblom, Tor Kjellsson, Linnea Lundberg, Anne-Laure Berthod, Anaïs Pellé, Hao Liu, Zixuan, Chenyang, Pak, Ekaterina Garbaruk Monnot, Pradeep, Romain Futrzynski, Julia, Vincent, Jing Huang, Chen Hou, Maoping, Zhengzhong, Zhuxia, Ting Fan, Lijun, Wei Hu, Keyan, Xu Wang, Sai Duan, Liqin, Guangjun, Guangping, Xinrui, Ce Song, Qiang Fu, for amazing friendship. I am also very grateful to my sisters and brothers in Maria Magdalena kyrka for the great quality time. Liwen, Jingwen, Wenjie, Billy Lo, you mean a lot to me. Sunny, Ruiqing, Sarah Mak, Jingtian, Mandy, Zoe, Qi Chen, Wei Zheng, Yifan, Peiyao, Lini, Hongyu, Yi Gong, Sheng Li, Xuan Zhao, Xuan Li, Yafeng, Lily, Zhiqin, thank you for the fellowship. I would like to say heartfelt thank you to Prof. Dachuan Yin in China. Your passioned and diligent work on science have encouraged me a lot. Finally, I owe my deepest gratitude to my parents Beihai Wang and Gaimei Dong for the endless love and support. Thank YOU for being there always for me and your love is always the source of my energy. GLORY IS TO YOU! vi Abbreviation AFM Atomic force microscopy AMBER Assisted model building with energy refinement CHS Chitosan CHT Chitin CLAFF Clay force-field CG Coarse grain DA Degree of acetylation DPr Degree of protonation ESP Electrostatic potential HPC High performance computing LBL Layer-by-layer LINCS Linear constraint solver MC Monte carlo MD Molecular dynamics Mnt Montmorillonite MTM Montmorillonite NMR Nuclear magnetic resonance NpT Isothermal-isobaric (ensemble) NVE Microcanonical (ensemble) NVT Canonical (ensemble) PBC Periodic boundary condition PMF Potential of mean force PVOH Polyvinyl alcohol vii QM Quantum mechanical RESP Restrained electrostatic potential RH Relative humidity SMD Steered molecular dynamics TEM Transmission electron microscopy TGA Thermogravimetric analysis WHAM Weighted histogram analysis method XG Xyloglucan XRD X-ray diffraction viii Contents Abstract .................................................................................................. i Sammanfattning ................................................................................... ii Acknowledgement ................................................................................ v Abbreviation ........................................................................................ vii Chapter 1 Introduction ......................................................................... 1 1.1 Biopolymer-clay materials ................................................................ 1 1.2 Xyloglucan ........................................................................................ 3 1.3 Chitosan............................................................................................ 6 1.4 Montmorillonite clay .......................................................................... 7 1.5 Molecular adhesion ........................................................................ 10 1.6 Molecular modelling vs Bio-nanocomposite design ....................... 11 Chapter 2 Computational Methods ................................................... 14 2.1 Molecular dynamics simulations .................................................... 14 2.1.1 Basic principles of equations of motion and integrators ............15 2.1.2 Periodic boundary conditions.....................................................16 2.1.3 Temperature and pressure in MD simulations ...........................17 2.2 Force fields ..................................................................................... 18 2.2.1 Bonded interactions ...................................................................19 2.2.2 Non-bonded interactions............................................................20 2.2.3 Force fields for montmorillonite clays and polysaccharides ......23 2.3 Trajectory analysis.......................................................................... 24 2.4 Molecular adhesion ........................................................................ 25 2.4.1 Steered molecular dynamics simulations ..................................25 2.4.2 Umbrella sampling .....................................................................27 2.5 Stress-strain curves ........................................................................ 28 2.6 Limitations ...................................................................................... 29 Chapter 3 Molecular Models.............................................................. 31 3.1 Interaction mechanism between xyloglucan and clay (Project I) ... 31 ix 3.2 Counterion hydration and the XG-Mnt adhesion (Project II) .......... 32 3.3 Hydration and dimensional stability of XG-Mnt nanocomposites (Project III) ............................................................................................ 33 3.4 Molecular mechanisms for the adhesion of chitin and chitosan to montmorillonite clay (Project IV) ........................................................... 33 3.5 Stress-strain behavior in the chitosan-montmorillonite nanocomposites (Project V) ................................................................. 35 Chapter 4 Summary of Project Work ................................................ 36 4.1 Xyloglucan-clay interaction mechanisms at wet interface (Paper I) .............................................................................................................. 36 4.2 Counterion hydration and xyloglucan adhesion at clay interfaces (Paper II) ............................................................................................... 38 4.2.1 Estimation of the work of molecular adhesion .......................... 38 4.2.2 Interfacial structure and competing mechanisms ..................... 39 4.2.3 Free energy of interfacial water ................................................ 41 4.3 Hydration and dimensional stability of XG-Mnt nanocomposites (Paper III) .............................................................................................. 42 4.3.1 The hydration and the dimension change of the XG-Mnt ......... 43 4.3.2 The swelling of the Mnt clay ..................................................... 45 4.4 Molecular mechanisms for the adhesion of chitin and chitosan to montmorillonite clay (Paper IV) ............................................................ 46 4.4.1 Interfacial adhesion ................................................................... 46 4.4.2 The role of hydrogen bonds ...................................................... 48 4.5 Stress-strain behavior in chitosan-Mnt nanocomposites ............... 50 (Paper V) ............................................................................................... 50 4.5.1 Stress-strain behavior of Mnt clay ............................................ 50 4.5.2 Stress-strain behavior of CHS-Mnt ........................................... 51 Chapter 5 Conclusions and Outlook ................................................ 53 References ........................................................................................... 56 x Chapter 1 Introduction | 1 Chapter 1 Introduction By wisdom a house is built, and through understanding it is established; through knowledge its rooms are filled with rare and beautiful treasures. ——Proverbs 24: 3-4 1.1 Biopolymer-clay materials Nature, huge of resources and creator’s wisdom, has inspired human-beings to learn and develop all sorts of science for living. Material science, which is closely connected to the products people use every day, has been attractive for millennia. After millions of trials and errors in history, people successfully developed and applied materials in all fields of life. However, the balance between human consumption and the resources of nature has become more and more difficult to achieve, a main reason being the growing needs and population increase all over the world. Materials, if can be not only efficiently applicable, but also biodegradable and renewable, will contribute toward a sustainable bio-economy. The calling for renewable and “green” concepts of materials is truly imperative. As abundant resources, polysaccharide-based biopolymers have been widely studied with the aim to replace traditional petroleum-derived plastics.1, 2 However, the mechanical and thermal properties of such polymer materials are usually low and can hardly reach the applicable standards.3 Moreover, the gas barrier requirement and the maintenance of mechanical properties in high moisture conditions further limit the choice of materials. Being stiff, strong and tough under extremely wet conditions, natural nacre is an excellent biocomposite composed of inorganic aragonite platelets and organic biopolymers (such as chitin and silk-like proteins). It is an inner layer of some molluscs’ shell. The mixture of the two-phase components forms a unique “brick-andmortar” arrangement. This structure makes the nacre as strong as silicon and increases the toughness at multiple length sizes. Thus, nacre can defend the soft tissues of molluscs against the hard particles and damage the debris by swallowing them into their layered structures. This is also a process of making a pearl in the mollusc. The Chapter 1 Introduction | 2 impressive properties of nacre have inspired people to develop similar materials. One main idea is to add inorganic reinforced nano-particles to organic polymer matrices to form highly organized hierarchically structural composites, in which way the mechanical properties can be improved and the processability preserved.3-6 Montmorillonite (Mnt), a natural clay with layered structure, has been well used as building-blocks for assembling organic species and as load bearing components.7 Precisely like the “brick-and-mortar” structure of nacre, the combination of polysaccharide polymers and Mnt clay has been proved an excellent way to make artificial nacre materials.3, 4, 8 Among several polysaccharide candidates, such as starch, cellulose, chitin, xyloglucan (XG) and chitosan show their priority both by the structural properties and the commercial and practical concerns. Xyloglucan, a hemicellulose that is abundant in the primary cell wall in many plants, can be produced from industrial tamarind seed waste.9 The glycosidic linked backbone, extended by xylose side chain substitution or even capped with a galactose residue, is amphiphilic and thereby available for studies in explicit water. Similarly, chitosan, a derivative from the second most abundant resource chitin, is extracted from millions of tons of crustaceans shell wastes.10-12 The included acetyl side group makes it stiffer than other biopolymers and being one of the most common used cationic polymers, it gains a high potential to fabricate good composites with oppositely charged substrates.13 The low cost and the environmental-friendly properties make the polysaccharideMnt clay a winning hybrid material. However, to truly put in use such a composite material, many scientific and practical issues must be addressed, for example, the composite moisture durability,14 the possibility of a uniform dispersion of the clay in the polymer matrix,7, 15 the influence of surrounding species (counter ions, solutes, solvents, etc.),16, 17 and clay swelling issues.16, 18-21 The interaction mechanisms between all the components in the system are the cornerstones of the development. Efforts have to be made both in the lab and by theoretical modelling. Molecular dynamics (MD) simulations is a powerful technique to track the individual atom movement in a dynamic process.22 Detailed information, such as position, velocity, energy, interactions among molecules and other system phenomena can be highlighted by such simulations. Therefore, MD simulations are very helpful to better understand a physiochemical process from an atomistic perspective. The structural information of the molecules as well as their dynamics become a very valuable Chapter 1 Introduction | 3 supplement to experimental tests and provide essential proofs or predictions of phenomena which are difficult to get from laboratory observations. In the present study, the objective is to get an atomistic picture of the interface between biopolymers and Mnt clay. The hybrid material is built as an ideal molecular model and simulated by MD simulation methods. A clear description of the molecular interface is beneficial for relating chemical structure and conformation to final material properties by providing atomistic resolution. Here, the simulations can address the properties of the interlayers involving the important physiochemical process, such as organic molecule adsorption, clay swelling, water uptake, and motion of ions. The structure of this thesis is summarized in Figure 1.1. Prior to the main work, accumulation of knowledge on the studied biopolymer (xyloglucan and chitosan) and the reinforcement substrate Mnt clay, is an essential premise. Figure 1.1 Study structure of the thesis. 1.2 Xyloglucan Xyloglucan (XG), a derivative of cellulose, is widely found in the middle lamella, primary walls, and gelatinous wall layers of higher plants, where it cross-links adjacent cellulose microfibrils and thus contributes a lot to the rigidity of the cell wall.23 Although the extraction of XG from the primary cell walls is unfeasible for commercial exploitation, abundant deposits of XG are coming from seeds of trees growing in the tropical zone, for example, the tamarind seeds. 9 The tamarind seed is a by-product of the tamarind industry and is produced in about 300,000 tons per year in India,24 which makes it a cheap origin of XG. The tamarind XG is the major Chapter 1 Introduction | 4 component of tamarind kernel powder and can form a stiff gel. It has been widely used as a sizing material in textile, paper and jute industry.9, 25-27 The low cost and abundant resource in nature give xyloglucan a large application potential from a commercial perspective. Figure 1.2 a) common xyloglucan heptasaccharide; b) galactosyl residue attached fragments; c) basic structure of dicotyledonous xyloglucan. The abbreviations shown for xyloglucan oligosaccharide were introduced by Fry et al. in 1993.28 Structurally, XG is a soluble hemicellulose, possessing a -(14)-glucan backbone identical to that of cellulose. In general, XG consists of up to 75% glucose residues connected with -(16)-xylosyl residues along the backbone.29 Major species-specific differences are found in the additional galactosyl and fucosylgalactosyl residues attached to the xylose residues in dicotyledons30 (a name of the plant species, see Figure 1.2), and in fewer xylosyl residues in monocotyledons23, 31 Chapter 1 Introduction | 5 (another plant species). The basic repeat units of tamarind XG can be described by four types of oligosaccharides which differ in the number and distribution of their galactose residues. They are XXXG, XLXG, XXLG and XLLG, with a content fraction of 1: 0.42: 2.08: 6.20 in tamarind XG.29 The abbreviation nomenclature was described by Fry et al.28 In this thesis, XXXG and XXLG have been chosen to simply present a native XG (GXXLGXXXG) and an enzymatically modified XG (GXXXGXXXG) (Figure 1.3). A ninth glucose unit G linked to the non-reducing end of the backbone causes reduction of the chain-end effects.32 Though the corresponding molecular weight is only 2.9 kDa, which is much lower than the real XG (average molecular weight is 2.5 MDa33), the simple model can be applied to study issues of the interfacial adsorption to clay minerals since the experimental data shows that the XG with the molecular weight of 4 kDa is also able to adsorb on Mnt clay.34 Figure 1.3 Two simplified XG models used in the thesis: (a) Sequence of a native XG specified as GXXLGXXXG, with G1 to G8 describing the glycosidic linkage and 1 to 6 the side chain conformations; (b) Sequence of the modified XG specified as GXXXGXXXG; (c) Definition of the dihedral angles in glycosidic linkages and side chains.35 The figure was taken from Paper I. A large number of studies have been devoted to XG owing to its unique properties in aqueous solution, such as Newtonian fluidity, thermostability, good stability towards acid hydrolysis, and the bearing ability under shear in mechanical force fields etc.36 Numerous high-end applications have covered food industry, paper making industry, medical and pharmacological fields, agricultural fields, petroleum well drilling industry, chemical surfactant and flocculant areas, as well as cosmetics areas.9, 33, 37, 38 However, there were no publications on XG being used as an Chapter 1 Introduction | 6 “engineering” biopolymer until the first paper published by Kochumalayil et al. in 2010.33 The potential applications, for instance, as a polymer for thermoplastic mouldings, as packaging materials or as biopolymer matrices, have spurred researchers to develop XG based composite materials where reinforced elements are included. 1.3 Chitosan Chitosan (CHS), a derivative of chitin (CHT) which is the second most abundant natural biopolymer after cellulose,39, 40 is produced via alkaline deacetylation of CHT. Generally, when the degree of acetylation (DA) is lower than 25%, it is known as CHS41 and can be solved in acidic aqueous solution (pH < 6.2).42, 43 The main sources of the polymer in nature are shells of shrimps, crabs, lobster, krill and prawns, the exoskeletons of arthropods, mushrooms and cell walls of fungi.12, 44, 45 It is said that the chitinous solid waste fraction of average Indian landing of shellfish ranges from 60,000 to 80,000 tons.12 A proper usage of the waste would thus be a good strategy both for environmental concern and economy. As a structural polysaccharide, CHS possesses a basic polysaccharide chain with an amino group (-NH2) located in the C2 position of the glucose residue, replacing the previous hydroxyl group in the same position. If one considers that CHS is deacetylated from CHT, the formed structure is a copolymer composed of linked (14) glucosamine and N-acetylglucosamine units (Figure 1.4). CHS properties and applications depend largely on the protonation (where the amino group -NH2 changes to -NH3) and the distribution of acetylated and deacetylated residues. When the solution pH is below 6, CHS gets fully protonated and behaves like a weak polyelectrolyte. However, at higher pH or higher DA, CHS prefers a formation of colloidal aggregates.13 In the present study, in order to represent the polymer’s structure and its sensitivity to the acidic solution and the DA, we have modelled a single polysaccharide chain composed of five glucosamine dimers with a consideration of protonating the amino group in accordance with the studied pH conditions and altering the number of N-acetyl glucosamines according to the change of the DA. Indeed, the simple changes in the acidic solution conditions render the polymer suitable for various areas, for instance, food science, cosmetic industry, biomedicine, and agriculture.46 In addition, being a cationic biopolymer, CHS has been widely used Chapter 1 Introduction | 7 as an adsorbent for the remove of contaminants from waste water, as a flocculant to induce the anionic compounds precipitate47 and as an ectrochemical sensor in the detection of different anions.48 At the same time, CHS also possesses high strength (the ultimate stress was reported as 110 MPa, and Young´s modulus E is 2 GPa) compared to other biopolymers, which qualifies it with an important engineering role in CHS based materials. Figure 1.4 a) The chitosan dimer chemical structure; b) molecular structure of the CHS dimer presented by the CPK method in the thesis. The glucosidic linkage dihedral angles , are defined by atoms O5 C1 O4 C4 and C1 O4 C4 C3, respectively. Color schemes: red: Oxygen, blue: nitrogen, white: hydrogen, cyan: carbon. In an attempt to develop novel, ecofriendly and high strength, materials with mechanical properties similar to those of natural seashell nacre, CHS has been chosen to work with inorganic layered Mnt clay minerals by different techniques in the lab, for instance, the layer-by-layer (LBL) assemble technique49 and the vacuum filtration strategy.3 If one considers that the efficacy of the hybrid CHS-Mnt material frequently relies on a stable adsorption of the polymer to clay surfaces, the investigation of interaction details at the interface of the assembled Mnt clays becomes essential. Thus, it has accordingly attracted the attention both from experimentalists and theoreticians. 1.4 Montmorillonite clay Clay minerals are members of the layered materials family, which are “crystalline materials wherein the atoms in the layers are cross-linked by chemical bonds, while the atoms of adjacent layers interact by physical forces”.50 They are formed by weathering and decomposing the igneous rocks. The layered structure makes clay capable to intercalate a variety of inorganic or organic species. Montmorillonite (Mnt) is a type of smectite cationic clay minerals that have alumino- Chapter 1 Introduction | 8 silicate sheets carrying a negative charge, which implies that the interlayer guest species must be cationic.51 The predominant naturally occurring Mnt clay is composed of two tetrahedral sheets that sandwich one central octahedral sheet, therefore it is referred to as a 2:1 clay (or as T-O-T) shown in Figure 1.5. The magnesium substitution for aluminum in the octahedral sheet with some aluminum substitution for silicon in the tetrahedral sheet results in a net negative charge on the T-O-T layer,52 which is balanced by the incorporation of metal cations, such as Na+ and Ca2+. Both sheets and the interlayer region have widths in the nanometer range. Figure 1.5 Montmorillonite (Mnt) clay structures: (a) one single clay sheet structure from a top view; (b) interlayer structure presented by CPK with the definition of basal spacing, interface distance and the height of one clay sheet. Color scheme: red: oxygen, pink: aluminum, yellow: silicon, light cyan: magnesium and white: hydrogen. Mnt clay is commonly used in nanocomposites, firstly because of the swelling property which results from the capacity to host water and other organic molecules in the interlayer region, but also because of its high cation exchange capacity, high aspect ratio, and large surface area.53, 54 The second point is that clay is a stiff material, which can be widely used as a reinforcement component in nanocomposites. During the past decades, nanocomposites comprising Mnt clay and polymeric species have emerged as a new class of materials based on two intentions. One is to fabricate stiff and strong nanocomposite that can keep some of the ductility from the polymer at the same time. Hence, a high volume fraction of the clay is desirable; the other is that people want to reinforce the polymeric material, meanwhile, keep the overall ductility of the material. Hence, the fact that adding only a small volume fraction of nanoparticles enhances the mechanical properties is appealing. The development of nanocomposites based on those motivations has earned tremendous attention. Applications of the Mnt based nanocomposites can be divided into two broad categories which relate to engineering or barrier properties that are consistent with the Chapter 1 Introduction | 9 above two intentions. Engineering properties are usually characterized by the reinforcement efficiency. The pioneering study on nylon-clay nanocomposites applied in Toyota cars was a ground-breaking achievement for polymer-clay composites.15, 55 The substantial increase in tensile strength, tensile modulus and storage modulus, with almost no resistance impact and effective fire retardancy are the advantages of this new composite material when comparing to conventional composites. Barrier properties, specifically, to gas and moisture are due to the clays orientated platelet structures of the clays in the polymer matrices. Improvements in barrier properties, with thermodynamic, optical, electrical and biodegradable properties featuring in some cases, qualify the materials to become widely employed in many other industries, such as, packaging,56 coating and pigments,57 medical care,58 sorbent,7 etc., which have been thoroughly reviewed.15, 53, 59 Recently, renewable biopolymers have been used to prepare Mnt bionanocomposites.60, 61 The polymers they have chosen include water-processed starch, chitosan and pectin biopolymers. However, the poor dispersion of Mnt, lack of nanostructural order and few fraction of Mnt content (only 5 wt% or lower) leads to a set of challenges for experimental work. Inspired by the nanostructure of nacre, mother of pearl, researchers have been motivated to prepare artificial nacre-like materials. The architecture of nacre is a classic “brick-and-mortar” structure, which plays a remarkable role in the mechanical properties of the nacre.62 It is because the structure consists of highly aligned inorganic aragonite platelets surrounded by protein matrices that serve as a glue to stick the platelets.63-65 One advantage of nacrelike bio-nanocomposites is that they possess good mechanical properties even in highly hydrated conditions. The work by Tang et al. was a seminal study of the Mnt based nacre-like material, in which it was reported that the mimicked material could reach the Young’s modulus as high as 11GPa and the tensile strength as strong as 100 MPa, with a higher volume fraction of inorganic content up to 50%.66 The concept of mimicking nacre has inspired a lot of techniques to fabric the artificial material in the lab and all of the techniques carry a goal of being able to scale up to the industry level. Recently, six strategies for manufacturing Mnt based artificial nacre materials have been summarized: 1) conventional method for bulk ceramic material;67 2) freezing casting;68 3) layer-by-layer (LBL) deposition;69 66 4) electrophoretic deposition;70 5) mechanical assembly;71 and 6) chemical self-assembly.72, 73 The highly sustainable artificial nacre-like composites made from Mnt clay and biopolymers remain a promising material for the replacement of conventional Chapter 1 Introduction | 10 petroleum-derived plastics in the future. The increase of the interfacial area can thus enhance the toughness of the material. Efficient processing methods to produce materials with high performance are needed. In addition, a better understanding of the interfacial area at a detailed atomistic level would contribute a lot to the processing design. Knowledge from theoretical modelling is very necessary. 1.5 Molecular adhesion For the above mentioned two-level hierarchical structure composites, a good adhesion is required for transferring the mechanical load from the weak matrix to the reinforcement component, without which the material will fail prematurely at the interface. In the case of composite materials including montmorillonite clay and biopolymers, the issue of adhesion between the reinforcement component clay and the polymer matrix, possibly at wet conditions, is of crucial importance. Within the present work, adsorption capacity can be understood as that polymer atoms adhere with considerable force at the clays interface. This is called molecular adhesion or contact adhesion.74 For centuries, there was a big gap in theoretical knowledge about adhesion. Though as early as 1704, Isaac Newton observed the phenomenon, he could not explain it.75, 76 Almost 200 years later, the model for understanding adhesion was provided by Johannes Diderik van der Waals, who discovered attractive forces between molecules, i.e., what we now call van der Waals forces.77 Today, molecular adhesion plays an important role in physiochemical processes and applications but is still not fully understood. For example, when designing composite materials, adhesion between two or multiple phases is crucially important to the mechanical load bearing ability. As a primary interest, our focus is to quantify the molecular adhesion between polymers and clays from an atomistic perspective. Experimentally, intricate techniques like Atomic Force Microscopy (AFM) have been developed to provide detailed information on molecular adhesion.78 Theoretically, a common way to evaluate the adhesion is to calculate the thermodynamic work of adhesion, WA, which is equal to the change of free energy when detaching a material from a substrate material interface, with the exposure of free surfaces of both materials at the same time as shown in Figure 1.6. Although it does not actually explain the macroscopic work of adhesion which can be affected by entanglements, mechanical interlocking etc., theoretical methods, Chapter 1 Introduction | 11 as applied in this thesis, can be very useful. In a commercial view, it is cheap and time-saving. For the purpose of fundamental research, it is a powerful complement to experimental tests. Figure 1.6. Work of adhesion 1.6 Molecular modelling vs Bio-nanocomposite design Molecular computer simulations have become very useful during the last few decades for studying interlayer structure and swelling as of Mnt clays.21, 79, 80 After the occlusion of the polymer molecules by the clay platelets, it becomes even more difficult to investigate experimentally the polymer conformation transition, adsorption and uniformity of occupancy. Computer simulations thus become a valuable tool for providing insight into the structure and behavior of polymer-clay nanocomposites, and provides a theoretical support to the materials design. Greenwell and co-workers reviewed the use of computer simulations of clays minerals in a materials chemistry perspective.81 With the fast development of high performance computing (HPC), a variety of length and time scale calculations are possible to accomplish through multi-scale computational techniques (see Figure 1.7) for the polymer-clay nanocomposite materials. The complexity and size of organic polymers in the nanocomposite systems generally rules out the utilization of quantum mechanical (QM) based methods. While QM based methods are computationally expensive, their major advantage is that they can model electron structure in the processes of bond-breaking or bonding making, which can be used to understand the interactions between small components and the clay particles. However, this approach is too expensive for big organic molecules interacting with clay minerals. A majority of simulation techniques used for polymer-clay systems are based on classical mechanics, whereby the forces between clays, polymers, water molecules, and cations are modelled by a combination of inter-atomic potential functions (force fields). This is the methodology of choice in the present thesis. It is highly desirable that the interaction parameters of each specific force fields are derived from experimental data, Chapter 1 Introduction | 12 for example, X-ray diffraction (XRD) or thermogravimetric analysis (TGA), or from accurate quantum chemical calculations on a finite set of systems, where a limited number of model compounds could yield transferable results. That is to say, the force fields must be suitable for a wide range of compounds. Nevertheless, the problem arises in that there are very few force fields that can adequately describe the interactions of inorganic frameworks and organic molecules simultaneously. The majority of force fields are parameterized to describe either a discrete set of organic molecules, or inorganic frameworks. A number of universal force fields at a much more approximate level have been developed to describe the interactions between a wide numbers of different atom types. Previous simulations performed on biomineral surfaces have used standard organic force fields such as AMBER82 coupled with inorganic force fields83 and also hybrid mineral force fields like CLAYFF.52 CLAYFF is a force field explicitly designed to replicate the interactions between clay sheets and organic molecules.52 Here, we have coupled carbohydrate force fields GLYCAM_06 which is originally derived from AMBER force-fields and the CLAYFF force-field to describe biopolymer-clay systems. Classical Monte Carlo (MC) and molecular dynamics (MD) simulation techniques have typically been used in modelling clay platelets intercalated polymers.16, 18, 54, 84 A main advantage of the MD method is that the dynamic evolution of the complex with time allows to compare results with experimental techniques, for example, nuclear magnetic resonance (NMR) and quasi-elastic neutron scattering. Recent advances in high performance computing (HPC) hardware and MD algorithms have enabled large-scale simulations with reduced finite size effect.85, 86 The improved HPC infrastructures bring possibility to simulate realistic bulk materials. Large-scale atomic MD and coarse-grained (CG) MD have been applied to investigate systems of considerable size of several million atoms and timescales of up to milliseconds.87 In the past several years, those simulation techniques have profited tremendously from the proliferation of multicore computers as well as efficient code parallelization. The definition of a large-scale model is that the system possesses a number of atoms larger than 105. Depending on what phenomena one may be interested in, one can consider how large a system should be or how long time a system should run. In principle, it can range from quantum mechanical calculations to the macroscopic level using a finite element modelling as shown in Figure 1.7. Coarser approximations have been made involving approximating several atoms to one “bead”. Such CG MD simulations, although not able to capture the atomic structure and interactions, can provide Chapter 1 Introduction | 13 interlayer structures of clay minerals at the nanometer level and model a polymer-clay system of real size and time scale, capturing phenomena such as composite failure and the process of intercalation. Simulations of large systems can thus be essential to accurately characterize complexes and disordered clay minerals, and can therefore, be very helpful to predict materials properties. Figure 1.7 Computational modelling techniques with a variety of time and length scales, commonly applied for clay-polymer materials. Figure was redrawn based on Fig. 1 in the review of Suter et al.59 Chapter 2 Computational Methods | 14 Chapter 2 Computational Methods Molecular dynamics (MD) simulations are based on Newton’s law of motion. Ever since the late 1950s, when the method was originally conceived within theoretical physics by Alder and Wainwright for simulations of phase transitions of a colliding hard sphere system,88, 89 it has evolved into a widely adopted tool that allows researchers in physics, chemistry, and biology to understand and predict macroscopic properties based on theoretical knowledge. At the very beginning the MD method gained popularity in materials science and has ever since been used to design new materials. In MD methodologies the interactions among particles are approximated with potential functions (force fields). The time dependent evolution of their positions and velocities is tracked with the temperature and pressure maintained at desired values. After the system reaches an equilibrium state, many macroscopic properties can be extracted by averaging over the trajectory, which is represented by the snapshots (system samples) in a certain time span. Though MD is sufficient for many applications and has been a prevailing choice historically, approximations and limitations should be considered carefully for specific issues. These are discussed at the end of this chapter. 2.1 Molecular dynamics simulations Molecular dynamics simulations are based on Newtonian mechanics and deal with a system of N interacting particles. A series of algorithms have been developed and applied in MD simulations over the years. They give numerical solutions of the Newton’s equation, using periodic boundary conditions parameterized sets of potential functions (section 2.2 Force fields), thermostats, barostats, and other algorithms for special purposes. A simplified description of MD simulation algorithms is depicted in Figure 2.1. Chapter 2 Computational Methods | 15 Figure 2.1 Simplified description of MD algorithms 2.1.1 Basic principles of equations of motion and integrators The basic principle of MD simulations is to numerically solve the Newton’s equation of motion: 𝜕𝑉 𝑑 2 𝒓𝒊 𝒊 𝑑𝑡 2 𝑭𝒊 = − 𝜕𝒓 = 𝑚𝑖 𝒂𝒊 = 𝑑 2 𝒓𝒊 𝑑𝑡 2 = 𝑑𝒗𝒊 𝑑𝑡 (2.1) (2.2) where V is a potential function of the atomic system at time t, V(t)(r1, r2 …, rn), Fi is the force on atom I, mi and ri represent the mass and coordinates of atom I, and ai, vi are the acceleration and the velocity of atom i. The initial input data require the atomic coordinates and velocities at t=t0. In molecular dynamics simulation packages, such as GROMACS,90-93 if the initial velocities are not available, the program will assign the velocities with a Maxwell-Boltzman velocity distribution at a given temperature T, generated from random numbers. The first and the most direct solution of Equation 2.1 was constructed as early as 1967 by Verlet.94 It was limited by the mean-value description of the velocity and hence, influenced the kinetic energy and temperature, which led to an error that cannot Chapter 2 Computational Methods | 16 be canceled.95 After that, two successful integrators have been proposed to improve the original Verlet algorithm. They are the velocity-verlet algorithm96 and the leapfrog algorithm.97 The leap-frog algorithm was proposed by Hockey in 1970. It is expressed in the form of: 1 1 𝑡 𝒗 (𝑡 + 2 𝑡) = 𝒗 (𝑡 − 2 𝑡) + 𝑚 𝑭(𝑡) 1 𝒓(𝑡 + 𝑡) = 𝒓(𝑡) + 𝑡𝒗(𝑡 + 2 𝑡) (2.3) (2.4) This algorithm is time reversible, and the velocity is an average of the velocity 1 1 2 2 at (t+ 𝑡 ) and (t- 𝑡 ). 2.1.2 Periodic boundary conditions The computational box of a certain system is usually small, the size of which is often in the order of cubic nanometers. Periodic boundary conditions (PBCs) are applied to the simulation box in three dimensions, thereby an infinite number of copies of the microscopic system are generated to model the macroscopic world ideally. This treatment is perfectly suitable for crystalline systems because of the highly ordered crystal structures. However, errors inevitably exist for disordered systems, such as liquids or solutions. They can be evaluated by comparing different system sizes. 98 Fortunately, for large systems that contain over thousands or more atoms, the errors are acceptable, and efficient simulations are performed in a large periodic box with fruitful results coming out.99, 100 Seamless connections between the computational box and its periodic image are important to maintain. In general, triclinic type of boxes is the most widely used unit cell that comprise all possible space-filling shapes.101, 102 For example, rhombic dodecahedra, truncated octahedral, cubic, and rectangular boxes can be used in MD simulations. GROMACS is based on the triclinic box, which is defined by three box vectors, a, b and c fulfilling the following conditions being:102, 103 𝑎𝑦 = 𝑎𝑧 = 𝑏𝑧 = 0 (2.5) 𝑎𝑥 > 0, 𝑏𝑦 > 0, 𝑐𝑧 > 0 (2.6) 1 1 1 |𝑏 𝑥 | ≤ 𝑎𝑥 , |𝑐 𝑥 | ≤ 𝑎𝑥 , |𝑐𝑦 | ≤ 𝑏𝑦 2 2 2 (2.7) Chapter 2 Computational Methods | 17 2.1.3 Temperature and pressure in MD simulations One of the intentions of performing MD simulations is to understand or predict macroscopic properties from a microscopic system. Macroscopic concepts, for instance temperature and pressure, are essential when investigating the thermodynamics of a system. They are easily measured experimentally, but cannot be assigned to individual atoms within a modelled system at the atomistic scale. Nevertheless, they are required for the definition of thermal and mechanical equilibrium. Before introducing the strategies of tuning them within an MD simulation, it is necessary to define them. The temperature at time t is related to the average kinetic energy of the system and can be computed by 𝑇 (𝑡 ) = 𝑁 1 𝑑𝑓 𝑘𝐵 ∑𝑁 𝑖=1 𝑚𝑖 𝒗𝒊 (𝑡) ∙ 𝒗𝒊 (𝑡) (2.8) here Ndf is the number of degrees of freedom. kB is Boltzman’s constant, N is the number of atoms in the system, vi is the velocity of atom i, mi is the mass of atom i. The pressure p at time t is based on the fundamental definition of force per unit area of walls of the simulation box. It can be calculated from the difference between the kinetic energy Ekin and the virial tensor based on the virial theorem.102, 104 2 𝒑 (𝑡) = 𝑉 (𝑬𝒌𝒊𝒏 (𝑡) − 𝚵(𝐭)) (2.9) here the kinetic energy Ekin(t) can be written as a tensor for the purpose of pressure calculation in a triclinic system, or for the case that shear forces are included. 1 𝑬𝒌𝒊𝒏 (𝑡) = 2 ∑𝑁 𝑖=1 𝑚𝑖 𝒗𝒊 (𝑡)⨂𝒗𝒊 (𝑡) (2.10) The virial tensor 𝚵(𝐭) is the internal component of the virial theorem caused by the internal force Fi and is defined as: 𝚵(𝒕) = − ∑𝑵 𝒊=𝟏 𝒓𝒊 (𝒕)⨂𝑭𝒊 (𝒕) (2.11) In order to control the temperature and pressure in the MD simulations, one needs to modify the algorithms of the integrator for the NVE ensemble (constant atom number, constant volume of the simulation box and constant energy) to the canonical (NVT) or the isothermal-isobaric (NpT) ensemble. Most quantities we wish to Chapter 2 Computational Methods | 18 calculate are usually maintained at constant temperature with either volume or pressure held as constant. The strategy is to employ a rescaling algorithm for the velocities to tune the temperature (as thermostat), and another rescaling algorithm for the positions (coordinates) and the box size, serving as barostat to control the pressure. Several thermostats are available in GROMACS to regulate the kinetic energy. They are the Berendsen scheme,105 Andersen thermostat,106 velocity-rescaling thermostat,107 and the Nose-Hoover temperature coupling.108, 109 The simplest and most direct way is the Berendsen thermostat, which calculates the temperature via the equipartition theorem. The scaling factor for the velocities is set by the difference of the system temperature and the reference temperature. To correctly describe a canonical ensemble for the system that has reached equilibrium, an extension can be employed by introducing a thermal reservoir and a friction term into the equations of motion, as proposed first by Nose108 and modified later by Hoover.109 In this work, most of the simulations are based on the Nose-Hoover thermostat. There are two popular barostats used in the MD simulations: the Berendsen algorithm105 and the extended-ensemble Parrinello-Rahman approach,110, 111 which can be combined with any kinds of temperature coupling methods mentioned above. Since the Parrinello-Rahman scheme works in the same spirit as the Nose-Hoover temperature coupling method and it allows to include anisotropic external pressure, it is employed in this work. 2.2 Force fields A force field is a parameterized set of potential functions for describing the potential energy surface of a system of N atoms. The potential functions are used to approximate the interactions between the atoms. It consists of some co-acting mathematical functions and a set of empirical parameters to be applied within the equations. It is necessary to highlight that the reliability of MD simulations is strongly dependent on the quality of the underlying force fields. A balance between the accuracy and the transferability needs to be achieved due to the tedium of parametrization work of a single force field. The number of parameters grows very fast as the types of atoms increase. Meanwhile, if one wants to increase the simulation speed, reducing the number of sites may be a good solution, but losing accuracy is the price one then has to pay. Despite that, the force field model is still widely used for various systems. Chapter 2 Computational Methods | 19 Generally, if there is no chemical reaction occurring in a system, the inter-atomic interactions can be divided into two distinct types: bonded interactions and nonbonded interactions, V(𝒓) = V𝑏𝑜𝑛𝑑𝑒𝑑 (𝒓) + V𝑛𝑜𝑛−𝑏𝑜𝑛𝑑𝑒𝑑 (𝒓) (2.12) Bonded interactions only refer to the intra-molecular interactions, that is, the interactions come from the atoms that are covalently bonded within the same molecule. Since in most force fields, there are neither bonds forming nor bonds breaking descriptions, the intra-molecular atoms are all predetermined and do not change. Typical interactions consist of harmonic potentials for bonds and angles, and contributions from dihedrals and improper dihedrals (Figure 2.2): V𝑏𝑜𝑛𝑑𝑒𝑑 (𝒓) = V𝑏𝑜𝑛𝑑𝑠 (𝒓) + V𝑎𝑛𝑔𝑙𝑒𝑠 (𝒓) + V𝑑𝑖ℎ𝑒𝑑𝑟𝑎𝑙𝑠 (𝒓) + V𝑖𝑚𝑝𝑟𝑜𝑝𝑒𝑟 𝑑𝑖ℎ𝑒𝑑𝑟𝑎𝑙𝑠 (𝒓) (2.13) Figure 2.2 Bonded interactions. They include contributions from bonds, angles, dihedrals, and improper dihedrals. The non-bonded interactions in a force field consist often of pairwise interactions acting on all atoms, not only on the intra-molecular atoms but also on the intermolecular atoms. They describe contributions from the van der Waals and electrostatic interactions. Therefore, they can be divided into the sub-contributions: V𝑛𝑜𝑛−𝑏𝑜𝑛𝑑𝑒𝑑 (𝒓) = V𝑣𝑑𝑊 (𝒓) + V𝑒𝑙𝑒𝑐 (𝒓) (2.14) Each sub-potential form in Equation (2.13) and Equation (2.14) will be described in detail below. 2.2.1 Bonded interactions As shown in Figure 2.2, bonded interactions arise between atoms linked through one to three chemical bonds. The bond stretch and angle bending terms are often Chapter 2 Computational Methods | 20 approximated by simple harmonic functions with potential minimum at their predetermined bond length or angle, which can be expressed as: 1 𝑉𝑏𝑜𝑛𝑑 𝑠𝑡𝑟𝑒𝑡𝑐ℎ 𝑖𝑗 = 2 𝑘𝑏 (𝑟𝑖𝑗 − 𝑟0 )2 1 𝑉𝑎𝑛𝑔𝑙𝑒 𝑏𝑒𝑛𝑑 𝑖𝑗𝑘 = 2 𝑘𝑎 (𝜃𝑖𝑗𝑘 − 𝜃0 )2 (2.15) (2.16) For near equilibrium situations, the harmonic potential functions are good enough to describe the bond and angle behavior. Dihedral angles are important for the conformational characterization of a molecule, such as for the glucosidic linkage between two neighboring sugar units in a polysaccharide molecule. For the torsional angle potential models the steric barriers between the particles are linked through three covalent bonds. The rotation occurs around the middle bond. Comparing to the vibrations of bonds and angles, the rotation of dihedrals is less frequent. In addition, dihedrals are periodic in a 360 rotation manner. The ordinary dihedral potential can be properly described as a cosine series: 𝑉𝑑𝑖ℎ𝑒𝑑𝑟𝑎𝑙 𝑖𝑗𝑘𝑙 = ∑ 𝑘𝑑 [1 + cos(𝑛𝜑𝑖𝑗𝑘𝑙 − 𝜑0 )] (2.17) where 𝜑𝑖𝑗𝑘𝑙 is the dihedral defined between (𝑖, 𝑗, 𝑘) and (𝑗, 𝑘, 𝑙) planes (see Figure 2.2) and is zero corresponding to a cis configuration (𝑖 and 𝑙 in the same side). 𝑛 means the multiplicity. Improper dihedrals are introduced to keep the planar groups planar or to maintain stereochemistry at chiral centers in the cases of double bonds, aromatic rings or chiral configurations. The improper dihedral angle can be defined as the angle between (𝑖, 𝑗, 𝑘) and (𝑗, 𝑘, 𝑙) planes as well (see Figure 2.2). Another harmonic potential function, similar to those for the bond stretch and angle bending terms, can be employed to describe the improper dihedral potential: 1 𝑉𝑖𝑚𝑝𝑟𝑜𝑝𝑒𝑟 𝑑𝑖ℎ𝑒𝑑𝑟𝑎𝑙 𝑖𝑗𝑘𝑙 = 2 𝑘𝑖𝑚 (𝜉𝑖𝑗𝑘𝑙 − 𝜉0 )2 (2.18) 2.2.2 Non-bonded interactions Non-bonded interactions are the sum of all the interactions from every pair of atoms in a system. The classification here distinguishes the van der Waals interactions described with a Lennard-Jones (LJ) potential from the electrostatic interactions. Chapter 2 Computational Methods | 21 Figure 2.3. Lennard-Jones potential function for the Rowley, Nicholson and Parsonage parameter set of argon112 (where /kB = 119.8K and =0.3405 nm). The plot was redrawn based on the plot at sklogwiki.113 The functional form of the LJ potential reads: 𝜎 12 𝑉𝐿𝐽 (𝑟𝑖𝑗 ) = 4𝜖𝑖𝑗 [( 𝑟𝑖𝑗 ) 𝑖𝑗 𝜎 6 − ( 𝑟𝑖𝑗 ) ] 𝑖𝑗 (2.19) where 𝜎 is the collision diameter, which is the distance of separation when the potential energy is equal to zero; 𝜖 is the well depth, the deeper the well depth, the stronger the interaction between the atoms. Figure 2.3 shows an example of a typical Lennard-Jones potential. When two atoms are at a long separation 𝑟𝑖𝑗 , the van der Waals interaction is weak and attractive. As the distance reduces, the attraction turns stronger and stronger until the atoms are so close that they start to repel each other due to the overlap of their wave functions, as inferred by the Pauli principle.114 The repulsion is of short-range and becomes very large when the distance between the two atoms is very small. In Equation (2.19), 𝜎 is related to the atom size, and 𝜖 reflects the attraction strength in terms of the potential well depth. The LJ potential function is the most widely used potential function for depicting the van der Waals interactions and it remains popular because of the computational efficiency. The Lorentz-Berthelot mixing rule115 is usually used to determine the cross-terms in the LJ potential, which can be expressed as: 1 𝜎𝑖𝑗 = 2 (𝜎𝑖𝑖 + 𝜎𝑗𝑗 ) (2.20) 𝜀𝑖𝑗 = √𝜀𝑖𝑖 𝜀𝑗𝑗 (2.21) The electrostatic interaction between two atoms is simplified as Chapter 2 Computational Methods | 22 𝑞 𝑞𝑗 0 𝑟𝑖𝑗 𝑉𝐶 (𝑟𝑖𝑗 ) = 4𝜋𝜀𝑖 (2.22) where 𝜀0 is the permittivity of free space and qi or qj is the partial atomic charge of atom i or atom j. The so-called charge distribution of a system is the result of charge assignment. Quite often, partial atomic charges are calculated from quantum mechanical methods. For example, the partial atomic charges of xyloglucan in this thesis are obtained from the quantum mechanical calculations of carbohydrates published by Woods et al.116 For another polysaccharide, chitosan, the partial atomic charges were obtained by the ensemble average of the electrostatic potential (ESP) derived originally from quantum mechanical calculations as well. The correct charge distribution of a molecule is very important for calculating the electrostatic interactions between the molecules. It should be noted that the non-bonded interactions between atoms linked by one or two bonds are excluded in a force field. The harmonic potentials described in the bonded interactions are expected to describe reasonably well the bond stretch and angle bending terms. However, as in torsional rotations, atoms are connected by three bonds, a scaled 1-4 non-bonded interaction is often taken into consideration on the basis of the bonded dihedral potential function (Equation (2.17)). The 1-4 interaction treatment increases the transferability and the flexibility in parameterizing a force field. As mentioned above, for the sake of computational cost (in terms of time), some interactions are not exactly recovered in the force field method, and it is therefore useful to treat the short-ranged and long-ranged interactions differently. Short-ranged interactions are all calculated accurately, while for long-ranged interactions some approximations are made. More specifically, cutoff radii are introduced outside which no interactions are calculated explicitly. For the LJ potential, the repulsive term decays with r-12, which can be safely ignored outside the cutoff. However, the second term - the dispersive term - needs to include a dispersive correction term, which has been studied by Allen in 1987.95 The Coulomb potential falls off as r-1 and is a longrange interaction. In a periodic system, a computationally efficient summation - the Particle mesh Ewald (PME) summation117, 118 - allows the Coulomb long-range interactions to be included to infinity and has therefore become widely used in largescale MD simulations. Chapter 2 Computational Methods | 23 2.2.3 Force fields for montmorillonite clays and polysaccharides As we know, the quality of a force field depends very much on the parameters it involves. Since many force fields have been devised for specific systems and optimized for either a specific set of organic molecules or inorganic molecules, interactions between clays, ions, water and polymers have to be based on a combination of empirical force fields. In this thesis, the CLAYFF force-field developed by Cygan et al.52 has been adopted for montmorillonite, and meanwhile, the GLYCAM force-field for carbohydrate has been employed for the polysaccharides. These two force fields have rather similar potential functions. For example, they both use harmonic terms to describe bond stretch and angle bending. There have been many similarly successful cases for combined force field applications.53, 54, 83 CLAYFF is based on an ionic description of the metal-oxygen interactions, which allow all atoms to move in the clay. It is associated with hydrated phases. The partial atomic charges of oxygen and hydroxyl are related to their occurrence in water, hydroxyl groups and substitution environments. The flexible singe-point charge (SPC) water model119 is adopted to describe the water molecule. The bond stretch and angle bending terms are all associated with water molecules, hydroxyl groups, and dissolved polyatomic molecules. Again, all the bonded interactions in CLAYFF are expressed by harmonic potential functions. Parameters for the reference bond lengths and angles are determined from published crystal structure refinements. The force constant for O-H bonds is taken from the flexible SPC water model,120 while the force constant for angles is optimized through iterative processes of comparing simulation results with experimental structures and infrared spectra of gibbsite and portlandite.121 For the non-bonded interactions, the LJ parameters for the species other than water and the hydroxyl group, are derived from known mineral structures and physical property data. The partial charges are derived from periodic density functional theory (DFT) calculations with well-optimized structures of model oxides, hydroxides, and oxyhydroxides. For a description of the detailed parameterization process of the CLAYFF force-field I refer to the work of Cygan et al.52 The inherent flexibility of polysaccharides together with the multitude of possibilities for linkage and functionality require a unique endeavor in developing their force fields.122 The GLYCAM force-field,116 which is complementary to the AMBER force-field, has been widely used to simulate carbohydrate molecules due to Chapter 2 Computational Methods | 24 the extra care about the rotamer populations for the glycosidic linkages and the torsional angle . Parameters for the harmonic terms in bonded interactions in GLYCAM are determined either from vibrational spectra, or from quantum mechanical calculations. Torsional angle parameters (dihedral parameters) are derived by fitting to an energy curve that is calculated from quantum chemical simulations for rotations around a bond, combining with the empirical parameters for the LJ potential and partial charges. Torsion parameters are transferable in GLYCAM06, wherein all atomic sequences have an explicitly defined set of torsional terms. It is notable that the torsion terms together with the non-bonded terms, are crucially important for the performance of the force field to model the conformational properties of the polysaccharides. Usually, the torsion terms are coupled with scaled 1-4 non-bonded interactions. Scaling factors are introduced to make the parameters transferable for the torsional terms. In GLYCAM, the scaling factors are set to unity both for the LJ potential and for the Coulomb potential. Parameters for the LJ terms in the nonbonded interactions are obtained through fitting the model to experimentally observed monosaccharides structural and liquid property data, such as density, which are consistent with the AMBER force-field.123 Partial atomic charges are derived by fitting to the quantum mechanics molecular electrostatic potential (MEP) at the HF/631G* level, employing the restrained electrostatic potential (RESP) charge fitting approach.116, 124 Detailed parameterization of the GLYCAM force-field and the state of current carbohydrate force fields have been reviewed by Woods et al.116, 125 2.3 Trajectory analysis In statistical physics, according to the ergodic hypothesis126, the time spent by a system in some area of the phase space of microstates that are holding the same energy after a long period of time, is proportional to the volume of this part, and all microstates become accessible with equal probability. With this hypothesis, we can calculate the time averaged property 𝑓(𝜉 (𝑡) ) of any system from a sufficiently long MD trajectory and assume that it is equally contributing to the ensemble average of that property, as indicated in the following:74, 127 1 < 𝑓 >= 𝑁 ∑𝑇1 𝑓(𝜉 (𝑡)) (2.23) It is of importance whether an equilibrium has been achieved or not. A common way is to judge the equilibrium state from the time evolution of properties, such as Chapter 2 Computational Methods | 25 energy, pressure, or root-mean-square deviation of atomic positions. They will, for sure, fluctuate during an MD simulation but fluctuations are always around a central value (a constant) when the system reaches the equilibrium. Based on such equilibrium criteria, physical and structural properties of a clay-polymer hybrid material are investigated, for example, the physical adhesion, polymer conformation transition, and atomic density distribution. 2.4 Molecular adhesion To investigate the adsorption capacity of biopolymers in clay-biopolymer systems, a free energy profile pertaining to a desorption process of a polymer from the clay surface has been developed.128, 129 The minimum work cost, also known as the work of adhesion, WA, is evaluated from the free energy difference of a detaching process. The free energy profile along a reaction coordinate is called the potential of mean force (PMF). At a given reaction coordinate ξ, the corresponding free energy is therefore a constrained free energy. This free energy measures the minimum work cost at a given reaction coordinate and the free energy difference between two constrained states can read: Δ𝐺 = −𝑘𝐵 𝑇𝑙𝑛 𝜌(𝜉) 𝜌(𝜉′) (2.24) where 𝜌(𝜉 ) is the distribution function at the state 𝜉, 𝑘𝐵 is the Boltzmann constant, and T is the temperature. In practice, 𝜌(𝜉 ) is difficult to converge in an MD simulation within a certain simulation time because of insufficient sampling. To overcome this issue, several methods, such as umbrella sampling130, 131 and steered molecular dynamics (SMD)132 simulations, have been introduced to enhance the sampling around a pre-determined reaction coordinate. 2.4.1 Steered molecular dynamics simulations Similar to the principle of Atomic Force Microscopy (AFM), in an SMD simulation, an external steering force is applied to pull a group of atoms along a desired direction. This method was developed by Schulten et al.133 Experimentally, AFM is very useful for the study of the flexibility and the adhesion of a single molecule to a surface. To model the process, in particular for the intermolecular interactions between a single polymer molecule and a clay surface, SMD has been Chapter 2 Computational Methods | 26 performed by applying a harmonic potential to induce the motion of the polymer chain along a reaction coordinate (i.e., distance away from the perpendicular direction of the clay surface) as depicted in Figure 2.4. Figure 2.4. A schematic picture of the SMD principle on an adsorbed single polymer pulling process. The force 𝑭(𝑡) is calculated from the harmonic potential 𝑉(𝑡), which reads: 1 𝑉 (𝑡) = 2 𝑘[𝑣𝑡 − (𝒓 − 𝒓0 ) ∙ 𝒏]2 (2.25) 𝑭(𝑡) = −∇𝑉(𝑡) (2.26) where k is the force constant for the spring, r and r0 are the instantaneous position and the initial position of the atom to which the spring is attached, respectively; v is a constant velocity and n is the pulling direction. The PMF profile can be calculated from the SMD simulations based on multiple MD simulations. The famous Jarzynski’s equation134 is usually put into consideration to transfer the work done in the pulling process into the free energy difference, as expressed in the following, with 𝛽=1/kBT: 𝑒 −𝛽∆𝐺 =< 𝑒 −𝛽𝑊 > (2.27) It is notable that a proper choice of the spring constant k and the constant velocity v is very important. It ensures that the reaction coordinate is closely following the constraint position, which is a prerequisite of a successful PMF profile generation. Chapter 2 Computational Methods | 27 2.4.2 Umbrella sampling Umbrella sampling is another sampling method, proposed by Torrie and Valleau in 1977.130 The principle is to overcome the insufficient sampling issue by modifying the potential of a system with a biased potential. In such treatment, unfavorable states with high energy barriers can be sampled sufficiently. A schematic picture to explain the method is drawn in Figure 2.5. Figure 2.5. Schematic picture of the umbrella sampling method. The biased potential 𝜔𝑖 (𝜉 ) is usually described as a function of the reaction coordinate 𝜉: 1 𝜔𝑖 (𝜉 ) = 2 𝑘(𝜉 − 𝜉𝑖 )2 (2.28) where k is the force constant, specifying the strength of the bias and i denotes the umbrella window. A set of separated umbrella simulations (referred to as “umbrella windows”) are performed to constrain the system at the position 𝜉𝑖𝑟 , the predetermined reaction coordinate. To compute the PMF, we need the distribution function 𝜌𝑖 (𝜉 ) as indicated in Equation 2.24. From each of the umbrella windows, an umbrella histogram is recorded, representing the biased distribution function 𝜌𝑖𝑏 (𝜉) associated with the reaction coordinate by the biased potential 𝜔𝑖 (𝜉 ). To convert the biased distribution function into a real one (unbiased 𝜌𝑖 (𝜉 )), the most widely adopted approach is the weighted histogram analysis method (WHAM), proposed by Kumar et al.135 Eventually, the PMF is derived from the WHAM equations, which are solved iteratively until the calculation is converged.135 Chapter 2 Computational Methods | 28 In this thesis, all PMFs were calculated based on the umbrella sampling approach. The reaction coordinate was defined as the distance between the polymer and the Mnt in the direction perpendicular to the clay surface. Each constrained position was predetermined by the distance defined above, which was generated from a pulling process by an SMD simulation. By splitting the pulling trajectory into 150 umbrella windows, umbrella simulations were performed individually with a biased potential as indicated in Equation 2.28. The final PMF profiles were computed by g_wham, which was developed based on the WHAM method and was implemented in the GROMACS simulation suit.136 2.5 Stress-strain curves When designing an artificial nacre-like composite material, the mechanical performance is an essential requirement. A stress-strain curve constitutes one of the most direct ways to measure the mechanical properties. Figure 2.6. Directions of the strains applied to a system. The stress-strain curve represents the elastic properties of a material. Considering that a clay system is anisotropic, the elastic properties depend on the direction. To calculate the in-plane stress-strain behavior of the system, a uniaxial extension has been applied to the periodic simulation cell by a uniform strain in the direction of the deformation (xx or yy, as shown in Figure 2.6). This calculation is valid as long as the deformation is slow, i.e., the strain rate is low (0.05 ns-1). The coordinates of the atoms can be rescaled to fit the new geometry. The calculated stress due to the external tension can be computed from the stress tensor, which reads:137 1 𝜎𝑘𝑙 = − 𝑉 ∑𝐴 (𝑀 𝐴 𝒗𝑘𝐴 𝒗𝑙𝐴 + ∑𝐵 𝒓𝑘𝐴𝐵 𝑭𝑙𝐴𝐵 ) (2.29) Chapter 2 Computational Methods | 29 where 𝜎𝑘𝑙 is the average atomic stress for the volume V of the MD system (model) and 𝑉 = ∑𝐴 𝑉 𝐴 , A is an random individual atom, 𝑀 𝐴 is the mass of each A, 𝒗𝑘𝐴 is the k-component of the velocity, 𝒗𝑙𝐴 is the l-component of the velocity, 𝑭𝑙𝐴𝐵 is the l-component of the force between atom A and atom B, and 𝒓𝑘𝐴𝐵 is the k-component of the distance between A and B.137-139 All these parameters are illustrated in Figure 2.7.137 Figure 2.7. Illustration of the parameters for the stress calculation. Figure was regenerated from the work of Frankland et al.137 The Young’s modulus by definition is calculated by86 𝐸𝑋 = 𝜎𝑥𝑥 (2.30) 𝜀𝑥𝑥 where 𝜎𝑥𝑥 is the stress recorded from the xx direction deformation, 𝜀𝑥𝑥 is the increased stain of the cell length in the xx direction, 𝜀𝑥𝑥 = 𝑥 𝑖 −𝑥 𝑥 , where x is the simulation cell length, 𝑥 𝑖 is the increased cell length of the ith step. As long as we have the stress-strain curve available, the Young’s modulus can be computed from the initial slope of the 𝜎𝑥𝑥 versus 𝜀𝑥𝑥 curve. We can calculate the Young’s modulus in the direction of yy similarly. 2.6 Limitations Two fundamental types of limitations exist in molecular dynamics simulations. One is the regular statistical limitation due to insufficient sampling of an ensemble. This limitation can be overcome when the entire phase space is sampled and each Chapter 2 Computational Methods | 30 configuration has been visited after sufficiently long simulations. The other limitation is not inherent to the simulations, but rather to what extent the size of a modelled system can represent reality. The limitations mentioned above are mainly due to the computational resources. Though we are grateful to the fast hardware and software development with highly parallel codes, the great need to properly sample a dynamic process with increasing time demands are considerably reducing the possibilities. The storage could also be a big problem. To reduce the storage demand, skipping time frames or scaling down the accuracy are two common ways. The former way will likely lead to leaving unsampled events unconsidered, while the latter way will lead to artefacts in various functions. One way to estimate the regular statistical errors is by studying the autocorrelation function as proposed by Allen and Tildesley,95 or via the block averaging approach that has been studied by Hess.140 A model of a system typically contains tens to hundreds of thousands of atoms. It varies with the aim of the simulation. How relevant a model is can be judged by qualitatively comparing the simulation data to a macroscopic property. It can be determined via regular statistical measures as well, but that is outside the scope of this thesis work. In summary, one should always bear in mind that MD simulations are neither a macroscopic nor a quantum mechanical method. The electrons are not modelled explicitly, instead, they are included implicitly in the interatomic interactions. A model system typically contains tens to hundreds of thousands of atoms. It varies with the aim of the simulation. How relevant a model is can be judged by qualitatively comparing the simulation results to those observed experimentally. Experimental agreement is a necessary although not sufficient criterion for a good simulation. Chapter 3 Molecular Models | 31 Chapter 3 Molecular Models Throughout the thesis, different models have been built for different projects to investigate different issues. A short description for each model is therefore presented in the following sections. 3.1 Interaction mechanism between xyloglucan and clay (Project I) In this project, a simplified model consisting of one xyloglucan (XG) chain and one sheet of montmorillonite clay (Mnt) was built up to study their interactions. Two types of XGs, as indicated in Figure 1.3, were put on top of the clay sheet individually. Figure 3.1 a) shows the starting conformation of the simulated system. Two main orientations were taken into consideration. They are all parallel to the clay surface with one being perpendicular to the direction of [100] (named A [0], shown in Figure 3.1 b), and the other being parallel to the direction of [100] (named B [0], shown in Figure 3.1 c). Thereby, six other orientations (A [90], A [180], A [270], B [90], B [180], and B [270]) can be generated simply by rotating the XG chain along the principal axis of the backbone clockwise by 90. Figure 3.1. Models of the XG-Mnt systems. a) initial conformation of XG-Mnt in a computational box; b) definition of orientation A [0]; c) definition of orientation B [0]. The molecular models are presented by CPK with the color scheme as: oxygen (red); hydrogen (white); carbon (cyan); silicon (yellow); aluminum (pink); sodium (blue); magnesium (dark blue. X-axis (red arrow); Y-axis (green arrow); Z-axis (blue arrow). Water molecules were not shown. This figure was from Paper I. Chapter 3 Molecular Models | 32 The XG chain models were built with the LEaP module141 from the AMBER suite of programs, according to the work of Levy et al.35 The clay sheet was built by replicating nine clay super cells (consists of four unit cells as shown in Figure 1.5 a) in the direction of X, and five in the direction of Y. Periodic boundary conditions were applied to all 3 dimensions. The in-plane clay sheet is bonded to its own periodic image covalently to mimic an infinite system. The resulting system is treated as a solute and dissolved in a rectangular box with SPC water molecules. In total, there are 56310 atoms in the modified XG-Mnt system, while there are 56856 atoms in the native XG-Mnt system. 3.2 Counterion hydration and the XG-Mnt adhesion (Project II) In this project, the aim was to investigate how different counterions affect the XG interacting with Mnt clay. A similar model has been built up as Project I. Figure 3.2 shows the outlook of the molecular model. Figure 3.2. Molecular graphics representation of the XG-Mnt clay model. The VDW blue atoms in the rectangular box present the counter ions. In this study, they can be K+, Na+, Li+ or Ca2+. Color scheme is the same as Figure 3.1. This figure was taken from Paper II. To identify the effect of ions in the fully hydrated phase, the theoretical models for all the studied cations (K+, Na+, Li+ and Ca2+) adopt aqueous ion models taken from literature.142, 143 Chapter 3 Molecular Models | 33 3.3 Hydration and dimensional stability of XG-Mnt nanocomposites (Project III) In this project, we modelled the swelling of the xyloglucan-clay combined composite. A volume ratio of 1:1 between the polymer and the clay was considered. An intercalated model consisting of two clay sheets and two interlayers filled with eight aligned XG chains were built up. The molecular model is given in Figure 3.3. The swelling behavior of the modelled XG-Mnt composite in water was compared to the hydrated models of clay, where the only difference is that the polymer XGs have been removed. Figure 3.3. Molecular model of the intercalated XG-clay composites. a) front view of the model; b) top view of the model. The gallery distance is marked as dgal; the interlayer spacing, i.e. the basal spacing, is marked as d001. Figure was taken from Paper III. 3.4 Molecular mechanisms for the adhesion of chitin and chitosan to montmorillonite clay (Project IV) This project is focused on how N-acetylation and N-protonation affect the adhesion of chitin and chitosan to Mnt clay. A series of glucosamine sequences representing chitin and chitosan were studied by varying the number of acetylated units and protonated units. Data of the studied systems are summarized in Table 3.1. A molecular presentation of the initial model has been given in Figure 3.4. Chapter 3 Molecular Models | 34 Table 3.1. Summary of the simulated systems. Table was taken from Paper IV. Systema DAb(%) CHS0%-Mnt 0 CHS20%-Mnt DPrc(%) pH No.chain atomsd No. No. ionse waterf Sequenceg 50 pH= 6.5 228 125 17431 g-p-g-p-g-p-g-p-g-p 20 50 pH = 6.5 237 124 17428 g-p-a-g-p-g-p-a-g-p CHS20%-Mnt 20 100 pH < 4 241 128 17358 p-p-a-p-p-p-p-a-p-p CHS20%-Mnt 20 0 pH > 6.5 233 120 17387 g-g-a-g-g-g-g-a-g-g CHS40%-Mnt 40 50 pH = 6.5 246 123 17328 g-a-p-g-a-p-a-g-p-a CHT60%-Mnt 60 50 pH = 6.5 255 122 17488 g-a-p-a-a-g-a-a-p-a CHT80%-Mnt 80 50 pH = 6.5 264 121 17426 a-a-g-a-a-a-a-p-a-a CHT100%-Mnt 100 N/A N/A 273 120 17416 a-a-a-a-a-a-a-a-a-a a CHS-Mnt: chitosan with montmorillonite clay, CHT-Mnt: chitin with montmorillonite clay; the number of Mnt atoms is 6400 and the total charge of Mnt clay in each system is -120; b Degree of acetylation (DA); c Degree of protonation (DPr). The three levels (0%, 50%, 100%) correspond to three pH levels, pH >6.5, pH=6.5, and pH<4, respectively; d the number of atoms of the CHS or CHT chain; e the total number of sodium and chloride ions; f the total number of water molecules in the system; g the sequence of the CHS or CHT. g: glucosamine; p: protonated glucosamine; a: acetylated glucosamine. Figure 3.4 Molecular model of a) a dimer of glucosamine; b) one super crystal unit of Mnt clay; c) the combined polymer and clay system in a computational box. The torsional angles and are defined by atoms O5 C1 O4 C4 and C1 O4 C4 C3, respectively. Figure was taken from Paper IV. Chapter 3 Molecular Models | 35 3.5 Stress-strain behavior in the chitosan-montmorillonite nanocomposites (Project V) In this work, we have calculated the mechanical properties of the combined chitosan-clay systems including several stress-strain curves and the Young’s modulus. Several models were built up to see how the degree of exfoliation and the volume fraction of the clay affect the stress-strain performance of the chitosanmontmorillonite clay (CHS-Mnt) composites. A total of 10 systems have thereby been put into study, including cases both with and without CHS, shown in Figure 3.5. The chitosan chain used in the work is the fully deacetylated one at pH = 6.5, the sequence CHS0% (the degree of acetylation in the chitosan chain is equal to 0%) is shown in Table 3.1. The molecular structures of the polymer and the clay are the same as the structure depicted in Figure 3.4 a) and b). Figure 3.5 Modelled systems for the stress-strain calculation. a) – d) Mnt clay systems with decreased order of volume fraction of Mnt; e) – j) CHS-Mnt systems with different amount of chitosan chains. h) – j) are in side view. Others are all in front view. The figure was taken from Paper V. Chapter 4 Summary of Project Work | 36 Chapter 4 Summary of Project Work 4.1 Xyloglucan-clay interaction mechanisms at wet interface (Paper I) Biopolymer xyloglucan (XG) and montmorillonite (Mnt) clay have been newly developed as “green” nanocomposite materials for the replacement of conventional petroleum-derived polymers in food package industries. The resulting biocomposites show excellent material properties even at high moisture conditions. The interfacial adhesion between the polymers and the clay at highly humid environmental conditions seems to play a key role. The structural properties of the XG, in particular, the torsional angles in the glucosidic linkage of the polymer backbone and in the side chain, are likely to be important for its adsorption process. From that outset, we have employed the MD simulation method to study the adsorption of polymer XG at the fully hydrated interface of Mnt clay. Two XGs represented by two oligomers that differ in one side chain, namely native XG (GXXLGXXXG) and modified XG (GXXXGXXXG), have been studied and compared. Figure 4.1 shows the binding affinity between the XGs and the Mnt clay by measuring the free energy differences in terms of the PMFs. Both XGs exhibit a clear affinity to the Mnt in the presence of water. It is a remarkable finding since it highlights the reason why the properties of XG-Mnt composite materials do not degrade in moisture conditions. Furthermore, the native XG shows higher affinity to Mnt than the modified one, which is another finding that is in good agreement with experimental observations8. The reason for the high affinity of the native XG to the Mnt clay is the stronger direct interactions with the clay surface. Figure 4.2 gives snapshots of the conformations for the adsorbed XGs (Figure 4.2 a and b) and the free ones (without the Mnt) in water solutions (Figure 4.2 a’ and b’). The conformational difference in the adsorbed forms of the XGs indicates that the galactose side chain in the native XG affects the conformation of the glucan backbone so that it assumes a more flat structure. In addition, the torsional angle of the side chain in native XG exhibits more “gt” conformations than that in the modified one, implicating a higher adsorption ability. Chapter 4 Summary of Project Work | 37 Figure 4.1 Free energy profiles of the native XG to clay (black line) and the modified XG to clay (red line) with the statistical error bars. The reaction coordinate is the central of mass distance between XGs and clays. =0 corresponds the fully adsorbed state, the free energy minimum of the detached process. Figure was reprinted from Paper I. Figure 4.2 The adsorbed conformation of the native XG on clay and the modified one on clay in a) and b), respectively; the free conformation of the same studied XGs without Mnt in water boxes presented in a’) and b’). All the conformations were presented in a front view. Color scheme: ochre: Mnt clays; magenta: sugar backbone residues; cyan: xylosyl residues; red: the galacosyl residue. Water molecules were not shown. In conclusion, this work reveals that the driving force of the xyloglucan adsorption is enthalpy (potential energy) and that the electrostatic contribution is slightly higher than the van der Waals contribution. The native XG exhibits stronger adsorption ability than the modified one. The adsorbed conformation of the native XG favors a more “flat” backbone, meanwhile, the extra “gt” configuration in the galactose side chain of the native XG implies that its side chain aids the adsorption process. This work provides, for the first time, an atomistic information of the interaction mechanism between xyloglucan and montmorillonite clay at a fully hydrated interface and gives clues to a polymer-clay composite material design. Chapter 4 Summary of Project Work | 38 4.2 Counterion hydration and xyloglucan adhesion at clay interfaces (Paper II) Interfacial adhesion in moist conditions is one of a most significant issue when designing nacre-mimetic clay-polymer nanocomposites. Coveney and co-workers have reported that the choice of counterions plays an important role in the adsorption of organic polymers to clay.18, 54 Most recently, our coworkers (Kochumalayil et al.) have tested the mechanical properties of the composite material comprised of the biopolymer xyloglucan (XG) and montmorillonite (Mnt) clays in different counterions conditions.129 It was found that the choice of counterion had an effect on the mechanical performance of the material, in particular, the potassium cation (K+) balanced Mnt-XG system (K-Mnt-XG) gave the highest modulus and tensile strength whereas the calcium cation (Ca2+) and sodium cation (Na+) balanced Mnt-XG systems (Ca-Mnt-XG and Na-Mnt-XG) showed lower performance in terms of stiffness. This motivated us to perform a computational study in order to understand the underlying cause of these observations. We focused on the effect of the monovalent cations K+, Na+, and Li+ as well as the divalent cation Ca2+ for mediating and stabilizing the MntXG assemblies. 4.2.1 Estimation of the work of molecular adhesion In Figure 4.3, the work of adhesion, WA is depicted for four different counterions balanced XG-Mnt systems, among which K-Mnt-XG exhibits the strongest adhesion, followed by Na-Mnt-XG, Li-Mnt-XG and the least Ca-Mnt-XG. The calculated results at the microscopic level are in a good agreement with the tested tensile properties obtained for the real material at high relative humidity, especially in the case of K-Mnt-XG.129 To explore the mechanism, the interfacial structure was studied as reviewed in the next section. Chapter 4 Summary of Project Work | 39 Figure 4.3. Free energy profiles of the desorption process of the XG from Mnt clays under different counterions conditions. The x-axis refers to the central-of-distance between the XG and clays and starts from the adsorbed conformation for each Mnt-XG system; the Y-axis denotes the work of adhesion WA. Figure was reproduced from Paper II. 4.2.2 Interfacial structure and competing mechanisms The interfacial structure is defined in the present thesis as a complex within a distance of 0.4 nm of the clay surface. It includes all the components: cations, water, XG and Mnt. Figure 4.4 left panel shows that K-Mnt-XG gets 15 out of 17 sugar residues adsorbed, followed by 10 in the case of Na-Mnt-XG, 7 for Li-Mnt-XG and only 4 for Ca-Mnt-XG. If we order the counterions after the corresponding WA of the XG to Mnt, we obtain K+ > Na+ > Li+ > Ca2+. The distribution of the ions in Figure 4.4, right panel, indicates that all ion density is located close to the interface. The fact that ions are strongly associated with the Mnt surface implies that the difference of adhesion is more related to the interfacial region instead of the solution. We suggest that the difference in calculated WA from Figure 4.3 is due to competing interactions between ions, water and the XG. Since ions are immobilized at the Mnt surface for both the two cases where the XG is either adsorbed or completely detached, water must have an important role on affecting the motion of the XG polymer in the different cation systems. The origin of this finding is analyzed below. Chapter 4 Summary of Project Work | 40 Figure 4.4. Molecular graphics of XG adsorbed on Mnt in the presence of different counter ions (left) and number density (z) of ions and XG carbons as a function of perpendicular distance z from the Mnt surface (right). The number of contacts are the number of residues within 4 Å of the clay surface. The color codes in the left panel are: residues in contact with clay (green transparent surface); residues detached from clay (blue opaque); K+ (orange transparent surface); Na+ (yellow transparent surface); Li+ (magenta transparent surface); Ca2+ (gray transparent surface). This figure was reused from Paper II. Chapter 4 Summary of Project Work | 41 4.2.3 Free energy of interfacial water Experimentally it has been found that the difference in hydration free energy between K+ and Ca2+ is very large, up to 290 kcal mol-1.144 This difference is likely to be responsible for the differences in the adhesion work calculated in Figure 4.3. Figure 4.5. a) Density distribution of water molecules as a function of distance from the clay surface before (black) and after (red) pulling off the XG, for the K-Mnt-XG system; b) PMF files of an individual water molecule as a function of distance away from the clay surface in four different cation systems. Figure 4.5 a) shows a plot of water density for the K-Mnt-XG system before and after the XG has been pulled off. By converting the density profile, (z), into a PMF (work function), one can get the PMF profile W(z) for an individual water molecule for each cation system (see Figure 4.5 b) by: W (z) kB T ln (z) const. (4.1) The chemical potential difference of the water, , between being at the clay surface region and being in the bulk can be calculated by integrating the W(z) over z:145 . (4.2) Chapter 4 Summary of Project Work | 42 The results in Table 4.1 demonstrate that the total free energy of replacing XG with water molecules costs most in the case of K+, followed by a decreased order of Na-Mnt, Li-Mnt and Ca-Mnt. Table 4.1. Free energy of interfacial water. System w a nwb Gwtot c WAd K-Mnt 0.036 140 5.0 26.9 Na-Mnt 0.024 170 4.1 17.5 Li-Mnt 0.024 150 3.6 13.3 Ca-Mnt 0.012 140 1.7 4.9 a Chemical potential of water, which is the free energy cost of bringing one water molecule from bulk to the interface in kcal mol-1. bNumber of water molecules that replace XG when it is detached from the Mnt surface. cTotal free energy of expelling water molecules from the interface as XG is detached (nw • w) in kcal mol-1. dWork of adhesion, which is the total free energy cost of detaching XG from the Mnt surface, calculated from Figure 4.5, for reference (in kcal mol -1). This table was reused from Paper II. In conclusion, we have confirmed that counterions play an important role in the adhesion of Xyloglucan to Mnt clays. Based on this work it can be suggested that counterions may play particular roles in many other polymer-clay based nanocomposite systems as well. This work clarifies the mechanisms by which counterions influence the polymer adsorption and the interfacial adhesion in a waterbased polymer-clay system, which may be helpful for the nanocomposite design and for investigating their mechanical properties. For example, from favorable interface structures the XG-Mnt composites can yield good mechanical properties in highly moist environments. 4.3 Hydration and dimensional stability of XG-Mnt nanocomposites (Paper III) Nacre has been known as a tough, strong, and very stiff biomaterial that can keep the high-performance of the material properties even at strong moist conditions. To design nacre-mimetic bio-nanocomposites, polymer xyloglucan and montmorillonite clay have often been chosen as the raw materials. The mechanical properties of resulting composites turn out as sensitive to environmental water; at a relative humidity (RH) of 50% the mechanical properties remain good, while the tensile strength is lost at RH = 90%.4 The hydration of the composite thus shows severe Chapter 4 Summary of Project Work | 43 impact for the performance of the material, which can be linked to changes in the material dimensions upon swelling. In addition, as the hydration level increases, the dynamic state of the polymer XG also plays a role in the stability of the material. It is known that biopolymer XG has strong binding affinity to the Mnt clay,128 and adding amphiphilic characteristics, it can become a potentially promising biopolymer for the use as inhibitor of clay swelling in the production of oil and gas. In paper III, the MD simulation technique has been employed to study the hydration and the dimensional stability of the XG-Mnt nanocomposite at four different hydration levels. Meanwhile, the hydrated Mnt clays have been studied for comparison. The aim was to understand how the hydration affects the stability of the composite and to gain the atomic details for the conformational transitions of the intercalated XG polymer. 4.3.1 The hydration and the dimension change of the XG-Mnt Figure 4.6. The equilibrated structures at the dry phase. a) the Mnt clay; b) the XG-Mnt complex. Drawing methods are CPK for Mnt clay and licorice for the polymer XG. Color scheme: hydrogen: white; oxygen: red; sodium: blue; carbon: cyan; aluminum: pink; magnesium: light blue; silicon: yellow; XG is in green. Figure was from Paper III. Figure 4.6 shows the equilibrated conformations for the clay minerals (Figure 4.6 a) and the XG-Mnt composite (Figure 4.6 b) at dried conditions. Four hydration levels have been investigated for the XG-Mnt and the pure Mnt clay. The amount of water - 25%, 50%, 75% and 100%, - corresponds to one-, two-, three-, and four-layer water in the hydrated Mnt clay crystalline structures, respectively. A comparison of the gallery distance as a function of the hydration level for both the composite and the clay is shown in Figure 4.7. From Figure 4.7 and combined with snapshots shown in Figure 4.8, it is found that at the hydration level of 25% the hydrated composite shows the same dimension Chapter 4 Summary of Project Work | 44 as the dried composite, reflecting a stable material system at this hydration condition. As the water content increases, the dimension change in the perpendicular direction of the clay surface starts to show up at a hydration level close to 50%. Further uptake of water to the higher hydration level of 75%, the expansion rate is 13.5%. At the 100% hydration level, the expansion rate keeps constant, suggesting a critical point at this hydration level, where the dimensional stability of the XG-Mnt composite is lost. Figure 4.7. The increase of the gallery distance dgal as a function of the hydration level for both the XG-Mnt composite and the pure clay. Figure was from Paper III. Figure 4.8. The hydrated XG-Mnt systems. From a) to d), the hydration levels are 25%, 50%, 75% and 100%, corresponding to one-, two-, three-, and four-layer XG-Mnt hydrates. Drawing method and color scheme are the same as for previous figures. Figure was from Paper III. Chapter 4 Summary of Project Work | 45 4.3.2 The swelling of the Mnt clay Figure 4.9. The hydrated Mnt clay models. From a) to d), the hydration levels are 25%, 50%, 75% and 100%, corresponding to one-, two-, three- and four-layer Mnt hydrates. Drawing method and color scheme are the same as for previous figures. Figure was from Paper III. Figure 4.9 displays the swelling process of the Mnt clay with an increased hydration level. It has been found that the swelling happens right away when water enters, until a stable single-layer hydrate formed at the hydration level of 25%. As water increases, the expansion of the Mnt increases severely. The swelling ratio from the dry phase to the single-layer hydrate reaches 31%, and gradually drops down to 22% after the second-layer hydrate is formed, to 15% for the three-layer hydrate and reaches the value of 14% at the four-layer hydrate. In conclusion, we have found that hydration strongly affects the dimensional stability of nacre-mimetic XG-Mnt clay composite materials. At a hydration level below 50%, the material is dimensionally stable. When the hydration level gets higher, the composite will swell at the same rate as the pure Mnt clay. The dynamic state of the polymer XG plays an important role. The conformational transition highly impacts the interfacial interaction to the clay minerals, suggesting an influence on the performance of the material. Chapter 4 Summary of Project Work | 46 4.4 Molecular mechanisms for the adhesion of chitin and chitosan to montmorillonite clay (Paper IV) In this project, we introduced another natural polymer, chitosan (CHS), to investigate the molecular mechanisms for its adsorption at wet montmorillonite (Mnt) clay interfaces. Also this study has a bearing on the development of nacre-mimetic nanocomposite materials. The aim was to research the mechanisms for wet adhesion of the biopolymer chitin (CHT) and CHS to the Mnt clay, as it may provide information of how charged and neutral polysaccharides adsorb on clay by varying the degree of acetylation (DA) and the degree of protonation (DPr). A series of short CHS oligomer families were studied from DA=0% (CHS) to DA=100% (CHT) in steps of 20%, at three different DPr levels (0%, 50%, 100% mimicking pH > 6.5, pH = 6.5 and pH < 4, respectively). The goal of the work was to provide a basis for rationally optimizing the DA of CHS at aqueous solution, where calculations of the binding affinity between CHS or CHT and Mnt clay may yield understanding of the mechanical performance of the CHS-Mnt nanocomposites. 4.4.1 Interfacial adhesion Three types of functional groups in CHT/CHS play the main role in determining the behavior of the polymer. Here, they are named Ac (acetyl group with the chemical structure O=C-CH3, residing on “a” units in Table 3.1 in Chapter 3), NH3+ (protonated amino group, residing on ‘p’ in Table 3.1), and NH2 (amino group, residing on ‘g’ in Table 3.1). Figure 4.10 displays the calculated binding affinity between CHS or CHT and the Mnt clay at different degree of acetylation (DA) (Figure 4.10 a) and different degree of protonation (DPr) (Figure 4.10 b). Figure 4.11 shows the adsorbed conformations for CHS and CHT at each DA and for the CHS20% at different DPr. The functional groups are highlighted in the polymer. Chapter 4 Summary of Project Work | 47 Figure 4.10. Free energy profiles for the studied CHS-Mnt or CHT-Mnt systems at different DA in a), and different DPr in b) for CHS20%. The starting point of x-axis is normalized to the adsorbed conformation in each system; the distance (z) is measured along the perpendicular direction of the clay surface. The y-axis refers to the free energy difference, known as the work of adhesion (WA). Figure 4.11. Snapshot of the equilibrated CHS or CHT-Mnt conformations, a) at different DA; b) at different DPr for CHS20%. The left panel in a) and b) is depicted in front view corresponding to each CHS-Mnt or CHT-Mnt system. The right panel in a) and b) is in top view of the conformation of CHS or CHT, corresponding to the left panel. Colour and drawing scheme: Ac (O=C-CH3): red opaque VDW; NH2 group: black opaque VDW; NH3+ group: green opaque VDW; Counter ions Na+: Blue opaque VDW; Adsorbed atoms from the CHS or CHT within 4 Å of Mnt clay surface: yellow transparent surf; Mnt clay: ochre bond; Carbon atom: cyan CPK; Nitrogen atom: blue CPK; Oxygen atom: red CPK; Hydrogen atom: white CPK. Chapter 4 Summary of Project Work | 48 By varying the degree of N-acetylation, we conclude that there are two mechanisms behind the adhesion of the studied polymer. When DA < 50%, the electrostatic interaction between the oppositely charged two species, CHS and the Mnt, acts dominantly for their adhesion; when DA > 50%, the increased number of Ac function groups in the CHT series, strongly interact with the counterions that act as an electrostatic “glue”, and result in a comparable adhesion of the CHS systems to the clay. In the cases of N-protonation, the interaction between the fully deprotonated CHS and the Mnt clay at pH > 6.5 is weaker than for the neutral CHT. This may be due to the difference in their point charge distributions at their functional group Ac and NH2. It is proposed that the smaller electrostatic interaction between the NH2 group and the counterions leads to a smaller binding affinity between the neutral CHS and the Mnt clay. 4.4.2 The role of hydrogen bonds Intramolecular hydrogen bonds have a close relation to the polymer CHS or CHT structural properties and their interactions to other species, such as Mnt clay. The orientation distribution of water molecules in the vicinity of the hydroxyl group of CHS or CHT in Figure 4.12 gives further details of the conformational feature of the adsorbed polymers as compared to the polymer configuration in water. It can be concluded that the DA of CHS has a significant impact both on the adsorbed conformation of the polymer and on the orientation distribution of the water molecules near the group -O3HO3. The higher DA, the more intramolecular hydrogen bonds formed, the more water hydrogens pointing to O3 of the polymer, which then servers more as an acceptor. In addition, the CHS at lower DPr seems to behave similarly as the CHT that contains more Ac groups. In summary, we have investigated molecular adhesion of biopolymer chitin and chitosan to Mnt clays by MD simulations. The studies illustrate that the degree of acetylation and protonation highly affects the cationic chitosan interaction to the Mnt clay. Two mechanisms are proposed and proved: 1) when DA < 50%, the direct electrostatic interaction is the main driving force for keeping the polymer at the clay; 2) when DA > 50%, the acetyl function group plays a key role for the polymer adhesion via counter ions, which act like electrostatic “glue”. The highly protonated Chapter 4 Summary of Project Work | 49 chitosan will follow the first mechanism given above for its interaction to clay, while the non-protonated (neutral) chitosan will behave similarly as chitin and follows mechanism two. The change in intramolecular hydrogen bonds before and after the polymer becomes adsorbed on clay at different DA shows that the higher the DA is, the less the flexible is the conformation on the clay surface. We believe that these pieces of evidence is of interest for chitosan-Mnt based material design. Figure 4.12. Orientation distribution of water molecules within a 0.5 nm radius of the hydroxyl O3 atom of the studied oligomers when adsorbed on Mnt. The horizontal axis shows the average value of the cosine of the angle , which is defined by two vectors: one is the water dipole vector, the other is the vector formed between the O3 and the water oxygen, as marked by the black arrows in the upper panel. The colour scheme for the sugar unit in the upper panel: carbon (cyan), oxygen (red), hydrogen (white), nitrogen (blue). Figure was reused from Paper IV. Chapter 4 Summary of Project Work | 50 4.5 Stress-strain behavior in chitosan-Mnt nanocomposites (Paper V) Studies of bio-nanocomposite chitosan-Mnt composites to fabricate nacre-like biomaterials have been very abundant. A great number of works have been carried out to improve the mechanical properties for these composites. A comprehensive understanding of the related factors are essential. That is also the motivation for paper V, where the MD simulation method was employed to generate stress-strain curves of the CHS-Mnt composite under different conditions. The understanding of the clay properties is here an important premise. A comparison of the Young’s modulus was made between the composite and the pure Mnt clay. Multi-factors were considered to learn the relation between the material properties and the material structures, such as volume fraction of the Mnt clay, degree of the exfoliation of the composite, water density and the polymer content of the composite. 4.5.1 Stress-strain behavior of Mnt clay Figure 4.13. Stress-strain curves for the pure Mnt clay in water solutions with different volume fractions. a) the deformation is along the direction of x; b) the deformation is along the direction of y. Chapter 4 Summary of Project Work | 51 Figure 4.14. The Young’s modulus (Exx, Eyy) as functions of a) the volume fraction of Mnt clay, b) the water density, and c) the basal spacing. Figure 4.13 together with Figure 4.14 show that the stiffness of the Mnt clay is quite high. It is common knowledge that its reinforcement function is highly related to the interlayer structures and the water content. As shown from Figure 4.14, the significantly high Young’s modulus (Exx ~ 170GPa) for the non-exfoliated clay plus the interlayer can drop dramatically to Exx~ 23 GPa for the fully exfoliated clay. 4.5.2 Stress-strain behavior of CHS-Mnt Figure 4.15 a) displays the stress-strain relation for the CHS-Mnt composite at different interfacial structures with different volume fractions of clay. The general finding is that the partially exfoliated composites show significantly larger tensile strength than in the fully exfoliated composite. The high volume fraction of clay is the main reason. However, the slight difference in the results of Young’s modulus shown in Figure 4.16 together with the stress-strain curve in Figure 4.15 b) indicate that the increase of the polymer content can hardly improve the mechanical properties of the modelled nanocomposites. Chapter 4 Summary of Project Work | 52 Figure 4.15. The stress-strain curves for the CHS-Mnt composite in the deformation direction of X. a) the stress-strain change for the composite with different volume fractions of the Mnt clay; b) the stress-strain behavior for the fully exfoliated CHS-Mnt composite with different amount of CHS chains. Figure 4.16. A comparison of the Young’s modulus for both CHS-Mnt composite and the pure Mnt clay in the deformation direction of X. 36vol% and 28vol% Mnt are in the partially exfoliated composite structure; 8vol%Mnt is in a fully exfoliated composite structure. In conclusion, the prediction of the materials properties is dependent on the understanding of the materials structures, which is particularly true for the nanocomposites studied in this thesis. To improve the high-performance of the CHSMnt composite, focus can be put on the understanding of the specific interfacial structures. A high volume fraction of the clay is necessary, at the same time, a good interfacial adhesion between the polymer and the clay particle is also an essential premise. Chapter 5 Conclusions and Outlook | 53 Chapter 5 Conclusions and Outlook In this thesis, we have explored biopolymer-clay nanocomposite materials by using related system models and molecular modelling. Two biopolymers, i.e. xyloglucan (XG) and chitosan (CHS), and one smectite clay, montmorillonite (Mnt), have been adopted as the raw materials to develop two-phase nanocomposites XGMnt and CHS-Mnt. The nature rich origin qualifies these bio-nanocomposites as renewable and sustainable materials with promising societal value for the future. There are two alternative starting points for developing these bionanocomposites. One is to reinforce the polymeric soft materials while keeping the ductility. Hence, the fact that adding only a small volume fraction of the Mnt enhances the mechanical properties of the material is appealing; second is to develop a composite that can be truly stiff, strong and with some ductility, which can mimic the nacre material found in nature. Then, a high volume fraction of the Mnt clay is desirable. No matter what the starting purpose is, the practical issues, such as the moisture sensitivity, the possibility of a uniform dispersion of the nanoparticles, the dimensional stability, etc., are all related to the interfacial mechanisms and the behavior of the surrounding species (counter ions, solutes, solvents). In addition, the understanding of the relation between the structures of the composites and their mechanical properties is essential. Fundamental research has been boosted to investigate the mechanisms and to increase the understanding of these important materials. Molecular dynamics (MD) simulations have been known as a powerful tool to catch the molecular details of many-body systems. A lot of macroscopic properties can be described by averaging a great many of microscopic states from the MD trajectory. Although the simulation cannot tell a real process of the polymer adhesion to the clay, it is an excellent complement to experimental tests. In addition, the threedimension visualizable dynamics present in the MD trajectories are very useful for the understanding of the conformational transitions in the composite material. In this thesis, we have, for the first time, systematically investigated the interfacial adhesion between the biopolymers (XG or CHS) and the Mnt clay by using MD simulations. For this purpose we have utilized the high performance computing infrastructure and the optimized MD algorithms implemented in the GROMACS package.90-93 Chapter 5 Conclusions and Outlook | 54 For the XG-Mnt composite, we have investigated the adsorption of XG polymers to Mnt clay in fully hydrated conditions. The binding affinity of the native XG is found to 27 kcal mol-1, which is only a little smaller than the binding affinity between the XG and the crystalline cellulose (34 kcal mol-1). Considering the important role of XG in the linkage of cellulose microfibrils, the 7 kcal mol -1 difference still suggests a significant binding affinity between the native XG and the Mnt. Studying the mechanism, we have found that the direct strong interaction between the XG and the clay is driven by enthalpy, i.e., the potential energy between the two phases. In addition, the adsorbed conformation of the native XG shows a quite flat structure where the galactose residue in the side chain seems to facilitate the adsorption of the XG. These results are qualitatively in agreement with experimental work in which the high tensile properties have been tested in native XG-Mnt composites. When including the counterions in the XG-Mnt interfacial space, we have found that the interfacial adhesion is highly affected by the hydration of the counterions. Four different counterions (K+, Na+, Li+, and Ca2+) have been individually studied in the wet XG-Mnt system. The work of adhesion between the polymer and the clay at different counterion conditions follows the order K-Mnt/XG > Na-Mnt/XG > LiMnt/XG > Ca-Mnt/XG. The difference in adhesion in different counterions systems is due to competing interactions between ions, water and XG. This study confirms the important role that the counterions play in the polymer-clay composite material. It highlights the competing mechanisms at the XG-Mnt interface, which is very helpful for developing new nanocomposites. Highly hydrated situations pose a big challenge for the bio-nanocomposites. The dimensional stability is closely related to the hydration of the composite. We have investigated the dimensional stability of both the XG-Mnt composite and the pure Mnt clay at four different hydration levels. It has been found that at a hydration level below 50%, the XG-Mnt composite can remain stable, suggesting a constant tensile property, while the clay has been found to swell as soon as water is entering. When the hydration level reaches 100%, the inter-gallery of the composite is found to swell with the same pace as the clay. It suggests a critical point of losing the dimensional stability of the XG-Mnt composite at the hydrated conditions. For the CHS-Mnt composite, we have studied the molecular adhesion between the polymer chitosan and the Mnt clay. The effects from the N-acetylation and Nprotonation on the interfacial adhesion have been inspected thoroughly. There are two Chapter 5 Conclusions and Outlook | 55 mechanisms discussed: When the degree of acetylation (DA) is below 50%, the electrostatic interaction arising from direct charge-charge attraction is the main driving force for the adsorption of CHS to the clay; when the DA is higher than 50%, the highly acetylated CHS turns into chitin (CHT), and the strong correlation arising from the charge distribution of the acetyl function group and the counterions start to play the key role for the adhesion of the chitin to the Mnt clay. The unexpected poor adhesion between the fully deprotonated CHS and the clay is suspected to attribute to the smaller correlation between the amino group and the counterions. The intramolecular hydrogen bonds in the polymer CHS are influenced by the interaction between the polymer and the clay. It is found that the higher the DA is, the more the intra-hydrogen bonds found in the adsorbed polymer. The fully deprotonated CHS behaves similarly to CHT that forms less flexible conformation by the intra-hydrogen bonds presented both in water and in the adsorbed conformation on the clay surface. The stress-strain curves serve as good representations of the mechanical properties of the composite materials. The deformation calculations show that Mnt clay possesses high stiffness. The Young’s moduli are found to be as high as Exx~170 GPa. The stress-strain behavior of the tested CHS-Mnt composite shows that the strength is directly related to the volume fraction of the Mnt clay with a partially exfoliated structure. The exfoliated CHS-Mnt composite in the fully hydrated situation has been found to show a relatively poor mechanical performance, the Young’s moduli of which is only Exx~ 25 GPa, which is also found to relate to the low volume fraction of the clay. The biopolymer-clay based bio-nanocomposites have a great potential to replace petroleum-derived plastic materials. Although a lot of biopolymers have been proposed as raw materials to prepare the nanocomposites, xyloglucan and chitosan are outstanding by their abundance and unique properties. Further development of those nanocomposites consisting of either XG and Mnt or CHS and Mnt will be achieved by developing new experimental methods and increasing the understanding of how each component, such as the polymer, the clay, water, ions, solution, interacts with each other. It is my hope that my thesis work gives support to the notion that computational modelling will be an important part of that future endeavor. References | 56 References 1. Johansson, C.; Bras, J.; Mondragon, I.; Nechita, P.; Plackett, D.; Šimon, P.; Svetec, D. G.; Virtanen, S.; Baschetti, M. G.; Breen, C.; Clegg, F.; Aucejo, S. , BioRes. 2012, 7, 2506-2552. 2. Gandini, A., Macromolecules 2008, 41, 9491-9504. 3. Yao, H. B.; Tan, Z. H.; Fang, H. Y.; Yu, S. H., Angew. Chem. Int. Ed. 2010, 49, 10127-10131. 4. Kochumalayil, J. J.; Morimune, S.; Nishino, T.; Ikkala, O.; Walther, A.; Berglund, L. A., Biomacromolecules 2013, 14, 3842-3849. 5. Liu, A.; Berglund, L. A., Carbohydr. Polym. 2012, 87, 53-60. 6. Wang, J.; Cheng, Q.; Tang, Z., Chem. Soc. Rev. 2012, 41, 1111-1129. 7. Ruiz-Hitzky, E.; Aranda, P.; Darder, M.; Rytwo, G., J. Mater. Chem. 2010, 20, 9306-9321. 8. Kochumalayil, J. J.; Bergenstråhle-Wohlert, M.; Utsel, S.; Wågberg, L.; Zhou, Q.; Berglund, L. A., Biomacromolecules 2013, 14, 84-91. 9. Mishra, A.; Malhotra, A. V., J. Mater. Chem. 2009, 19, 8528-8536. 10. Shchipunov, Y.; Ivanova, N.; Silant'ev, V., Green Chem. 2009, 11, 1758-1761. 11. Giannakas, A.; Grigoriadi, K.; Leontiou, A.; Barkoula, N.-M.; Ladavos, A., Carbohydr. Polym. 2014, 108, 103-111. 12. Dutta, P. K.; Dutta, J.; Tripathi, V., J. Sci. Ind. Res. 2004, 63, 20-31. 13. Tiraferri, A.; Maroni, P.; Caro Rodríguez, D.; Borkovec, M., Langmuir 2014, 14. 15. 16. 17. 18. 19. 20. 21. 22. 30, 4980-4988. Myllärinen, P.; Partanen, R.; Seppälä, J.; Forssell, P., Carbohydr. Polym. 2002, 50, 355-361. Okada, A.; Usuki, A., Macromol. Mater. Eng. 2006, 291, 1449-1476. Boulet, P.; Coveney, P. V.; Stackhouse, S., Chem. Phys. Lett. 2004, 389, 261267. Franca, E. F.; Lins, R. D.; Freitas, L. C. G.; Straatsma, T. P., J. Chem. Theory Comput. 2008, 4, 2141-2149. Bains, A. S.; Boek, E. S.; Coveney, P. V.; Williams, S. J.; Akbar, M. V., Mol. Simulat. 2001, 26, 101-145. Zhang, Y.; Gu, Q.; Yin, J.; Wang, Z.; He, P., Adv. Polym. Tech. 2014, 33, 21400. Pradhan, S.; Katti, K.; Katti, D., Int. J. Geomech. 2014, 04014073. Boek, E. S.; Coveney, P. V.; Skipper, N. T., Langmuir 1995, 11, 4629-4631. Kukol, A., Molecular modelling of proteins. Springer: 2008. References | 57 23. Hayashi, T.; Kaida, R., Mol. Plant 2011, 4, 17-24. 24. Rudraiah, S. M. K. In Extraction and isolation of acidic galactoxyloglucanases from the germinating seeds of Tamarindus indica, 36th Symposium on Biotechnology for Fuels and Chemicals; 2014. 25. Kochumalayil, J. J.; Berglund, L. A., Green Chem. 2014, 16, 1904-1910. 26. Singh, D.; Wangchu, L.; Moond, S. K., Nat Prod Rad 2007, 6, 315-321. 27. Kumar, C. S.; Bhattacharya, S., Crit. Rev. Food Sci. Nutr. 2008, 48, 1-20. 28. Fry, S. C.; York, W. S.; Albersheim, P.; Darvill, A.; Hayashi, T.; Joseleau, J.-P.; Kato, Y.; Lorences, E. P.; Maclachlan, G. A.; McNeil, M.; Mort, A. J.; Grant Reid, J. S.; Seitz, H. U.; Selvendran, R. R.; Voragen, A. G. J.; White, A. R., Physiol. Plant. 1993, 89, 1-3. 29. Urakawa, H.; Mimura, M.; Kajiwara, K., Trends Glycosci. Glyc. 2002, 14, 355376. 30. Hayashi, T., Annu. Rev. Plant Biol. 1989, 40, 139-168. 31. Kato, Y.; Ito, S.; Iki, K.; Matsuda, K., Plant Cell Physiol. 1982, 23, 351-364. 32. Zhang, Q.; Brumer, H.; Ågren, H.; Tu, Y., Carbohydr. Res. 2011, 346, 25952602. 33. Kochumalayil, J. J.; Sehaqui, H.; Zhou, Q.; Berglund, L. A., J. Mater. Chem. 2010, 20, 4321-4327. 34. Kochumalayil, J. J., personal communicaion., 2014. 35. Levy, S.; York, W. S.; Stuike-Prill, R.; Meyer, B.; Staehelin, L. A., Plant J. 1991, 1, 195-215. 36. Yamatoya, K.; Shirakawa, M., Curr Trends Polym Sci 2003, 8, 27-72. 37. Simi, C. K.; Abraham, T. E., Colloid. Polym. Sci. 2010, 288, 297-306. 38. Heinz, H.; Vaia, R. A.; Krishnamoorti, R.; Farmer, B. L., Chem. Mater. 2007, 19, 59-68. 39. Lee, D. W.; Lim, H.; Chong, H. N.; Shim, W. S., Open Biomater. J. 2009, 1, 1020. 40. Laufer, G.; Kirkland, C.; Cain, A. A.; Grunlan, J. C., Appl. Mater. Interfaces 2012, 4, 1643-1649. 41. Darder, M.; Colilla, M.; Ruiz-Hitzky, E., Chem. Mater. 2003, 15, 3774-3780. 42. Kurita, K., Prog. Polym. Sci. 2001, 26, 1921-1971. 43. Desbrieres, J., Polymer 2004, 45, 3285-3295. 44. Rudall, K.; Kenchington, W., Biol. Rev. 1973, 48, 597-633. 45. Cunha, R. A.; Franca, E. F.; Soares, T. A.; Rusu, V. H.; Pontes, F. J. S.; Lins, R. D., The Molecular Structure and Conformational Dynamics of Chitosan References | 58 46. 47. 48. 49. 50. 51. 52. 53. 54. 55. 56. 57. 58. 59. 60. Polymers: An Integrated Perspective from Experiments and Computational Simulations. 2012. Rinaudo, M., Prog. Polym. Sci. 2006, 31, 603-632. Vold, I.; Vårum, K. M.; Guibal, E.; Smidsrød, O., Carbohydr. Polym. 2003, 54, 471-477. Darder, M.; Colilla, M.; Ruiz-Hitzky, E., Appl. Clay Sci. 2005, 28, 199-208. Podsiadlo, P.; Tang, Z.; Shim, B. S.; Kotov, N. A., Nano Lett. 2007, 7, 12241231. Schoonheydt, R. A.; Pinnavaia, T.; Lagaly, G.; Gangas, N., Pure Appl. Chem. 1999, 71, 2367-2371. Grim, R. E., Applied clay mineralogy. McGraw-Hill New York: 1962. Cygan, R. T.; Liang, J. J.; Kalinichev, A. G., J. Phys. Chem. B 2004, 108, 12551266. Chen, B.; Evans, J. R. G.; Greenwell, H. C.; Boulet, P.; Coveney, P. V.; Bowden, A. A.; Whiting, A., Chem. Soc. Rev. 2008, 37, 568-594. Greenwell, H. C.; Bowden, A. A.; Chen, B.; Boulet, P.; Evans, J. R. G.; Coveney, P. V.; Whiting, A., J. Mater. Chem. 2006, 16, 1082-1094. Okada, A.; Usuki, A., Mater. Sci. Eng., C 1995, 3, 109-115. Zeng, Q.; Yu, A.; Lu, G.; Paul, D., J. Nanosci. Nanotechnol. 2005, 5, 1574-1592. Landman, E.; Focke, W., J. Mater. Sci. 2006, 41, 2271-2279. Aguzzi, C.; Cerezo, P.; Viseras, C.; Caramella, C., Appl. Clay Sci. 2007, 36, 2236. Suter, J. L.; Anderson, R. L.; Greenwell, H. C.; Coveney, P. V. , J. Mater. Chem. 2009, 19, 2482-2493. Ray, S. S.; Bousmina, M., Prog. Mater Sci. 2005, 50, 962-1079. 61. Chivrac, F.; Pollet, E.; Avérous, L., Mater. Sci. Eng. R-Rep. 2009, 67, 1-17. 62. Jackson, A.; Vincent, J.; Turner, R., Proc. R. Soc. Lond., Ser. B: Biol. Sci. 1988, 234, 415-440. 63. Mayer, G., Science 2005, 310, 1144-1147. 64. Song, F.; Soh, A.; Bai, Y., Biomaterials 2003, 24, 3623-3631. 65. Li, X.; Chang, W.-C.; Chao, Y. J.; Wang, R.; Chang, M., Nano Lett. 2004, 4, 613-617. 66. Tang, Z.; Kotov, N. A.; Magonov, S.; Ozturk, B., Nat Mater 2003, 2, 413-418. 67. Sarikaya, M.; Aksay, I. A., Structure, Cellular Synthesis and Assembly of Biopolymers. Springer-Verlag: Amsterdam, 1992. 68. Deville, S.; Saiz, E.; Nalla, R. K.; Tomsia, A. P., Science 2006, 311, 515-518. References | 59 69. Podsiadlo, P.; Kaushik, A. K.; Arruda, E. M.; Waas, A. M.; Shim, B. S.; Xu, J.; Nandivada, H.; Pumplin, B. G.; Lahann, J.; Ramamoorthy, A., Science 2007, 318, 80-83. 70. Zhitomirsky, I., J. Mater. Sci. 2006, 41, 8186-8195. 71. Almqvist, N.; Thomson, N. H.; Smith, B. L.; Stucky, G. D.; Morse, D. E.; Hansma, P. K., Mater. Sci. Eng., C 1999, 7, 37-43. 72. Heuer, A. H.; Fink, D.; Laraia, V.; Arias, J.; Calvert, P.; Kendall, K.; Messing, G.; Blackwell, J.; Rieke, P.; Thompson, D., Science 1992, 255, 1098-1105. 73. Pizem, H.; Sukenik, C. N.; Sampathkumaran, U.; McIlwain, A. K.; De Guire, M. R., Chem. Mater. 2002, 14, 2476-2485. 74. Bergenstråhle, M. Crystalline cellulose in bulk and at interfaces as studied by atomistic computer simulations. KTH-Royal Institute of Technology, Stockholm, 2008. 75. Newton, I., Opticks. Smith, Walford: London, 1704 (reprinted Dover, New York, 1952, p376). 76. Kendall, K., Molecular adhesion and its applications: the sticky universe. Springer Science & Business Media: 2001. 77. van der Waals, J. D., Over de Continuiteit van den Gas- en Vloeistoftoestand (on the continuity of the gas and liquid state). AW Sijthoff: 1873. 78. Parreira, P.; Shi, Q.; Magalhaes, A.; Reis, C.; Bugaytsova, J.; Bor é n, T.; 79. 80. 81. 82. 83. Leckband, D.; Martins, M., J. R. Soc. Interface 2014, 11, 20141040. Boek, E. S.; Coveney, P. V.; Skipper, N. T., J. Am. Chem. Soc. 1995, 117, 1260812617. Teppen, B. J.; Rasmussen, K.; Bertsch, P. M.; Miller, D. M.; Schäfer, L., J. Phys. Chem. B 1997, 101, 1579-1587. Greenwell, H. C.; Jones, W.; Coveney, P. V.; Stackhouse, S., J. Mater. Chem. 2006, 16, 708-723. Wang, J.; Cieplak, P.; Kollman, P., Comput. Chem 2000, 21, 1049-1074. Thyveetil, M.-A.; Coveney, P. V.; Greenwell, H. C.; Suter, J. L., J. Am. Chem. Soc. 2008, 130, 4742-4756. 84. Stackhouse, S.; Coveney, P. V.; Sandré, E., J. Am. Chem. Soc. 2001, 123, 1176411774. 85. Thyveetil, M. A.; Coveney, P. V.; Suter, J. L.; Greenwell, H. C., Chem. Mater. 2007, 19, 5510-5523. References | 60 86. Suter, J. L.; Coveney, P. V.; Greenwell, H. C.; Thyveetil, M. A., J. Phys. Chem. C 2007, 111, 8248-8259. 87. Klein, M. L.; Shinoda, W., Science 2008, 321, 798-800. 88. Alder, B. J.; Wainwright, T. E., J. Chem. Phys. 1957, 27, 1208. 89. Alder, B. J.; Wainwright, T., J. Chem. Phys. 1959, 31, 459-466. 90. Berendsen, H. J. C.; van der Spoel, D.; van Drunen, R. , Comp. Phys. Comm. 1995, 91, 43-56. 91. Lindahl, E.; Hess, B.; van der Spoel, D., J. Mol. Mod. 2001, 7, 306-317. 92. van der Spoel, D.; Lindahl, E.; Hess, B.; Groenhof, G.; Mark, A. E.; Berendsen, H. J. C., J. Comput. Chem. 2005, 26, 1701-1718. 93. Hess, B.; Kutzner, C.; van der Spoel, D.; Lindahl, E. , J. Chem. Theory Comput. 2008, 4, 435-447. 94. Verlet, L., Phys. Rev. 1967, 159, 98. 95. Allen, M. P.; Tildesley, D. J., Computer simulation of liquids. Clarendon Press: Oxford, 1987. 96. Swope, W. C.; Andersen, H. C.; Berens, P. H.; Wilson, K. R., J. Chem. Phys. 1982, 76, 637-649. 97. Hockney, R. W., Methods Comput. Phys. 1970, 9, 135-211. 98. Yeh, I. C.; Hummer, G., J. Phys. Chem. B 2004, 108, 15873-15879. 99. Yang, L.; Yang, N.; Li, B., Nano Lett. 2014, 14, 1734-1738. 100. Bekker, H.; Van Den Berg, J. P.; Wassenaar, T. A., J. Comput. Chem. 2004, 25, 1037-1046. 101.Bekker, H.; Dijkstra, E. J.; Renardus, M. K. R.; Berendsen, H. J. C., Mol. Simulat. 1995, 14, 137-151. 102 .van der Spoel, D.; Lindahl, E.; Hess, B. , the GROMACS development team, GROMACS User Manual version 4.6.7. In www.gromacs.org, 2014. 103. van der Spoel, D.; Lindahl, E.; Hess, B.; van Buuren, A. R.; Apol, E.; Meulenhoff, P. J.; Tieleman, D. P.; Sijbers, A. L. T. M.; Feenstra, K. A.; van Drunen, R.; Berendsen, H. J. C. Gromacs User Manual version 4.5.4, 2010. 104. Hansen, J. P.; McDonald, I. R., Theory of simple liquids. Elsevier: 1990. 105.Berendsen, H. J. C.; Postma, J. P. M.; van Gunsteren, W. F.; DiNola, A.; Haak, J. R., J. Chem. Phys. 1984, 81, 3684-3690. 106. Andersen, H. C., J. Chem. Phys. 1980, 72, 2384-2393. 107. Bussi, G.; Donadio, D.; Parrinello, M., J. Chem. Phys. 2007, 126, 014101. 108. Nosé, S., Mol. Phys. 1984, 52, 255-268. 109. Hoover, W. G., Phys. Rev. A 1985, 31, 1695-1697. References | 61 110.Parrinello, M.; Rahman, A., J. Appl. Phys. 1981, 52, 7182-7190. 111.Nosé, S.; Klein, M. L., Mol. Phys. 1983, 50, 1055-1076. 112.Rowley, L. A.; Nicholson, D.; Parsonage, N. G., J. Comput. Phys. 1975, 17, 401414. 113.Sklogwiki Lennard-Jones model. http://www.sklogwiki.org/SklogWiki/index.php/Lennard-Jones_model, 2014. 114.Leach, A. R., Molecular modeling: principles and applications. Pearson Education: 2001. 115.Hirschfelder, J. O.; Curtiss, C. F.; Brid, R. B., Molecular Theory of Gases and Liquids. Wiley:New York, 1954. 116.Kirschner, K. N.; Yongye, A. B.; Tschampel, S. M.; González-Outeiriño, J.; Daniels, C. R.; Foley, B. L.; Woods, R. J., J. Comput. Chem. 2008, 29, 622-655. 117.Darden, T.; York, D.; Pedersen, L., J. Chem. Phys. 1993, 98, 10089-10092. 118.Essmann, U.; Perera, L.; Berkowitz, M. L.; Darden, T.; Lee, H.; Pedersen, L. G., J. Chem. Phys. 1995, 103, 8577-8593. 119.Berendsen, H. J. C.; Postma, J. P. M.; van Gunsteren, W. F.; Hermans, J., Interaction models for water in relation to protein hydration. Springer Netherlands: 1981; Vol. 14. 120.Teleman, O.; Jönsson, B.; Engström, S., Mol. Phys. 1987, 60, 193-203. 121.Farmer, V. C., Infrared spectra of minerals. Mineralogical society: 1974. 122.Vliegenthart, J. F.; Woods, R. J., NMR spectroscopy and computer modeling of carbohydrates: recent advances. American Chemical Society Washington, DC: 2006. 123.Wang, J.; Wolf, R. M.; Caldwell, J. W.; Kollman, P. A.; Case, D. A., J. Comput. Chem. 2004, 25, 1157-1174. 124.Bayly, C. I.; Cieplak, P.; Cornell, W.; Kollman, P. A., J. Phys. Chem. 1993, 97, 10269-10280. 125.Fadda, E.; Woods, R. J., Drug Discov. Today 2010, 15, 596-609. 126.Boltzmann, L., Vorlesungen über Gastheorie. Leipzig, J.A. Barth: 1898. 127.Oliveira, C. R. d.; Werlang, T., Revista Brasileira de Ensino de Física 2007, 29, 189-201. 128.Wang, Y.; Wohlert, J.; Berglund, L. A.; Tu, Y.; Ågren, H., J. Mater. Chem. A 2014, 2, 9541-9547. 129.Wang, Y.; Wohlert, J.; Bergenstråhle-Wohlert, M.; Kochumalayil, J. J.; Berglund, L. A.; Tu, Y.; Ågren, H., Biomacromolecules 2015, 16, 257-265. References | 62 130.Torrie, G. M.; Valleau, J. P., J. Comput. Phys. 1977, 23, 187-199. 131.Kästner, J., Wiley Interdiscip. Rev. Comput. Mol. Sci. 2011, 1, 932-942. 132.Park, S.; Khalili-Araghi, F.; Tajkhorshid, E.; Schulten, K., J. Chem. Phys. 2003, 119, 3559-3566. 133.Izrailev, S.; Stepaniants, S.; Isralewitz, B.; Kosztin, D.; Lu, H.; Molnar, F.; Wriggers, W.; Schulten, K., Steered Molecular Dynamics. In Computational Molecular Dynamics: Challenges, Methods, Ideas, Deuflhard, P.; Hermans, J.; Leimkuhler, B.; Mark, A.; Reich, S.; Skeel, R., Eds. Springer Berlin Heidelberg: 1999; Vol. 4, pp 39-65. 134.Jarzynski, C., Physical Review E 1997, 56, 5018. 135.Kumar, S.; Rosenberg, J. M.; Bouzida, D.; Swendsen, R. H.; Kollman, P. A., J. Comput. Chem. 1992, 13, 1011-1021. 136.Hub, J. S.; de Groot, B. L.; van der Spoel, D., J. Chem. Theory Comput. 2010, 6, 3713-3720. 137.Frankland, S. J. V.; Harik, V. M.; Odegard, G. M.; Brenner, D. W.; Gates, T. S., Composites Sci. Technol. 2003, 63, 1655-1661. 138.Nielsen, O. H.; Martin, R. M., Physical Review B 1985, 32, 3780-3791. 139.Vitek, V.; Egami, T., Phys. Status Solidi B 1987, 144, 145-156. 140.Hess, B., J. Chem. Phys. 2002, 116, 209-217. 141.Macke, T. J.; Svrcek-Seiler, W.; Brown, R. A.; Kolossváry, I.; Bomble, Y. J.; Case, D. A.; Zhang, W.; Hou, T.; Schafmeister, C.; Ross, W. S., AmberTools Users' Manual. 2010. 142.Smith, D. E.; Dang, L. X., J. Chem. Phys. 1994, 100, 3757-3766. 143.Koneshan, S.; Rasaiah, J. C.; Lynden-Bell, R. M.; Lee, S. H., J. Phys. Chem. B 1998, 102, 4193-4204. 144.Marcus, Y., Chem. Rev. 2009, 109, 1346-1370. 145.Kapla, J.; Wohlert, J.; Stevensson, B.; Engström, O.; Widmalm, G.; Maliniak, A., J. Phys. Chem. B 2013, 117, 6667-6673.


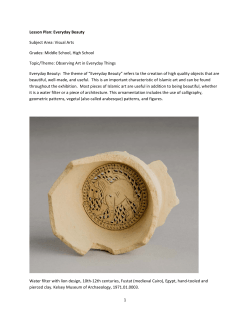


© Copyright 2026