
3. Local Economy: Literature Review Airports Commission www.pwc.co.uk
www.pwc.co.uk
3. Local Economy:
Literature Review
Airports Commission
Final report
November 2014
Important notice
This document has been prepared for the Airports Commission in accordance with the terms of the Provision of
Consultancy for Commercial, Financial and Economic Option Appraisal and Analysis (DfT) framework and the
Contract Reference RM 2750 (650) dated 12th February 2014 and solely for the purpose and on the terms
agreed with the Airports Commission within the Project Inception Document reference 3.1 dated 1st April 2014.
We accept no liability (including for negligence) to anyone else in connection with this document.
This document contains information obtained or derived from a variety of third party sources as indicated
within the document. PricewaterhouseCoopers LLP (‘PwC’) has used industry recognised or relevant third party
sources, but has not validated or verified the information/ data provided.
Should any person other than the Airports Commission obtain access to and read this document, such persons
accepts and agrees to the following terms:
1.
The reader of this document understands that the work performed by PwC was performed in accordance
with instructions provided by our client, the Airports Commission, and was performed exclusively for
their benefit and use. The document may therefore not include all matters relevant to the reader.
2.
The reader agrees that PwC accepts no liability (including for negligence) to them in connection with this
document.
3. Local Economy: Literature Review
Contents
1
Executive summary
1
1.1
Background
1
1.2
Aim of project
1
1.3
Approach
1
1.4
Key findings
2
2
Introduction
7
2.1
Background
7
2.2
Aim of project
7
2.3
Approach
7
2.4
Report structure
8
3
Business and services
9
Direct impacts
Indirect & induced impacts
Catalytic impacts
Investment and productivity
Tourism
Clustering & agglomeration economies
9
9
9
9
10
10
Types of business and services associated with airport
operation
11
Direct economic impacts
11
Methodological issues
15
Indirect and induced impacts
15
Methodological issues - multiplier estimates
17
Catalytic impacts of airports
17
Influence of connectivity on business location decisions
Impact on productivity of local firms
Impact on tourism
Impact on clustering & agglomeration
18
18
19
22
3.5
Industry structure in London
27
4
Labour demand and supply
32
Labour demand & supply
Direct impacts
Indirect& induced impacts
Catalytic impacts
Investment & productivity
Tourism
32
32
32
33
33
33
Labour demand
33
3.1
3.2
3.3
3.4
4.1
Airports Commission
PwC Contents
3. Local Economy: Literature Review
4.2
5
5.1
5.2
Employment
Skills mix
Labour productivity
Indirect and induced employment
Catalytic employment
33
34
35
37
37
Labour supply
38
Potential sources of labour supply
Place of residence of airport employees
Commuting patterns
38
39
40
Housing & land
42
Housing
Land
42
42
Housing
43
Factors influencing individuals’ decisions to live in the locality of an
airport
43
Land
44
Influence of accessibility on location of commercial property
developments
Land use planning around Gatwick and Heathrow airports
47
49
Appendix A. - London Heathrow
51
A.1. Introduction
51
A.2. Background
51
A.3. Employment and value added
53
A.4. Earnings and skills
55
A.5. Labour supply
56
A.6. Housing
58
Appendix B. - London Gatwick
62
B.1. Introduction
62
B.2. Background
62
B.3. Labour demand
64
B.4. Labour supply
66
B.5. Housing
66
Appendix C. - Manchester
68
C.1. Introduction
68
C.2. Background
68
C.3. Employment and value added
68
Appendix D. - New York
73
D.1. Introduction
73
D.2. Background
73
D.3. Economic impact
74
Airports Commission
PwC Contents
3. Local Economy: Literature Review
D.4. Tourism
79
D.5. Economic impact of aviation in the USA
80
Appendix E. - Frankfurt am Main
82
E.1. Introduction
82
E.2. Background
82
E.3. Economic impacts
83
E.4. Intermodal connections at Frankfurt am Main
92
Appendix F. - Paris (Charles de Gaulle)
100
F.1. Introduction
100
F.2. Background
100
F.3. Economic impacts
103
Appendix G. - Bibliography
106
Airports Commission
PwC Contents
3. Local Economy: Literature Review
1 Executive summary
1.1 Background
PricewaterhouseCoopers (PwC) was commissioned by the Airports Commission to undertake research designed
to provide the Commission with a better understanding of the impacts of airports and airport expansions on
local economies. Our research is intended to inform the Commissioners’ final decision on the preferred longterm expansion option by feeding into further work to set the baseline and assess the economic impacts of the
proposed schemes (including additional surface access infrastructure) on the local area.
1.2 Aim of project
The purpose of our project is to provide the Commission with a ‘road map’ which links the available evidence in
relation to the local economic impacts of airport development to its Appraisal Framework1. Specifically, we aim
to:
Identify the local economic impacts of increases in airport capacity/use in general, not just the shortlisted
schemes, focusing primarily on the supply chain effects of airports, but also considering their impacts as
catalysts of wider economic impacts for airport users; and
Undertake a series of six case studies which examine these issues in specific local contexts:
–
–
Four of the case studies examine the historic evolution of the local economic impacts of Heathrow,
Gatwick, Manchester airports and the New York system as a whole;
Two more focused studies look at the impacts of airport expansion/use in the context of the origindestination market at Paris Charles de Gaulle and surface access links at Frankfurt.
The study seeks to understand the local economic impact of an airport’s operation across four areas outlined in
the Airports Commission’s Appraisal Framework:
Business & services: what type of businesses may be attracted to locate at or in the locality of an
airport?
Labour demand: what are the implications of an airport’s operation for local labour demand, and is
there sufficient supply to meet this demand?
Housing & social infrastructure demand: how is an individual’s decision on where to live impacted
by the presence of an airport, and what impact does this have on local housing and infrastructure?
Land required: what type of land is required for new commercial, residential and other development
and how easily can this land be identified and developed following airport expansion?
A key issue for our research has been to understand and assess how the ‘local’ area has been defined in previous
studies.
1.3 Approach
Our work has involved collating and exploring existing research (both theoretical and empirical) and case
studies (in the UK and internationally). Its scope is limited so that it builds on existing research and does not
duplicate that being undertaken as part of other modules. This means that:
It excludes impacts such as those covered in the national economy impacts module2, quality of life, sense
of place, landscape and environmental impacts;
Airports Commission, Appraisal Framework, April 2014 (see
https://www.gov.uk/government/uploads/system/uploads/attachment_data/file/300223/airports-commission-appraisalframework.pdf)
2 We recognise that there will be some overlap with the national economic impact, to the degree that local impacts
contribute to the national picture
1
Airports Commission
PwC 1
3. Local Economy: Literature Review
It does not involve modelling or secondary data analysis (beyond the literature review); and
It builds on the literature review by SDG on aviation and the economy3.
1.4 Key findings
The two tables below summarise our findings from a review of the literature available on the local economic
impact of airports. The focus of the review has been on the operation of airports rather than their construction
and/or expansion.
Our findings are structured in a way which is aligned with the Airports Commission’s proposed approach to
assessing the local impacts of an aiport option, as set out in its Appraisal Framework4. We start by considering
the impact on local businesses and services attracted to the local area and then consider the implications for
labour demand and how labour supply adjusts to meet this demand (see Table 1). We distinguigh between those
generated:
Through airport operation (the direct impacts);
Through supply chain spending and the spending of direct and supply chain employees (the indirect and
induced impacts); and
By the attraction, retention or expansion of economic activity resulting from the increased connectivity
facilitated by the airport (the catalytic impacts).
We then consider the impacts on demand for housing and social infrastructure arising directly and indirectly
from airport operation, and the land required for commercial, residential and infrastructure development (see
Table 2).
Table 1: Key findings from literature review in relation to business & services and labour
demand & supply
Questions to
analyse
Direct
impacts
Business & services attracted
Labour demand & supply
How has the nature of the local business
environment been affected by local airport
development?
What employment has been generated:
direct on- and off-site, indirect, induced and
catalytic?
What businesses have been attracted to/ deterred
from the local area?
Could the jobs be met by the local and wider
area? What was the remaining ‘net
additional labour demand’?
The majority of the direct business activity
generated at airports is seen through passenger or
freight airlines, although the sectoral breakdown of
impacts is more commonly expressed in
employment terms than business activity, and the
definition of relevant industry groups varies
between studies.
Our review of airport economic impact
studies suggests that just over half of direct
jobs created at airports are in airlines or
other aviation industry firms: other major
employment groups include government &
security (9-18%) and ground transportation
(6-15%)
In addition, in the case of both London Heathrow
and Manchester, nearly 90% of the total was direct
activity on the airport site
The average number of direct jobs generated
for each million passengers handled ranges
from under 500 to over 1,500
The scale of additional business activity generated
by expansion of airport capacity (measured in
terms of additional passengers handled) depends
on several factors including:
The share of air traffic movements which are
long-haul flights (rather than low cost
carriers)
How developed non-aviation activity is on the
In the UK and USA, transport industry jobs
are more skilled and more productive than
the national average whereas jobs in the
storage, trade and retail sectors tend on
average to be relatively lower skilled
The commuting patterns of direct employees
(airport workers) are relatively consistent
across those airports where information is
Steer Davies Gleave, ‘Aviation and the economy – Framework and Evidence’, 2014 (see
https://www.gov.uk/government/publications/airports-commission-interim-report)
4 Airports Commission (2014); Appraisal Framework;
https://www.gov.uk/government/uploads/system/uploads/attachment_data/file/300223/airports-commission-appraisalframework.pdf
3
Airports Commission
PwC 2
3. Local Economy: Literature Review
Business & services attracted
airport site
How much freight is handled
Indirect &
induced
impacts
Also, the scope of airport impact studies often
differs significantly which means comparisons
require careful interpretation
The economic impact studies reviewed use a broad
range of multipliers to estimate the local indirect
and induced impacts on value added of airport
operation: a multiplier of 1.45 was used for
Edinburgh Airport and one of 2.9 at Copenhagen
Airport
The size of the multiplier is partly influenced by
how broadly or narrowly the local area is defined:
multipliers tend to be larger when the impact is
being assessed at a regional level (e.g. North West
England in the context of Manchester Airport and
the Ile de France in the case of the Paris airports)
because the areas are more self-contained
The attractiveness of the locality of an airport as a
location for firms also affects the level of indirect
and, to a lesser extent, the induced business
activity
Labour demand & supply
available: over 75% live within a 30-minute
drive of the airport, and the majority travels
by car
This pattern of commuting provides some
indication of the geographic scale of the local
labour market
It is also relevant for considering the
effectiveness and efficiency with which
labour supply adjusts to changes in labour
demand as a result of airport development
The evidence on the share of national
indirect and induced employment impacts
which are felt locally and regionally is less
than that for the direct impacts
A key factor influencing the employment
multipliers is the size of the local area being
considered: all other things being equal,
multipliers will be larger in larger areas
because leakages from the ‘local’ economy
will tend to be smaller
Evidence from Sydney Airport suggests that
the nature of the local labour market will
need to adjust to accommodate the increase
in supply
Similar evidence is seen from the Joseph
Rowntree Foundation who highlight that
new unskilled workers have moved into local
communities, while the existing workers
have taken on higher skilled jobs
These adjustment mechanisms determine
how labour costs and pressure on social
infrastructure will change with labour
demand changes
They can only be fully assessed through
general equilibrium modelling.
Catalytic
impacts
The catalytic impacts are rarely quantified, and
often not discussed, within the literature around
the economic impact of individual airports
Investment
and
productivity
The existing literature highlights the positive
influence of (good) transport infrastructure on
firms’ investment location decisions
The impact on the labour market of airport
expansion depends on the nature of
industries which locate in the locality
For example, a survey of UK companies shows that
access to the air transport network is rated as vital
or very important by more than 40% of companies,
ahead of the cost of labour and business taxes
Similarly, the series of European Cities Monitors
prepared by Cushman & Wakefield indicate that
the most important factor influencing firms’ choice
of location is ‘Easy access to markets, customers or
clients’
The evidence is mixed: for example, Dallas/
Fort Worth International Airport has
attracted high-productivity industries, such
as computing, finance and insurance
whereas evidence from Memphis
International and Amsterdam Schiphol
airports suggests concentrations of low
productivity distribution and storage firms
These differences indicate how the local
economic geography and history affect the
labour market demand through changing
required skill mixes
The limited evidence available suggests that, in
addition to companies which directly support
aviation activity, occupiers of commercial space at
or close to airports are typically in the technology
and telecommunications (T&T) and manufacturing
sectors
Businesses in the financial services, tourism,
distribution and high-tech/ knowledge intensive
manufacturing sectors are often cited as amongst
those most influenced by connectivity: the list,
Airports Commission
PwC 3
3. Local Economy: Literature Review
Business & services attracted
however, varies significantly depending on the
local context
Tourism
This means that findings from airports outside the
London system do not readily transfer to London
because the local economic context is quite
different
The impact of tourism on local business and
services will predominantly be determined by the
definition of the ‘locality’ which is assumed. While
there may be limited benefit of close proximity to
the airport, beyond the direct and induced impacts,
there may be a more significant impact when the
nearest metropolitan area or region is considered5
Clustering &
agglomeration
economies
For a given number of passengers visiting the local
area, the value added by tourism varies greatly: the
shares of international and long-haul flights are
key factors which can increase the level of impact6
In the UK, tourism value-added is 40% of visitor
spending and average visitor spending is more
than twice as high for non-European visitors as it is
for European visitors (£1,027 vs £451)
In addition, £24.2bn of expenditure was generated
through outbound tourism from the UK. This is a
further source of value added, facilitated by the
airport7
The emergence of airport city models reflects a
belief that airports can drive the development of
(local) industry-specific concentrations of
economic activity. These are enabled by
improvements in connectivity and access to related
services. They, therefore, typically comprise a far
broader range of firms than just those directly in
the aviation industry
Research shows that firms’ motivation to locate
with logistics clusters proximate to airports is more
strongly motivated by the opportunities to realise
agglomeration benefits than a desire simply to be
near to the airport
The local context, including governments’
economic priorities (and incentives), strongly
influence the industries which cluster around
airports, with only aviation clusters consistently
present at all airports
Labour demand & supply
The value added by tourism is associated
with additional jobs in tourism intensive
sectors, notably accommodation and
transport
The proportion of these jobs which is local to
the airport depends on the travel patterns of
airport users in relation to their final
destinations: for example, some are closer to
the final visitor destination than others
Further jobs will also be created through
outbound tourism: the majority of these
(60%) are in the air transport industry (i.e.
direct or indirect jobs), with additional
employment in areas such as retail (25%)
and travel agencies (7%)
Outbound tourism could also reduce valueadded by facilitating the substitution of local
expenditure for expenditure in other regions
or abroad: local economic welfare may be
enhanced by changes in the opportunity for
travel
How far an increase in airport capacity will
lead to increased outbound travel depends
on levels of demand and price adjustments
in the air transport market: this is being
analysed through the DfT’s transport
modelling, which should be applied in this
module
There is very little evidence in the existing
literature regarding on the impact of
industry clustering around airports on the
level and nature of labour demand
A wide range of industry clusters (including,
transportation, telecommunications,
publishing and distribution) have developed
around airports, and these have very
different implications for productivity, skill
mix and employee numbers
See Hakfoort et al (2001)
This can be seen, for example, in comparing Deloitte (2013) and BERL (2008)
7 For more detail, please refer to the Tourism Satellite Account (ONS, 2013)
5
6
Airports Commission
PwC 4
3. Local Economy: Literature Review
Table 2: Key findings in relation to housing, social infrastructure and land
Questions to
analyse
Airport impact
Housing and social infrastructure
demand
Land required
How much of the ‘net additional labour
demand’ will add pressure to the local
housing market and associated services?
How much land is required for commercial
and residential development to meet
additional labour and housing demand?
How much housing demand could there be
from other sources, such as people wishing
to live close to the airport for connectivity
reasons?
Is the land available and could it plausibly be
developed?
To the extent that airport expansion
increases direct and indirect employment
in the local area, this will create pressure in
the local housing market
The evidence demonstrates that the amount
of land which is required in the locality of an
airport varies greatly according to the local
context
The extent of this pressure depends in part
on the scale of the local area
(geographically and in terms of the
economically active population)
For example, Dallas/ Fort Worth airport
covers 18,000 acres, or which 6,000 are for
non-aviation activity but the majority of
other airports are considerably smaller
Changes in commuting patterns are also an
important adjustment mechanism
Evidence from the Joseph Rowntree
Foundation in relation to Heathrow
suggests that proximity to employment
opportunities has affected the location
decision of many residents
How airport expansion affects local
housing markets is ambiguous: on the one
hand, it directly stimulates housing
demand as more airport workers are
needed, and indirectly, as improved
connectivity attract mobile firms and/or
enables existing firms to become more
competitive (thus boosting their demand
for labour). On the other hand, negative
externalities associated with airport
expansion (e.g. noise, congestion) can
make the area less attractive so reducing
housing demand
Baker et al (2012) suggest that the nature of
the land used by airports has changed with
their recent development, stating that ”large
international airports in Europe, North
America and Asia have varied functions
beyond airport traffic and operate as
metropolitan hubs with a diverse range of
land uses”
Similarly, CBRE research demonstrates how
the role of land used by the airport has
changed, showing that occupiers of office
space at airports are dominated by the
technology and telecommunications (T&T)
and manufacturing sectors
The result of this has been to increase land
rents on airports sites, to the extent that land
at Amsterdam Schiphol is now more
expensive than in the Amsterdam CBD. This
type of adjustment mechanism with regards
to an increase in demand will have a
significant impact on the nature and level of
land use in the vicinity of an airport
McMillen (2004), for example, finds that
the impact of ‘severe noise’ in reducing
demand lowers house prices by 9.2%. The
impact of additional airport capacity on
noise is considered in Module 5 of the
Appraisal Framework
Demand for housing is shown to be
increased by Lipscomb (2003) through the
improved connectivity brought by an
airport
Each impact has been considered at the ‘local’ level. In practice, the way in which the local area is defined varies
from study to study (and from location to location). An important aspect of the research, therefore, has been to
assess how the local area has been identified and what, if any, lessons can be learned.
Our review suggests that the nature of the ‘local’ impact varies by type of impact:
The extent of the direct local impacts is reflected in direct employees’ commuting patterns, which are
primarily within a 30-minute travel time: this suggests that travel to work areas (or similar labour market
measures) define the geographic scope of the main local impacts;
By definition, the supply chain (indirect) and knock-on employee spending (induced) effects will tend to
be more widely distributed spatially, recognising that some suppliers have less need for close physical
Airports Commission
PwC 5
3. Local Economy: Literature Review
proximity to the airport to be competitive: many studies have expanded their geographical scope to
consider metropolitan or regional areas, reflecting local economic geography (as well as the availability of
data); and
The extent of the local catalytic impacts, whether they be the influence on business location decisions, the
facilitation of growth in wider markets (especially internationally) or the pattern of tourism, is driven by
the way in which proximity to the airport makes a location attractive from a business and/or visitor
perspective: the evidence suggests that this is broader than the local labour market.
When assessing the potential impacts of runway expansion at either Heathrow or Gatwick Airport, our research
suggests that different definitions of the ‘local’ area will be needed to capture the different types of impact (see
Table 3).
Table 3: Basis for defining and assessing local areas
Impact type
Direct
Indirect
Induced
Basis for defining local areas
Defined by local labour market (e.g. the travel to work area (TTWA)) in which the majority of
‘on-airport’ (and ‘off-airport’) employees reside
In the case of Gatwick Airport this is the Crawley TTWA (as defined by ONS) and, in the case
of Heathrow Airport, four TTWAs are relevant (London, Reading & Bracknell, Guilford &
Aldershot and Wycombe & Slough)
Depends on how widely/narrowly the scope of the airport is drawn
In the case of both Heathrow and Gatwick Airports, the multiplier used in any assessment
needs to reflect the airports’ footprints across large parts of London and the South East
Arguably, less meaningful to define local area
Will be closely linked to the definition of the local area for the purposes of direct and indirect
impacts
Influenced by workplace location of airport users
In the case of Heathrow and Gatwick, this is likely to cover a broader region across London
and the South East
Influenced by destination of in-bound visitors relative to the airport
Depends on which markets are served by the airport and the extent of competition from other
airports (and, to a lesser extent, other modes of transport available)
Catalytic
Business location
Tourism
Airports Commission
PwC 6
3. Local Economy: Literature Review
2 Introduction
2.1 Background
PricewaterhouseCoopers (PwC) was commissioned by the Airports Commission to undertake research designed
to provide the Commission with a better understanding of the impacts of airports and airport expansions on
local economies. Our research is intended to inform the Commissioners’ final decision on the preferred longterm expansion option by feeding into further work to set the baseline and assess the economic impacts of the
proposed schemes (including additional surface access infrastructure) on the local area.
2.2 Aim of project
The purpose of our project is to develop the evidence base on the local economic impacts of airport expansion,
both immediately at and around airports, and more widely (whilst remaining local to the airport). It provides
the Commission with a ‘road map’ which links the available evidence in relation to the local economic impacts
of airport development to its Appraisal Framework8. Specifically, the aims are to:
Identify the local economic impacts of increases in airport capacity/use in general, not just for the
shortlisted schemes, focusing primarily on the supply chain effects of airports, but also considering their
impacts as catalysts of wider economic impacts for airport users; and
Undertake a series of six case studies which examine these issues in specific local contexts:
–
–
Four of the case studies examine the historic evolution of the local economic impacts of Heathrow,
Gatwick, Manchester airports and the New York system as a whole;
Two more focused studies look at the impacts of airport expansion/use in the context of the origindestination market at Paris Charles de Gaulle and surface access links at Frankfurt.
Our research and analysis has focused on the evidence relating to the key questions in the Airports
Commission’s Appraisal Framework:
What types of business and services are likely to be attracted/deterred from locating at/around an airport
and more widely (but still locally)?
What scale and type of employment does an airport generate directly and indirectly, how productive is it
and where is the labour drawn from?
What factors influence individuals’ decisions on where to live in the local and wider area of an airport,
and what type and supply of housing is clustered around airports?
What type of land is required for new commercial, residential and other development, and how easily can
this land be identified and developed following airport expansion?
To what extent are businesses/employment/housing displaced from other areas or additional?
Following the development of airports, how do local areas mitigate the additional pressures placed on
services?
A key issue for our research has been to understand and assess how the ‘local’ area has been defined in previous
studies.
2.3 Approach
Our work has involved collating and examining existing research (both theoretical and empirical) and case
studies (in the UK and internationally).
Airports Commission, Appraisal Framework, April 2014 (see
https://www.gov.uk/government/uploads/system/uploads/attachment_data/file/300223/airports-commission-appraisalframework.pdf)
8
Airports Commission
PwC 7
3. Local Economy: Literature Review
The scope of our research is limited in that it builds on existing research and does not duplicate that being
undertaken as part of other modules. This means that:
It excludes impacts such as those covered in the national economy impacts module9, quality of life, sense
of place, landscape and environmental impacts;
It does not involve modelling or secondary data analysis (beyond the literature review): we envisage that
this will be undertaken as part of the local economic impact assessment; and
It builds on the literature review by SDG on aviation and the economy10.
2.4 Report structure
Our report summarises the evidence we have been able to collect in relation to the four themes in the Airports
Commission's Appraisal Framework:
Section 3 explores the types of business and services attracted to (and deterred from) locating at or
around an airport and more widely (but still locally);
Section 4 examines the scale and type of employment generated directly and indirectly, how productive
this employment is and where the labour supply is drawn from, including the factors that influence
individuals’ decisions on where to live in relation to the airport;
Section 5 considers the available evidence on how airport construction and expansion affects demand
for housing and social infrastructure; and
Section 6 examines the influence of land availability.
A series of Appendices provide details of each of the six case studies as well as a list of the existing studies which
have been reviewed.
We recognise that there will be some overlap with the national economic impact, to the degree that local impacts
contribute to the national picture
10 Steer Davies Gleave, ‘Aviation and the economy – Framework and Evidence’, 2014 (see
https://www.gov.uk/government/publications/airports-commission-interim-report)
9
Airports Commission
PwC 8
3. Local Economy: Literature Review
3 Business and services
In this section we summarise the impact of an airport, or airport expansion, on those businesses and services
which locate at or around an airport. We consider those directly involved in airport operations, those involved
in the airport’s supply chain, those dependent on the spending of employees at the airport and its supply chain,
and those more widely affected by the air transport services provided through the airport. For this latter group
of impacts, we focus on three key questions:
What differences, if any, are there in the types of businesses attracted to locate near different types of
airports?
What value of output do these businesses generate?
What factors attract/ deter a business to locate near an airport?
We also consider briefly London’s industrial structure, the role of clusters and how it has evolved.
Our key findings are summarised in Box 1.
Box 1: Business and services – key findings
Our analysis of business and services has focused on two questions:
How has the nature of the local business environment been affected by local airport development?
What businesses have been attracted to/ deterred from the local area?
Direct impacts
Our key findings in relation to the direct impacts are that:
The majority of the direct business activity generated at airports is seen through passenger or freight airlines, although
the sectoral breakdown of impacts is more commonly expressed in employment terms than business activity, and the
definition of relevant industry groups varies between studies
In addition, in the case of both London Heathrow and Manchester, nearly 90% of the total was direct activities on the
airport site
The scale of additional business activity generated by expansion of airport capacity (measured in terms of additional
passengers handled) depends on several factors including the share of air traffic movements which are long-haul flights
(rather than low cost carriers), how developed non-aviation activity is on the airport site and how much freight is
handled
Also, the scope of airport impact studies often differs significantly which means comparisons require careful
interpretation
Indirect & induced impacts
Our key findings in relation to the indirect and induced impacts are that:
Most of the impact studies rely on either input-output analysis and/or surveys of airport supply chains to determine the
indirect and induced impacts
The economic impact studies reviewed use a broad range of multipliers to estimate the local indirect and induced
impacts on value added of airport operation: a multiplier of 1.45 was used for Edinburgh Airport and one of 2.9 at
Copenhagen Airport
The size of the multiplier is partly influenced by how broadly or narrowly the local area is defined: multipliers tend to be
larger when the impact is being assessed at regional level (e.g. North-West England in the context of Manchester Airport
and the Ile de France in the case of the Paris airports)
How attractive the locality of an airport is as a location for firms also affects the level of indirect and, to a lesser extent,
of induced business activity
There is evidence that differences in findings are partly driven by measurement issues: for example, local indirect and
induced impacts often depend on estimating regional input-output tables (from national models) but different
approaches lead to differences in the multipliers
Catalytic impacts
The catalytic impacts are rarely quantified, and often not discussed, within the literature concerned with the economic
impact of individual airports. Our key findings are summarised below:
Investment and productivity
There is an extensive literature on the role of connectivity and market access on investment and location decisions: this
Airports Commission
PwC 9
3. Local Economy: Literature Review
highlights the positive influence of good transport infrastructure on firms’ investment location decisions
For example, a survey of UK companies shows that access to the air transport network is rated as vital or very important
by more than 40% of companies, ahead of the cost of labour and business taxes11
Similarly, the series of European Cities Monitors prepared by Cushman & Wakefield indicate that the most important
factor influencing firms’ choice of location is ‘Easy access to markets, customers or clients’
The limited evidence available suggests that, in addition to companies which directly support aviation activity, occupiers
of commercial space at or close to airports are typically in the technology and telecommunications (T&T) and
manufacturing sectors
Businesses in the financial services, tourism, distribution and high-tech/ knowledge intensive manufacturing sectors are
often cited as amongst those most influenced by connectivity: the list, however, varies significantly depending on the
local context
This means that findings from airports outside the London system do not readily transfer to London because the local
economic context is different
Tourism
The impact of tourism on local business and services will predominantly be determined by the definition of the ‘locality’
which is assumed. While there may be limited benefit in close proximity to the airport, beyond the direct and induced
impacts, there may be more significant impact when the nearest metropolitan area or region are considered12
For a given number of passengers visiting the local area, the value added by tourism varies greatly: the share of
international and long-haul flights are key factors which can affect the level of impact13
In the UK, tourism value-added is 40% of visitor spending and average visitor spending is more than twice as high for
non-European visitors as it is for European visitors (£1,027 vs £451)
In addition, £24.2bn of expenditure was generated through outbound tourism from the UK, which is a further source of
value added facilitated by the airport (ONS, 2013)
Clustering & agglomeration economies
Some studies also refer to the agglomeration benefits which they claim are reflected in the composition of firms which
cluster around an airport, but the evidence is typically qualitative
The emergence of the aerotropolis (Kasarda, 2008) and airport city models reflects a belief that airports can drive the
development of (local) industry-specific concentrations of economic activity. These are enabled by improvements in
connectivity and access to related services. They, therefore, typically comprise a far broader range of firms than just
those directly in the aviation industry
Research by Warffenmuis (2010) shows that firms’ motivation to locate within logistics clusters proximate to airports is
more strongly motivated by the opportunities to realise agglomeration benefits than a desire simply to be near to the
airport
Recent analysis has suggested that the clustering benefits may be limited once proximity to transport hubs is controlled
for (Overman et al, 2012)
In addition, the existing literature suggests that the composition of firms which cluster around an airport depends on
the local context which limits how far the findings and experiences from one airport can be translated to another
Table 4 highlights some of the key studies we refer to in this section besides those reviewed as part of the case
studies: a full list of studies used is provided in Appendix G.
Table 4: Summary of key sources used
No.
Title
Authors
Year
Airport covered
1
Economic and social analysis of potential
airport sites
Ernst & Young
2012
Sydney
2
Economic Effects of Airports in Central Europe:
A Critical Review of Empirical Studies and
Their Methodological Assumptions
Zak & Getzner
2014
Central Europe
3
Minneapolis-St. Paul International Airport
InterVISTAS
2012
Minneapolis-St. Paul
Cited in Oxford Economic Forecasting (2006), The Economic Contribution of the Aviation Industry in the UK,
http://www.gacag.org/images/gacag/pdf/The%20Economic%20Contribution%20of%20the%20Aviation%20Industry%20i
n%20the%20UK.pdf.
12 See Hakfoort et al (2001)
13 This can be seen, for example, in comparing Deloitte (2013) and BERL (2008)
11
Airports Commission
PwC 10
3. Local Economy: Literature Review
No.
Title
Authors
Year
Airport covered
4
The Regional Economic Impact of an Airport:
The Case of Amsterdam Schiphol Airport
Hakfoort et al
2001
Amsterdam
5
The Economic Catalytic effects of Air Transport
in Europe
Britton, Cooper &
Tinsley
2005
EU
3.1 Types of business and services associated with airport
operation
Potentially, an airport has a wide range of impacts on the local economy which can be categorised into four
groups:
Direct – those generated through airport operation;
Indirect – those generated through activity in the upstream airport supply chain;
Induced – those generated through employee spending (whether employed directly or in the supply
chain); and
Catalytic – spillover demand and supply side effects from airport operation.
A summary of how each of these effects is generated is set out in Figure 1 which is adapted from Britton et al.
(2005).
Employ staff
Aviation
company
revenues
Pay taxes
Buy goods &
services
Airport
activities
Direct
impacts
Environmental
& social impacts
Catalytic
impacts
Economic
catalytic impacts
Spending by
employees
Induced
impacts
Indirect
impacts
Business
investment
Productivity
improvements
Clustering/
agglomeration
benefits
Increased tourism
Figure 1: Local direct, indirect, induced & catalytic impacts of airports
Source: Adapted from Britton et al. (2006)
We examine each of the areas highlighted in terms of the business and services associated with each type of
impact by reviewing the available evidence on the magnitude and drivers of the impact. We also consider the
data required and the different methodologies used so that we can assess the implications of data availability
and the choice of methodology for the robustness of the impact estimates.
3.2 Direct economic impacts
The first category of impact we examine is the direct economic impact. This is typically defined as the value
added by (or the employment associated with) the activities directly related to the operation of the airport.
These activities will typically be undertaken on the airport or in the immediately surrounding area because this
is essential to providing the air transport services required by passengers.
Airports Commission
PwC 11
3. Local Economy: Literature Review
Table 5 summarises the findings from a range of previous studies which have been selected because they have a
comparable scope and clearly-stated methodology which can be assessed. A key driver of the direct economic
impact of an airport is the level of airport activity (as measured by the number of passengers handled). The
biggest total impact is at Heathrow and Sydney although there is a large variation in the value generated per
passenger, ranging from £22 in Manchester to over £170 at Paris. Figure 2 shows, for a selection of studies, that
this variation is in part driven by differing employment densities ranging from low density (300-600 FTEs per
million passengers) to very high (1,200+ FTEs per million passengers)14. Adjusting for differences in years and
currencies, there is a positive correlation between the density of employment and the value generated per head.
As wages and salaries make up the majority of GVA, 61% in the UK (Optimal Economics, 2011), hiring
additional FTEs will tend to feed through to value added. Some of the difference between airports could also be
linked to methodological differences in how employees not directly employed by the airport are counted.
Differences in the approach to this could change the estimated workforce without impacting on value-added,
thus altering productivity estimates.
Table 5: Summary of direct economic impacts of airports15
Airport
Study (date)
Passengers
(million)
Direct impact
(value added)
FTEs
Value added
per
passenger
Value
added per
FTE
Europe
London Heathrow
Optimal Economics
(2011)
70.0
£3.6bn
76,700
£51.40
£46,900
London Gatwick
BHC (2011)
34.2
n/a
24,900
n/a
n/a
Frankfurt am
Main
INFRAS (2013)
58.0
£5.52bn
78,000
£95.16
£70,810
JF Kennedy, New
York
New York State
(2010)
61.5
£3.79bn16
69,945
£61.70
£54,185
Paris Charles de
Gaulle
BIPE (2012)
62
£11.00bn
115,400
£177.42
£95,321
LaGuardia, New
York
New York State
(2010)
33.5
£1.36bn
55,100
£40.67
£24,726
Manchester
York Aviation
(2008)
21.2
£477m
19,300
£22.50
£24,715
Vienna
WIFO (2007)
19.0
£963m
16,031
£50.70
£60,000
London Stansted
Oxford Economics
(2013)
17.4
£556m
10,231
£32.00
£53,900
Cologne/ Bonn
ARC et al. (2008)
9.3
£656m
12,460
£70.50
£52,600
Budapest
Dusek et al. (2010)
8.1
£196m
6,822
£24.10
£28,700
Frankfurt-Hahn
Heuer and
Klophaus (2007)
3.1
£91m
2,431
£29.40
£37,400
Sydney
Deloitte (2013)
36
£2.9bn
28,030
£80.30
£103,200
Minneapolis- St.
Paul
InterVISTAS (2013)
33.2
£1.2bn
17,500
£36.10
£68,000
Vancouver
Vancouver Airport
16.8
£1.0bn
21,633
£60.70
£47,200
Other
See York Aviation (2004).
Where relevant, exchange rate adjustments to pound sterling have been made based on the average exchange rate in the
year of publication. To ensure consistency with original analysis, figures are not adjusted for inflation.
16 The direct impact in terms of value added is not available, only wages paid to employees.
14
15
Airports Commission
PwC 12
3. Local Economy: Literature Review
Airport
Study (date)
Passengers
(million)
Direct impact
(value added)
FTEs
Value added
per
passenger
Value
added per
FTE
Authority (2011)
John Wayne
InterVISTAS (2014)
8.9
£300m
5,400
£33.70
£55,600
Wellington
BERL (2008)
5.0
£115m
2,775
£22.80
£41,300
Source: Compiled by PwC based on previous studies
Figure 2: Direct economic impact per passenger by density of employment
Direct economic impact per passenger
£100
Low density
Medium
density
£90
£80
High density
Very high
density
Sydney (Kingsford-Smith)
£70
Cologne/ Bonn
Vancouver International
£60
Vienna International
£50
London Heathrow
£40
John Wayne
Minneapolis - St.Paul
£30
London Stansted
£20
Wellington International
Budapest Ferenc Liszt
£10
£0
0
300
600
900
1,200
1,500
Passengers per FTE
Source: Compiled by PwC based on previous studies
A report by York Aviation (2004) suggests that airports which predominantly service short-haul ‘no frills’ flights
typically have lower than average employment densities, due to cost pressures and higher productivity. Our
survey of the evidence broadly supports this, with hub airports where more than 20% of passengers are longhaul having the highest employment densities.
Figure 3: Employment density by share of long-haul flights
Airports Commission
PwC 13
3. Local Economy: Literature Review
1,200
1,000
800
Budapest
Cologne/ Bonn
Frankfurt-Hahn
John Wayne
London Stansted
Wellington International
London Heathrow
Sydney (Kingsford Smith)
Vancouver International
Minneapolis-St.Paul
Vienna International
600
400
200
0
No long-haul flights
1 - 20% of flights long-haul
21%+ of flights long-haul
Source: Compiled by PwC based on previous studies, flight data from airport websites
Another factor which impacts total employment, besides employment density, is the volume (and value) of
freight handled. For example, Cologne-Bonn Airport has the highest employment density. It handles three
times as much freight per passenger as Heathrow and freight transport contributes 39% of its direct on-site
employment. At London Heathrow, Amsterdam Schiphol and Miami International, retail and catering are
estimated to account for more than 10% of the direct impact. These examples highlight the impact which
different airport business models can have on employment and value-added and, therefore, the importance of
studies considering the entirety of the business model in their analysis.
Figure 4 summarises the share of employees working in different sectors, at three major airports. In each
example the share of jobs relating to airlines, or aviation industry firms (such as aircraft maintenance), is
between 54% and 56%. The split between the other sectors is more varied, although this may be partly due to
different approaches to counting employees. For example, in San Francisco, only private sector employees are
included, with the result that the share of employees relating to government and security is far lower. Similarly,
the largest categories in the ‘other’ category in Miami are cleaning services and consulting & construction.
These sectors are not discussed in relation to either of the other two airports. One possible explanation for this
is that these services are sub-contracted and, therefore, employees performing such tasks are not direct
employees of the airport or its tenants. This would not change the total impact of the airport, but would change
the estimated direct employment impact. As well as demonstrating the largest areas of employment likely to be
generated within an airport, this example highlights the need to understand airport-specific business models
and assumptions when interpreting findings.
Figure 4: % of employment by sector at Miami, Ottawa and San Francisco airports
Airports Commission
PwC 14
3. Local Economy: Literature Review
100%
3%
9%
6%
16%
90%
18%
80%
15%
70%
8%
3%
4%
60%
15%
6%
5%
10%
17%
55%
56%
50%
40%
30%
54%
20%
10%
0%
Miami International
Ottawa
San Francisco
Airlines/ aviation industry firms
Ground transportation (exc. Car rental)
Car rental
Retail & catering
Government & security
Other
N.B. The San Francisco data relate only to private sector employees
Source: PwC analysis, Miami-Dade Aviation Department (2009), Leigh Fisher (2011), EDRG (2013)
Box 2: Types of direct business employment – case study evidence
The evidence collected as part of our case studies is broadly consistent with the picture at Miami, Ottawa and San Francisco
although some care is needed in interpreting them because the methodologies and definitions may not be consistent:
At London Heathrow airport, 62% of direct on-site employment was in the airline sector (and 900 out of 7,700 off site
jobs were also in the airline sector);
The study of the New York system used a different structure which makes any comparison problematic; and
At Frankfurt am Main airport, the airline sector accounted for 61% of direct employment.
Source: PwC case studies
Methodological issues
In addition to the factors discussed above, methodological differences will further broaden the range of
estimates. For example, studies apply different definitions of the geographic and sectorial ‘scope’ of the airport
and aviation activity. This is particularly the case with ‘airport city’ type developments where the limit of activity
which is directly linked to the running of the airport is not clear. Similarly, studies apply different approaches to
turning headcount numbers into FTEs (e.g. estimating total hours worked, or applying a full of thumb such as a
part time worker equates to 0.5 FTEs). These issues mean that the results for one study cannot be directly
compared with those from another, as any differences in the results may be driven by methodological
differences rather than fundamental differences in the level of airport impact.
3.3 Indirect and induced impacts
The indirect economic impacts of an airport on the local economy are those generated by the activities in the
upstream airport supply chain (i.e. those businesses providing goods and services to the airport) and the
induced economic impacts are those generated through the spending of those employed either directly by the
airport or in its supply chain.
The level of indirect and induced impact is often estimated using (local) multipliers which measure the ratio of
direct to indirect and induced impacts (on employment and/or value added). Table 3 summarises a sample of
these multipliers from previous studies. There is a reasonably broad variation in the estimated multipliers, from
1.45 in Edinburgh to 2.9 in Copenhagen. It can also be seen that the size or type of the airport has little bearing
on the multiplier, with no noticeable correlation between the size of the multiplier and the number of airport
passengers. What is more relevant is the variation in how the different studies define their local region of
interest. This is likely to have a significant impact on the multiplier.
Airports Commission
PwC 15
3. Local Economy: Literature Review
Table 6: Local indirect and induced multiplier estimates
Airport(s)
Year of
study
Local area studied
Passengers
(2013)
Regional
population
(m)
Indirect &
induced
multiplier
Amsterdam Schiphol
2001
Greater Amsterdam
52.6m
1.6
1.95
Atlanta
2009
Atlanta Metropolitan
Area
94.4m
5.5
1.77
Cologne-Bonn
2008
Cologne-Bonn Region
9.1m
2.8
1.77
Colorado system
2013
Colorado State
52.6m
5.3
1.76
Copenhagen
1991
Copenhagen Region
24.1m
1.7
2.90
Edinburgh
2009
Edinburgh City
Region
9.8m
0.5
1.45
Manchester
2008
North West England
20.7m
7.1
2.50
Minneapolis-St. Paul
2012
Minneapolis-St. Paul
Region
33.9m
3.4
1.81
Paris (Orly & Charles
de Gaulle)
2013
Ile-de-France
90.6m
12.0
2.30
Source: Compiled by PwC based on previous studies, population data taken from national statistical authorities
The size of the region used to assess the ‘local’ impact will affect the magnitude of the multiplier as any supply
chain spending outside the region studied is a leakage from the system which reduces the multiplier (all other
things being equal). This means that studies with a broader definition of ‘local’ will tend to have larger indirect
and induced impacts. Figure 5 shows a weak relationship between the population in the ‘local’ area studied and
the scale of the multiplier.
Figure 5: Local induced and indirect output multipliers by population of region studied
Indiret & induced multiplier
Increasing regional population
3.5
2.90
3
2.50
2.5
1.95
2
1.5
1.77
1.81
1.76
2.30
1.77
1.45
1
0.5
0
Source: Compiled by PwC based on previous studies and population data taken from national statistical authorities
The transaction costs associated with cross-border trade mean that firms are more likely to purchase from
domestic suppliers than to import. As a result, more supply chain spending may be expected to leak between
regions domestically than internationally. As a result, local areas which make up more of a national economy
will tend to experience less domestic leakage and the indirect and induced multipliers will consequently be
higher. This relationship is shown in Figure 6. This re-emphasises the importance of the region of study chosen
in determining the multiplier estimates.
Airports Commission
PwC 16
3. Local Economy: Literature Review
Indirrect & induced multiplier
Figure 6: Local indirect and induced output multipliers
Increasing share of national population
3.5
2.90
3
2.50
2.5
1.81
2
1.5
1.76
1.77
1.77
2.30
1.95
1.45
1
0.5
0
Source: Compiled by PwC based on previous studies, population data taken from national statistical authorities
Methodological issues - multiplier estimates
As described above, the geographic scope of any input-output table has a significant bearing on the multipliers
which can be estimated from them. Most tables are at the national level although sub-national tables are
sometimes derived or estimated. In these latter cases, while a more detailed table may appear to provide a more
reliable estimate of the local impacts, the difficulties accessing accurate information at the local level means
that the results need to be interpreted with care. Where this is attempted it is important to understand the
source of the information and the assumptions which were made in generating the result.
Local (or regional) input-output tables are typically not produced by national statistics authorities and,
therefore, need to be estimated. Rickman and Schwer (1995) tested the IMPLAN, REMI and RIMS II models,
three examples from the USA, and found significant differences in the multipliers. These models are commonly
used in some of the North American studies which have been analysed. According to the Transportation
Research Board (2007), the differences were driven, by the ‘techniques used to regionalise national inputoutput co-efficients’. Similarly, the 2010 study for John Wayne Airport found that using the IMPLAN increased
the multiplier estimate for construction spending from $2.01 to $2.20 compared to the RIMS II model.
These examples highlight the importance of understanding the models used to estimate the indirect and
induced impacts. They also demonstrate how the findings from one study cannot be compared directly with
those of another without an appreciation of the input data and modelling techniques used (and the confidence
intervals around the results).
3.4 Catalytic impacts of airports
In this part of the section we examine the catalytic impacts of airports on business and services in the local area.
We consider the following impacts:
The role of the airport in business location decisions;
The impact of the airport on the productivity of the airports’ business users;
The role of the airport in facilitating tourism; and
The potential for the airport to lead to the development of local clusters.
Our analysis builds on the work completed by SDG (2013), which looked at the wider impacts of aviation and
connectivity on the national economy, but focuses on the specific factors which alter the local dimension of the
impact, and the approaches taken to measure those impacts.
Airports Commission
PwC 17
3. Local Economy: Literature Review
Influence of connectivity on business location decisions
Table 7 highlights the importance of transport networks to occupiers of industrial, retail and office space.
Cushman & Wakefield’s European Cities Monitor (2011)17 examines the key factors that businesses consider
when assessing new locations. For the third year running, the most important factor influencing the choice of
business location was ‘Easy access to markets, customers or clients’ with 61% of respondents stating that this is
absolutely essential. ‘Transport links with other cities and internationally’ were viewed as absolutely essential
by 42% of respondents. Whilst this factor retains its position in fourth place, it slipped back in respondents’
perception of importance.
Oxford Economics reinforce this view by stating that although air services are only one component in the
assessment that companies make in choosing where to be based or to locate new investment, a wide range of
studies confirm that they are one of the most important considerations. Oxford Economics’ survey of UK
companies18 highlights that the air transport network is rated as vital or very important by more than 40% of
companies, marginally ahead of the cost of labour and business taxes.
Table 7: Key factors influencing business location decisions (2011)
Factor
% of businesses regarding
factor as essential for locating a
business
Easy access to markets, customers or clients
61
Availability of qualified staff
58
The quality of telecommunications
55
Transport links with other cities and internationally
51
Value for money of office space
36
Cost of staff
33
Availability of office space
31
Languages spoken
27
Ease of travelling around within the city
26
The climate governments create for business through tax policies or financial
incentives
27
The quality of life for employees
20
Freedom from pollution
19
Source: Cushman & Wakefield (2011)
Impact on productivity of local firms
A second potentially positive catalytic impact of connectivity offered by an airport is the benefit to firms’
productivity. This primarily occurs through two channels:
Increasing the access of UK firms to international markets; and
Facilitating the freer movement of workers and capital across borders.
This analysis has typically been undertaken at a national level:
Cushman & Wakefield (2011), European Cities Monitor. http://www.cushmanwakefield.co.uk/en-gb/research-andinsight/2012/european-cities-monitor-2011/.
18 Cited in Oxford Economic Forecasting (2006), The Economic Contribution of the Aviation Industry in the UK,
http://www.gacag.org/images/gacag/pdf/The%20Economic%20Contribution%20of%20the%20Aviation%20Industry%20i
n%20the%20UK.pdf.
17
Airports Commission
PwC 18
3. Local Economy: Literature Review
Oxford Economics (2006) found that a 10% increase in aviation connectivity (all other things being
equal) increased GDP by 0.6%; and
IATA (2006) found that a 10% increase in connectivity raised long-term productivity by 0.9%.
These findings relate to the national level. It is also important to understand the local impact. The analysis of
the local economic impacts of airport capacity on business productivity is severely limited by the absence of
robust data on sub-national trade flows within the UK. Overman et al (2009), however, have shown that
proximity to an airport had a beneficial impact on firm productivity.
Impact on tourism
Inbound tourism
An additional catalytic impact of airports considered by several studies is their role in generating value added
locally by facilitating inbound tourism. The scale of this impact depends on the number of additional inbound
visitors to the local area arriving through the airport and how much they spend in the locality. Table 8 shows
that spend per head varies greatly by airport and type of passenger. The Canberra and Sydney studies show that
international passengers spend considerably more per head than domestic visitors. This is also shown through
the increased spend per head at airports such as Miami and Wellington, which service more international
flights, relative to airports with a more domestic and regional focus such as Edinburgh, Budapest and
Sacramento. There is less consistent evidence on the relative spending of business and leisure visitors: evidence
from Sydney suggests a 15-20% premium for leisure passengers, while data from Budapest suggest the opposite.
The specific nature and local context of flight patterns, for example the relative shares of charter and scheduled
flights, ensures that the direction of this relationship is not consistent across all examples.
Table 8: Spend by visitors arriving at international airports19
Airport (year)
Visitor profile
Region
Canberra (2011)
Day visitors
Canberra & surrounding region
Sydney (2013)
Spend per visitor (£)
£99
Domestic overnight
£266
International
£954
Domestic business
Western Sydney
£275
Domestic leisure
£342
International business
£848
International leisure
£982
Denver (2013)
Commercial
Colorado
Miami (2009)
All
Miami Metropolitan Area
Budapest (2011)
Holiday/ sightseeing
Hungary
Business trip
£481
£1,007
£354
£426
Sacramento (2011)
All
Sacramento Area
£397
Wellington (2008)
All
Wellington Region
£640
Edinburgh (2009)
All
Scotland
£351
Source: PwC analysis, based on publically available reports (see bibliography)
In addition to greater spend by international passengers, as demonstrated in Table 8, Figure 7 shows that
visitors to the UK who have travelled longer distances from their country of residence also tend to spend more
(in part because they tend to stay longer). Of the 18 countries which were the origin of the most visitors to the
UK in 2012, the 12 European countries in the list are at the bottom when ranked by spend per head. Average
Where relevant, exchange rate adjustments to pound sterling have been made based on the average exchange rate in the
year of publication. Figures are adjusted to be in constant 2013 prices based on relevant national exchange rates.
19
Airports Commission
PwC 19
3. Local Economy: Literature Review
spend by European visitors from the countries in this list is less than half that of non-European visitors (£1,027
per visitor compared to £451).
Box 3: The contribution of New York’s airports to inbound tourism
Our case study of New York’s airport system includes some indication of the economic impacts of those tourists visiting
New York and arriving through one its three main airports. It shows that:
Domestic visitors add more to the local economy than international visitors at all airports;
LaGuardia contributes more from domestic passengers than JF Kennedy and Newark, despite only providing 15% of the
operational impacts; and
JF Kennedy is significantly ahead when it comes to international tourism.
Overall, tourism at the three airports is estimated to have made an important economic impact creating over 190,000 jobs
between 2000 and 2004 and supporting $6.6 billion and $17.6 billion in wages and sales respectively across the same
period.
Figure 7: Average spending per visit by visitors arriving by air to the UK by country of residence
(2012)
£2,000
Average spend per visit
£1,800
£1,600
£1,400
£1,200
£1,000
£800
£600
£400
£200
£0
Source: Visit Britain (2014)
In estimating the local economic impact of an airport, it is important to recognise that total visitor spending
does not measure either the direct or the indirect and induced effects on value-added which arise from this
spending. This is because some of the output generated within the local economy will be spent on purchasing
goods and services.
The Office for National Statistics (ONS) satellite tourism accounts show that in 2011 direct GVA generated
through tourism in the UK was £53bn (ONS, 2013), which is over 40% of the total internal tourism expenditure
of £125bn. Less than £21bn of this expenditure was generated by inbound tourists (rather than UK residents). A
significant proportion of this spending (14%) is on air passenger transport services. Such spending will lead to
impacts which are captured as either direct or indirect effects. Only a few studies have sought to assess the local
impact of inbound visitors at individual airports because it requires detailed visitor spending data across
industries.
Recognising outbound tourism
A further impact of tourism, which has often not been considered by existing studies of local economic impact,
is the role of airports in facilitating outbound tourism. ONS data show that in 2012 the UK ran a tourism deficit
of £13.8bn because UK residents spent more when visiting countries abroad than visitors to the UK spent in the
Airports Commission
PwC 20
3. Local Economy: Literature Review
UK. If expenditure overseas would otherwise be spent in the local region of the airport, were it not for the
increased availability of outbound flights, then this leakage would have a negative impact on the airport’s local
impact.
On the other hand, the satellite tourism accounts show that UK residents making overseas visits spent £24.2bn
within the UK in 2011 (in addition to the amount they spent whilst in the UK) (see Figure 8). This was
predominantly focused on air passenger transport services, demonstrating the role of air transport in
generating this output (relative to other modes of transport).
Finally, although outbound tourism potentially has a negative effect on value added in the UK, its welfare effect
may be positive if the outbound tourism facilitated by the airport improves individuals’ economic welfare by
increasing consumer surplus, relative to a constraint on the level of outbound tourism.
In conclusion, the effects of additional runway capacity need to be assessed on both inbound and outbound
travellers.
Figure 8: Spending within the UK by residents making overseas visits by industry (2011)
£bn
£4bn
£8bn
£12bn
£16bn
Air passenger transport services
Other consumption products
Travel agencies & reservation services
Road passenger transport services
Food & beverage serving services
Accommodation services for visitors
Railway passenger transport services
Water passenger transport services
Transport equipment rental services
Cultural activities
Sport & recreation activities
Exhibitions & Conferences etc.
Source: ONS (2013)
Methodological issues - estimating the local impact of tourism
As discussed above, a key challenge with estimating the local value-added (or employment) generated through
tourism enabled by airport expansion is the need for detailed data on visitors’ expenditure with and without
additional capacity. Within this, a reliable breakdown by industry is needed to estimate the value-added
component of the expenditure, while location -specific data are needed to estimate the share of the impact
which is local to the airport. While these data can be collected through surveys, this cannot necessarily be done
consistently across airports and, therefore, a degree of variation in the results would be expected.
In addition, impact studies need to recognise the marginal impact of an increase in airport capacity on the
quantity of tourism. Apportioning all value-added generated by passenger spending to an airport inherently
assumes that none of this activity would have otherwise occurred. It is likely that a share of this activity would
be substituted either to another airport or another form of transport, which could lead to a positive impact in
the local region, even in the absence of the airport.
A final important area to consider is the locality of the tourism impact. ONS data show that more than half of
overseas visitors to the UK visit London. As a result, if London & the South East were defined as local areas for
the airport, then a large share of the national benefit would be felt in the local economy. However, this would be
expected to greatly decrease if a much narrower definition of ‘local’ were to be taken, such as the local authority
Airports Commission
PwC 21
3. Local Economy: Literature Review
area immediately adjacent to the airport. This further highlights the importance of the ‘local’ definition on the
findings, and the relative magnitude of the different elements of impact.
Similar considerations are needed when assessing the local impacts of outbound tourism. It is possible that the
increased presence of transport and tourism firms in the locality of an airport means that outbound tourism has
a net positive impact at this level. This would occur if the value-added generated through the outbound tourism
industry were greater than the value-added substituted away from local spending to spending abroad.
Impact on clustering & agglomeration
The available evidence suggests that the local catalytic effects of airports include attracting business investment
and raising productivity. Combining these two effects may lead to the development of new concentrations of
economic activity in the locality of the airport. In some cases, these may take the form of industry ‘clusters’
which benefit both from the proximity of the airport and each other.
These clusters have led to the development of ‘aerotropolis’ (Kasarda, 2000), or airport-city like business
models, where airports are increasingly being seen as ‘centres of economic activity’ (Prosperi, 2007). As a
result, many studies in the economic impact literature assess the benefits of ‘clusters’ of economic activity
surrounding airports.
What are the benefits of clusters?
The positive effects of clustering economic activity are known as agglomeration economies. They arise where
there is an efficiency gain for all firms within a cluster, resulting from their close proximity to each other. The
majority of the literature on the topic (see, for example, DfT (2006) and Cohen & Paul (2008)) summarises the
drivers of these benefits in three distinct categories:
Knowledge spillovers – firms interact with, and learn from, each other within the cluster thereby
facilitating efficient sharing of knowledge within the market;
Access to labour – the cluster attracts skilled labour to an area, thus increasing firms’ access to a high
quality workforce and reducing search costs; and
Input effects – the cluster attracts suppliers to locate nearby, providing firms with access to a greater
range of specialised inputs, whilst also reducing transport costs.
A study by Rosenthal and Strange (2004) reviewed the literature which has attempted to quantify these
benefits. It found that doubling the size of a city leads on average to an increase in productivity of 3-8%. This
does not, however, fully capture the breadth of estimated impacts, or specific drivers which may alter the
magnitude of this relationship.
For example, Graham (2007) showed that the impact varies greatly by industry, with productivity in banking,
finance and insurance being more than three times as responsive to an increase in agglomeration as
construction and manufacturing (see Figure 8). Here, agglomeration is proxied by the density of employment,
while the elasticity of productivity estimates show how far a firm’s productivity changes as the level of
agglomeration changes. A score of 0.15 means that a 10% increase in agglomeration increases productivity by
1.5%. This implies that in order to estimate the positive impact of airport expansion it is necessary to identify
how industry clusters would develop (including the degree of agglomeration which would occur).
Figure 9: Elasticity of productivity with respect to agglomeration by industry
Airports Commission
PwC 22
3. Local Economy: Literature Review
0
0.05
0.1
0.15
0.2
0.25
Banking, finance and insurance
Business services
Transportation, storage and communications
Real estate
Distribution, hotels and catering
IT
Manufacturing
Whole economy:
0.118
Construction
Source: PwC analysis, BEA (2014)
Examples of clustering around international airports
Although not typically considered as part of the economic impact of an airport, several studies have examined
the role of airports in facilitating the development of clusters. Two such studies are summarised below: one is
for Amsterdam Schiphol Airport and the other a comparison of three American airports. These studies
demonstrate that there re different approaches for identifying and quantifying the role of an airport in
generating industry clusters and also highlight the importance of the local context in determining the nature
and scale of the clusters which develop.
Amsterdam Schiphol Airport
As can be seen from Figure 10, a number of business parks have been established in the vicinity of Schiphol
Airport, which has an area ‘larger than the extended historic centre of nearby Amsterdam’. Warffemuis (2007)
looked at one particular element of this, the clusters of distribution centres that have developed in the area.
Along with Rotterdam, these two sites contain more than half the distribution centres in the Netherlands.
Figure 10: Business parks in the Amsterdam area
Airports Commission
PwC 23
3. Local Economy: Literature Review
Source: Warffemuis (2007)
When surveying the distribution centres, Warffemuis showed that more respondents named location factors
linked to the agglomeration benefits of clustering in motivating their investment decision than the presence of
the airport itself (see Figure 11). Proximate access to vital products and services for the business (such as
warehouses, transport links and service providers) was of particular importance. Warffemuis further
demonstrated that only a minority of distribution centres located in the surrounding area were Schipholdependent due to the nature of their cargo and business activities. The remaining firms were at least partially
influenced in their location decisions by the agglomerative benefits that the airport indirectly generated.
These findings have three clear implications for how the benefits of clustering in the locality of an airport
should be considered:
They demonstrate the potential of an airport to attract activity, beyond that directly requiring the airport
for its success.
They highlight the importance of the supporting services and infrastructure in facilitating the
development of clusters. In this case, for example, the level of investment in transport infrastructure
beyond that of the airport was vital in the decision making process of the distribution centres. As a result,
airports highlighting the potential for business clusters to develop in the locality would need to
demonstrate the availability of required sector-specific support services.
The nature of the influences on this particular cluster shows the importance of understanding the local
context. For example, limited availability of land or land-intensive warehouses and the lack of a
developed logistic service provider industry would prohibit this particular model being recreated
elsewhere.
Figure 11: Importance of location factors to distribution centres surrounding Schiphol Airport
Airports Commission
PwC 24
3. Local Economy: Literature Review
Proximity to logistics service providers
Accessiblity by roads/ rail
Availability of warehouse space/ land
Proximity to Schiphol Airport
Proximity to former warehouse location
0
10
20
30
Number of respondents
40
50
Source: Adapted from Warffemuis (2007)
Atlanta, Dallas & Memphis airports
Prosperi (2007) investigated concentrations of economic activity around Atlanta (Hartfield-Jackson)
International Airport, Dallas/ Fort Worth Airport and Memphis Airport. The different sector-specific
concentrations are outlined in Table 9. These are the ‘signature’ collections as they represent the most distinct
industry-specific collections of activity.
The report notes that the distribution of economic activity in these areas is not significantly different to typical
urban centres. It argues that only the transport-related activity in each site and the finance and computer
activity in Dallas are sufficiently densely concentrated to be described as “cluster-like”, as opposed to
“concentration-like”. This evidence, therefore, suggests that while an airport may lead to an increased
concentration of economic activity, it will not necessarily stimulate clustering behaviour beyond the existing
distribution of industries in the locality.
Table 9: Sector-specific concentrations of economic activity surrounding airports
City
Transportrelated activity
Atlanta
Dallas
Memphis
Communications
Finance &
computers
Corporate
headquarters
Food & food
processing
Source: PwC analysis, Propseri (2007)
Also evident from the study is the lack of consistency between the industries which choose to locate around
different airports. This further reinforces the importance of the local context in understanding why a cluster
forms. This means that, with the possible exception of aviation/ transport-related activity, no evidence suggests
that any one particular industry cluster will be particularly likely to develop. The author recognises that these
differences are driven by a blend of historic land use and economic features. For example, the long standing
roles of Atlanta and Memphis as centres of inter-state and regional highway systems have made them suitable
as communication hubs and locations for corporate headquarters respectively. Alternatively, the more recent
development of Dallas/ Fort-Worth International Airport has provided ‘fresh land’ for new firms to locate
within.
One implication of these differences is that the impact on the value-added generated by an airport cannot be
easily predicted. Figure 12 shows the distribution of productivity (measured by value-added per FTE) across the
Airports Commission
PwC 25
3. Local Economy: Literature Review
industries which are most concentrated around one or more of the three airports. Both the range of industries,
from paper products to finance and insurance, and the range in value-added per FTE, are evident. Although
typically higher than the national average, the range in productivity represents a risk to any estimates of the
positive impact of clustering.
Figure 12: Value-added per FTE by industry (2012)
$0k
$100k
$200k
$300k
Broadcasting and telecommunications
A
Publishing industries, except internet
A
D
Computer and electronic products
Finance and insurance
D
Air transportation
A, D, M
A
Wholesale trade
Management of companies and enterprises
M
Food and beverage and tobacco products
A, M
Durable goods
A, D, M
Paper products
M
Other transportation and support activities
Warehousing and storage
$400k
A =Atlanta
D = Dallas
M = Memphis
A, D, M
M
USA average ($130k)
Source: BEA (2014)
Methodological issues - measuring agglomeration benefits
Several studies have estimated the impact of agglomeration economies on productivity, often producing
significantly different results. In addition to different local contexts, a further reason for these differences may
be methodological.
The Department of Transport for Victoria (2012) highlights two separate aspects of methodology which may
lead to measurement error in accurately estimating agglomeration effects:
Controlling for bias; and
Finding a suitable dataset.
The majority of studies estimate changes in productivity by specifying economic models which could be subject
to bias if the models are mis-specified. For example, the presence of higher productivity firms in more densely
populated areas could be the result of sorting, whereby more productive firms move to these areas, rather than
the reverse. This would over-estimate the impact of agglomeration on productivity. The Department of
Transport in Victoria notes that recent studies have attempted to control for this effect.
Studies would also need to ensure that agglomeration effects could be separated from the positive impact of
proximity to a transport hub or being located in a large urban environment. For example, in the case of the UK,
Overman et al (2009) concluded that there were no substantial benefits to industry-specific clustering, once
these two factors were controlled for.
Finally, accurately estimating this impact requires detailed information about firm productivity, as well as
information on the degree of agglomeration. For example, estimating agglomeration based on employment
density (see Graham (2007) above), only accurately captures the ‘access to labour’ element of agglomeration
economies, and provides little understanding of the significance of ‘knowledge spillovers’ or ‘input effects’. As
Airports Commission
PwC 26
3. Local Economy: Literature Review
they are less tangible, these two elements are more difficult to estimate, but excluding them from the analysis
means that some differences between areas will not be fully controlled for.
3.5 Industry structure in London
Our earlier analysis highlights the importance of understanding the local context when considering firm
location decisions and clustering as area-specific factors play a key role in driving each of these. This section
briefly looks at the existing analysis of industry cluster within London and highlights the role that its airports
have played in developing them.
Figure 13 shows the Prime Minister’s Strategy Unit map of industry clusters within London in 2004. It
highlights the breadth of industries which are perceived to have formed clusters which are rarely separate from
each other. It also shows the importance of Central London. Ten distinct clusters are identified there.
Figure 13: Summary map of industry clusters in London
Source: Prime Minister’s Strategy Unit (2004)
A similar picture emerges from more recent work to map industry-specific clusters, such as that of the London
Councils in 2010 which shows that the majority of clusters are located in London’s core, with additional clusters
in the periphery. This distribution demonstrates the pull of London’s centre in firms’ location decisions. It
seems likely that in the context of London the impact an airport has on access to this core will be of particular
importance. Figure 13 also recognises that additional industry clusters exist in Outer London, most relevantly in
the form of tourism & transport and ICT & technology clusters in Hammersmith & Heathrow.
Airports Commission
PwC 27
3. Local Economy: Literature Review
This finding is consistent with that of Prosperi (2007), who identified that “cluster-like” concentrations of
transport-related activity developed in the locality of airports in Atlanta, Dallas and Memphis. This finding is
further demonstrated in Figure 14, taken from GLA Economics (2010), which identifies the magnitude of
employment in transport & communications in the Heathrow area relative to other selected Outer London
areas. It also specifies more precisely the nature of the cluster identified by the Prime Minister’s Strategy Unit
as “Tourism & Transport”, as being more heavily weighted towards Transport and Communications, than areas
of tourism spend such as Hotels & Restaurants.
These highlight the potential that an airport has to attract and support the development of clusters within
London and suggests the types which are most likely to develop.
Figure 14: Employees in selected Outer London areas by broad industrial group
Source: GLA Economics (2010)
Analysis commissioned by the London Councils in 2010 further demonstrates the presence of Heathrow
Airport’s transport cluster - defined as a cluster of ‘Transport, Logistics and Related Services’ – see Figure 15.
This highlights that, despite small pockets of activity elsewhere, the predominant transport industry hub is
located in West London and can presumably be linked to the presence of Heathrow.
Airports Commission
PwC 28
3. Local Economy: Literature Review
Figure 15: Transport and logistics clusters in London
Source: London Councils (2010)
The second cluster highlighted by the Prime Ministers Strategy Unit in West London was ICT and Technology.
Similar analysis from the London Councils (2010) is shown in Figure 16. It demonstrates that while these firms
have tended to concentrate in West London, there appears to be little evidence of a cluster close to Heathrow.
Although the evidence on the distribution of firms is less concrete than in the case of transport-related
activities, a ‘Western Wedge’ of economic activity is identified by both GLA Economics (2010) and the London
Plan (Greater London Authority, 2011). This is described as “an economic corridor with historical specialisation
in information technology that stretches from Central London through Heathrow and into the Thames Valley,
including towns like Reading and Slough”. This region, which is located around London Heathrow, is a key
centre of international headquarters and contains industry concentrations:
Video reproduction;
Publishing;
Motion picture and video production/ distribution;
Radio & television activities;
Scientific research and development; and
Data processing and computer manufacturing.
Airports Commission
PwC 29
3. Local Economy: Literature Review
Figure 16: ICT clusters in London
Source: London Councils (2010)
A further element of London’s industry clustering which needs to be considered is how the geographic
distribution and magnitude of industry-specific value-added may change in future. Figure 17 summarises
changes in the magnitude of the value-added generated by different industries between 1997 and 2011. This
shows that there are big differences in the growth rates between the fastest growing industries, such as real
estate and finance and insurance, and industries such as transportation and storage and manufacturing which
have remained reasonably flat or decreased in magnitude of value-added. These growth rates suggest how the
relative magnitudes of the value-added generated by different industries may differ in future, which would
affect the potential impact generated by an activity cluster in the locality of an airport.
Airports Commission
PwC 30
3. Local Economy: Literature Review
Figure 17: Change in GVA in London (1997-2011, current prices)
-50%
0%
50%
100%
150%
200%
250%
Real estate activities
Financial and insurance activities
Professional, scientific and technical activities
Education
Human health and social work activities
Information and communication
Administrative and support service activities
Construction
Primary & utilities
Accommodation and food service activities
Public administration and defence; compulsory social…
Arts and other services
Wholesale and retail trade; repair of motor vehicles
Transportation and storage
Manufacturing
Source: PwC analysis, GLA Economics (2014)
Airports Commission
PwC 31
3. Local Economy: Literature Review
4 Labour demand and supply
In this section we summarise the evidence of the impact of an airport, or airport expansion on employment and
labour demand, both directly at/ around an airport and more widely. We also consider how local labour supply
adjusts to changes in demand as a result of airport expansion.
As highlighted in the Heathrow and Gatwick case studies (see Appendices A and B), many jobs are created as a
direct result of airport operations, with the vast majority of these based on or around the airport site. A
significant change in airport capacity may, therefore, have a significant impact on local labour markets. This
section explores the nature of the jobs created as a direct result of airport operations, specifically considering:
The number of jobs supported;
The types of job which are created;
The skill mix of the workforce; and
The productivity of the jobs.
Box 4: Labour demand and supply – key findings
Labour demand & supply
Our analysis of labour demand and supply has focused on two questions:
What employment has been generated: direct (on- and off-site), indirect, induced and catalytic?
Could the jobs be met by the local and wider area? What was the remaining ‘net additional labour demand’?
Direct impacts
Evidence from previous studies reveals a wide range of estimates of the direct impacts of aviation activity
The average number of direct jobs generated for each million passengers handled ranges from under 500 to over 1,500
The drivers of these differences include: the share of long-haul flights, the nature of the terminal and passenger
experience, the level of freight transport and the business operating model
In addition, differences in methodology also contribute: for example, different studies use different definitions of the
‘scope’ of the airport and aviation activity and adopt different approaches to converting headcount numbers into FTEs
and this affects their comparability
Our review of airport economic impact studies suggests that just over half of direct jobs created at airports are in airlines
or other aviation industry firms: other major employment groups include government & security (9-18%) and ground
transportation (6-15%)
In the UK and USA, transport industry jobs are more skilled and more productive than the national average whereas
jobs in the storage, trade and retail sectors tend on average to be relatively lower skilled
The commuting patterns of direct employees (airport workers) are relatively consistent across those airports where
information is available: over 75% live within a 30-minute drive of the airport, and the majority travels by car
This pattern of commuting provides some indication of the geographic scale of the local labour market
It is also relevant for considering the effectiveness and efficiency with which labour supply adjusts to changes in labour
demand as a result of airport development
Indirect & induced impacts
There is less evidence on the share of national indirect and induced employment impacts which are felt locally and
regionally
A key factor influencing the employment multipliers is the size of the local area being considered: all other things being
equal, multipliers will be larger in larger areas because leakages from the ‘local’ economy will tend to be smaller
Evidence from Sydney Airport suggests that the nature of the local labour market will need to adjust to accommodate
the increase in supply
Similarly, evidence from the Joseph Rowntree Foundation highlights that new unskilled workers have moved into local
communities, while the existing workers have taken on higher skilled jobs
These adjustment mechanisms determine how labour cost and pressure on social infrastructure will change with labour
demand changes
They can only be fully assessed through general equilibrium modelling
Airports Commission
PwC 32
3. Local Economy: Literature Review
Catalytic impacts
Investment & productivity
The evidence is mixed on the impact in the labour market of airport expansion since it depends on the nature of
industries which locate in the locality: for example, Dallas/ Fort Worth International Airport has attracted highproductivity industries, such as computing, finance and insurance whereas evidence from Memphis International and
Amsterdam Schiphol airports suggests concentrations of low productivity distribution and storage firms
These differences indicate how the local economic geography and history affect the labour market demand through
changing required skill mixes
Tourism
The value added by tourism is associated with additional jobs in tourism intensive sectors, notably accommodation and
transport
What proportion of these jobs is local to the airport depends on the travel patterns of airport users in relation to their
final destinations: for example, some are closer to the final visitor destination than others
Further jobs will also be created through outbound tourism: the majority of these (60%) are in the air transport industry
(i.e. direct or indirect jobs), with additional employment in areas such as retail (25%) and travel agencies (7%)
Outbound tourism could also reduce value-added by facilitating the substitution of local expenditure for expenditure in
other regions or abroad: local economic welfare may be enhanced by changes in the opportunity for travel
How far an increase in airport capacity will lead to increases in outbound travel depends on levels of demand and price
adjustments in the air transport market: for London runway capacity expansion this is being analysed through the DfT’s
transport modelling, which should be applied in this module
Clustering & agglomeration economies
There is very little evidence in the existing literature on the impact that industry clustering around airports has on the
level and nature of labour demand
A wide range of industry clusters (including, transportation, telecommunications, publishing and distribution) have
developed, and these have very different implications for productivity, skill mix and employee numbers
Table 10 highlights some of the key studies we refer to in this section besides those reviewed as part of the case
studies: a full list of studies used is provided in Appendix G.
Table 10: Local employment - relevant studies
No.
Title
Authors
Year
Geographies covered
1
Economic Impact Study
Leigh Fisher
2011
Ottawa
2
2013 Economic Impact Study of San
Francisco International Airport
EDRG
2013
San Francisco
3
Transportation and storage sector: skills
assessment
UK Commission for
Employment and Skills
2012
UK
4
Employment Generation and Airports
BITRE
2012
Australia
4.1 Labour demand
In the first part of the section we review the available evidence in relation to the local impact of airports on
labour demand. We start by reviewing the scale of employment linked to airports and then consider the
available evidence on the mix of skills and labour productivity.
Employment
Table 11 summarises the local direct, indirect and induced employment associated with airports in Europe and
the rest of the world. Also shown – as another measure of the size of the airport - is the number of passengers
handled.
Airports Commission
PwC 33
3. Local Economy: Literature Review
Table 11: Summary of local employment linked to case study airports
Airport
Study
Passengers
(million)
Direct
FTEs
London
Heathrow
Optimal
Economics (2011)
70
84,400
London Gatwick
BHC (2011)
34.2
Frankfurt am
Main
INFRAS (2013)
JF Kennedy,
New York
Indirect
FTEs
Induced FTEs
Total FTEs
11,100
18,600
114,100
24,900
1,900
6,400
33,200
58.04
78,000
38,300
39,200
155,500
New York State
(2010)
61.5
132,600
92,000
n/a
224,600
Paris Charles de
Gaulle
BIPE (2012)
62
86,000
49,100
60,200
195,300
LaGuardia, New
York
New York State
(2010)
33.5
55,100
39,200
n/a
94,300
Manchester
York Aviation
(2008)
21.2
19,300
12,900
9,000
41,200
Source: Compiled by PwC based on previous studies
Skills mix
The skills required of employees linked to an airport are a key dimension of labour demand. The UK
Commission for Employment and Skills (2012) looked at skill levels within the transport and storage sector. It
demonstrated, as shown in Figure 18, that the skill mix within the industry was broadly higher than that in the
overall economy, when measured by the highest educational attainment. Specifically, the share of workers with
Level 4 qualifications or above (broadly equivalent to a diploma, foundation degree or higher) was similar to the
national average. The air transport industry, however, employed little over half the number of individuals with
only a Level 1 qualification or below, relative to the national average. Also shown is the breakdown of the
qualifications of Heathrow Airports’ employees: this highlights the concentration of employees at Level 2.
Figure 18: Distribution of employees by highest educational attainment (2010)
12
12
60
37
37
40
20
28
18
21
17
23
24
UK economy (2010)
England & Wales (2011)
23
16
12
Heathrow Airport
Air transport
Level 1 and below
Level 2
Level 3
Level 4+
Sources: UK Commission for Employment and Skills (2012), Heathrow Related Employment, Optimal Economics (2011)
Airports Commission
PwC 34
3. Local Economy: Literature Review
As highlighted by BITRE (2012), the most common occupations of those employed in the air transport sector
were:
Personal service occupations (36%);
Associate professional and technical (23%); and
Managers and senior officials (12%).
This suggests that the definition of workers in air transport excludes roles such as retail staff and cleaners,
which are typically lower-skilled roles. This may explain the difference between these findings and those of
Ernst & Young (2012) and Hakfoort (2001) who both identified that more than half the jobs associated with
airport activity would be lower skilled. This difference highlights the importance of being able to understand
which sectors are impacted at the local level and what level of skills are needed for the jobs created in order to
assess the impact on local labour markets.
Figure 19: % of workers with Level 4 qualifications or higher by industry sector (2010)
0%
20%
40%
60%
80%
Education
Health
Information and communication technologies
Financial, insurance & other professional services
Air transport
Manufacturing
Construction
Real estate & facilities management
Wholesale & retail trade
Transport & storage
Source: UK Commission for Employment and Skills (2012)
Labour productivity
A further aspect of the labour market investigated by the UK Commission for Employment and Skills is the
productivity of jobs in the transport and storage sector.
Figure 20 summarises this, showing that the average Gross Value Added (GVA) per head in the air transport
sub-sector is approximately £67,000 (nearly 50% higher than the average across all industries). The chart also
demonstrates that sectors such as wholesale & retail trade and wider transport & storage, which represent a
significant share of direct jobs created by an airport (see Figure 15), are noticeably less productive.
Airports Commission
PwC 35
3. Local Economy: Literature Review
Figure 20: Value added per employee by industry sector (2010)
£0
£20k
£40k
£60k
£80k
£100k
Financial, insurance & other professional services
Real estate & facilities management
Information and communication technologies
Air transport
Construction
Manufacturing
Transport & storage
Wholesale & retail trade
Education
Health
Source: PwC analysis, UK Commission for Employment and Skills (2012)
Aside from the industry-mix, it is also likely that the size and type of airport will impact on productivity. For
example, it could be expected that larger airports would see higher productivity arising from economies of scale
in areas such as procurement and financing. Using data from the 11 airports discussed earlier, Figure 21 shows
the relationship between number of airports passengers and value-added per FTE. There appears to be a
generally positive trend between the number of passengers at an airport and its productivity, potentially
suggesting economies of scale in operation20. While these results cannot be used to specify the relationship due to the small sample size, methodological differences between the studies and the specific local context of
each example - they highlight a potential area of interest which could be investigated further through analysis of
time series data or econometric modelling.
Figure 21: Value-added per FTE by passenger numbers
80m
Annual passenger numbers
70m
LHR
60m
50m
40m
30m
SYD
MSP
20m
YVR
BUD
10m
WLG
STN VIE
CGN
SNA
HHN
0m
£0
£20,000
£40,000
£60,000
£80,000
£100,000
£120,000
Source: PwC analysis
Key: BUD - Budapest, HHN – Frankfurt Hahn, WLG - Wellington, CGN –Colgne-Bonn , SNA –John Wayne (Orange County) , YVR Vancouver , STN – Stansted, VIE – Vienna, MSP – Minneapolis-St Paul, SYD – Sydney, LHR - Heathrow
20
This relationship would exclude a few outliers, most notably London Heathrow.
Airports Commission
PwC 36
3. Local Economy: Literature Review
Indirect and induced employment
We also need to consider the extent to which airports support local indirect and induced employment.
The local impact of indirect and induced employment largely depends on the share of suppliers which are local
to the airport. As shown through the distribution of output multipliers in Figure 5, this largely depends on the
definition of ‘local’ which is used. Unlike the literature on direct employment, there is much less evidence on the
share of indirect and induced employment impacts which are felt locally and regionally. The best example is the
study of London Heathrow (see Appendix A).
Catalytic employment
Evidence of the additional employment created through the catalytic impacts of an airport is limited. Such
evidence as there is tends to focus on the impact arising from inbound tourism. In addition, there is no
consistent evidence on the ‘locality’ of the impact.
Employment impact of tourism
Figure 22 shows the distribution of employment directly linked to tourism in the UK by sector. These estimates
are based on data from the tourism satellite accounts.
Figure 22: Direct employees from tourism in the UK by industry group ('000 FTEs, 2011)
0
50
100
150
200
250
300
350
Other consumption products
Food and beverage serving services
Accommodation services for visitors
Cultural activities
Travel agencies & other reservation…
Road passenger transport services
Sport and recreation activities
Air passenger transport services
Railway passenger transport services
Transport equipment rental services
Water passenger transport services
Exhibitions & conferences etc
Source: Characteristics of Workers in Tourism, ONS (2013)
In addition to stimulating employment in the specific sectors highlighted above, the profile of employees in
tourism industries in terms of qualifications is different to the UK as a whole. Figure 23 looks at the skill level of
employees within the industry. It demonstrates that, aside from culture, sports, recreation & conferences,
tourism typically employs individuals with lower skill levels (when measured according to highest educational
attainment). Differences are also seen between the age, gender and ethnicity of employees in the tourism and
non-tourism industries. All these factors would need to be considered when evaluating the impact of tourism on
the local labour market, and the ability of the labour supply to react to this change in demand.
Box 5: Employment impacts of tourism linked to airports – evidence from the case studies
Two of our case studies have reviewed studies which have assessed the role of an airport in sustaining local tourism
employment:
A report for CDG estimates that around 52,600 jobs depend on spending by tourists using Charles de Gaulle airport in
Paris
A similar study in New York in 2004 estimated that 190,000 jobs depended on spending by domestic and international
visitors using New York’s airports
Airports Commission
PwC 37
3. Local Economy: Literature Review
Figure 23: Distribution of highest education attainment for employees in tourism industries
(2011)
0%
10% 20% 30% 40% 50% 60% 70% 80% 90% 100%
Food & beverage serving services
Culture, sports, recreation & conferences
Passenger transport & vehicle hire, travel agencies
Accommodation services for visitors
Tourism industries
Overall distribution
Non-tourism industries
Degree or equiv. / Higher Ed.
A Level or equiv
GCSE grades A-C or equiv
Other quals
No qual
Source: Characteristics of Workers in Tourism, ONS (2013)
4.2 Labour supply
Potential sources of labour supply
In this part of the section, we examine how airports secure their labour supply in order to meet changes in
demand. Ernst & Young (2012) identify three potential sources of resident labour which would meet such
demand:
Unemployed residents in the local area seeking employment (above and beyond the long-run rate of
structural unemployment);
Inactive and underemployed residents in the local area seeking full-time employment; and
Future resident labour force in the local area, above and beyond those employed by other new jobs.
Mobile labour comes from employees who choose to commute to their place of work. Its scale has implications
for road and public transport use. We consider the available evidence on the place of residence of employees in
relation to the airports where they work and the commuting pattern of airport workers.
A further dimension which needs to be considered is the matching of appropriate skills and experience to fill
the roles which are created. In its analysis of a potential site for a new airport near Sydney, Ernst & Young
(2012) found that, although total labour supply was expected to exceed demand by roughly 5,000 in 2060, this
would be through an “over-supply” of 9,000 skilled workers and an “under-supply” of 4,000 unskilled workers.
Rebalancing the labour market to meet the expected demand would require some combination of:
Less skilled workers to be sourced from a wider area (which could be difficult since the extent that
employees are prepared to travel is often linked to their skills/expected remuneration); and/or
Persuading more skilled workers to accept less skilled roles (with a potential reduction in both their
earnings and productivity).
This example highlights the importance of understanding the relationship between labour demand and supply
in sufficient detail. Table 12 summarises some example indicators on the nature of the labour supply in three
local authorities which house the largest airports in the South-East of England, relative to regional and national
benchmarks. These data suggest that, relative to the benchmarks, these local areas have higher unemployment
rates, a slightly lower skilled workforce (with the exception of Hillingdon) and an above average share of the
labour force working in transport and communications. Only a limited understanding can be gained from this
information alone, but it indicates the type of information which studies ought to consider.
Airports Commission
PwC 38
3. Local Economy: Literature Review
Table 12: Labour supply indicators for selected local authorities and regions (2013)21
Hillingdon
(Heathrow)
Crawley
(Gatwick)
Uttlesford
(Stansted)
Largest London LAs
Croydon
London
Barnet
South
East
UK
Economic activity
rate- aged 16 to 64 (%)
77.6
82.9
86.5
81.0
77.5
76.8
80.0
77.3
Unemployment rate aged 16+
8.4
13.1
N/A
8.4
5.5
8.5
5.7
7.5
% in employment
working part-time aged 16-64
21.3
18.6
17.7
25.3
23.0
21.5
26.3
25.5
% with degree or
equivalent and above aged 16-64
34.3
19.9
25.4
33.0
43.8
42.3
29.3
26.5
% with no
qualifications - aged
16-64
6.8
9.5
5.6
6.1
4.4
7.8
6.5
9.7
% all in employment
who are in
professional
occupations
19.5
13.3
19.9
20.8
27.0
25.0
21.3
19.7
% all in employment
who work in transport
and communications
17.8
19.1
9.2
11.6
9.3
12.0
10.3
8.8
Source: PwC analysis, NOMIS
Place of residence of airport employees
As the majority of the direct impacts from airport expansion are likely to be generated on the airport site, there
will be pressure for the roles to be filled by residents local to the airport site. Understanding the geographic
distribution of individuals who work on the airport site is useful as it helps to define the local area and the
geographical breadth of the impacts. It can also be used as the basis for assessing the availability of labour
within the local area and the potential impact on commuting patterns and supporting transport infrastructure.
Table 13: Place of residence of workforce at Heathrow Airport
No. working at Heathrow
% of Heathrow workforce
Hounslow
10,760
14.6
Hillingdon
8,960
12.2
Ealing
5,760
7.8
Slough
4,090
5.6
Spelthorne
3,920
5.3
Local labour area
47,660
45.5
Other areas
25,770
54.5
73,430
100.0
Total
A number of studies have mapped this distribution. In in all cases the large majority of the on-site workers
travel less than one hour. For example, some 60% of the airport employees at Frankfurt-am-Main Airport live
within approximately 35 km of Frankfurt-am-Main airport. Nearly 75% of the direct employees at John Wayne
Airport live in Orange County and therefore less than a 30 minute drive away from the airport. Looking more
narrowly, more than half the employees live in the towns of Santa Ana, Orange and Costa Mesa, within a 15
minute drive. Similarly, nearly 90% of employees at Kingsland Smith Airport in Sydney live within a 50 minute
21
Data is taken from the Annual Population Survey
Airports Commission
PwC 39
3. Local Economy: Literature Review
drive of the airport, while more than 60% live in areas adjacent to the airport within a 15 minute drive. Both
these examples are airports which are located in the centre of densely populated areas: Sydney Airport is a little
over 10km from the centre of Sydney (with a population density of 380/km2) and Orange County is the second
most densely populated county in California (density of over 1400/km2).
Alternatively, Stockholm Arlanda Airport is located in Sigtuna municipality (density of 120/km2). It is more
than 35km away from the nearest cities of Stockholm and Uppsala. This does not, however, appear to impact
significantly on the distribution of travel times for workers travelling to the site (see Figure 24). Again, over 75%
of workers live within a 30-minute drive and nearly 90% live within an area extended to include Stockholm
(which is a 32 minute drive away).
Figure 24: Areas with more than 100 workers commuting to Sigtuna (a close proximity for
Arlanda Airport)
Source: PwC analysis
Commuting patterns
A final consideration in relation to the supply of direct labour is the commuting patterns of the workers at the
airport. When combined with the understanding of the local area and the expected labour supply, this allows for
analysis of how the local transport infrastructure will be able to cope with increases in demand.
Figure 25 shows the distribution of commuting methods at major international airports. This demonstrates that
the majority of people (at least 70% in each case) use a car to drive to work, with the majority of those travelling
alone. Despite the different infrastructure and geographical context of each airport, the commuting methods are
reasonably similar, and do not differ greatly between Stansted and the four American airports. However, the
differences which do exist, such as the increased use of carpooling in Los Angeles over bus/ rail use,
demonstrate the importance of understanding the local context. Information at this level would be the very
minimum needed to understand the potential impact of a change in capacity on local transport infrastructure.
Airports Commission
PwC 40
3. Local Economy: Literature Review
Figure 25: Distribution of commuting patterns by employees of major international airports
100%
80%
60%
40%
20%
0%
Boston Logan
International
London Stansted
Car (solo)
Los Angeles
International
Car (2+ people)
Bus/ rail
Portland International
Bike/walk
San Francisco
International
Other
Source: Transportation Research Board (2012)
In addition to understanding the existing situation, studies would need to consider how this may change in
future and with the introduction of a change in capacity. There is little evidence in the existing literature on the
impact of a change in capacity on commuting methods, and any effect would be so specific to a local area that
reasonably little could be learned from the findings. Figure 26 displays a more general trend, seen at London
Stansted, of employees increasingly using means of transport other than the car. In particular, there appears to
have been a large amount of switching to public buses and coaches. As a result, the use of alternatives to car
transport has nearly trebled in less than 10 years. Trends such as this would be important to consider in any
future projections of commuting patterns.
Figure 26: Change in commuting patterns to London Stansted (2002/03-2011)
100%
80%
60%
40%
20%
0%
2002/2003
2005
Car driver
Car passenger
2007
Public bus/ coach
2009
Rail
Walk/bicycle
2011
Other
Source: Transportation Research Board (2012)
Airports Commission
PwC 41
3. Local Economy: Literature Review
5 Housing & land
This section summarises the impact of an airport, or airport expansion, on the need for, and availability of,
housing, and the use of land at and around an airport. Two key questions which broadly cover the areas of
interest with regards to this are:
Housing: How do local housing markets adjust to airports and what factors influence individuals’
decisions on whether to live in the locality of an airport?
Land: What factors influence the location of real estate developments and how does local planning
influence developments close of airports (or other transport infrastructure improvement)?
Box 6: Housing & land – key findings
Housing
Our analysis has examined two main questions:
How much of the ‘net additional labour demand’ will add pressure to the local housing market and associated services?
How much housing demand could there be from other sources, such as people wishing to live close to the airport for
connectivity reasons?
Our key findings are that:
To the extent that airport expansion increases direct and indirect employment in the local area, this will create pressure
in the local housing market
The extent of this pressure depends in part on the scale of the local area (geographically and the economically active
population); changes in commuting patterns are also an important adjustment mechanism
Evidence from the Joseph Rowntree Foundation in relation to Heathrow suggests that proximity to employment
opportunities has affected the location decision of many residents
How airport expansion affects local housing markets is ambiguous: on the one hand, it directly stimulates housing
demand as more airport workers are needed, and indirectly as improved connectivity attracts mobile firms and/or
enables existing firms to become more competitive (thus boosting their demand for labour). On the other hand, negative
externalities associated with airport expansion (e.g. noise, congestion) can make the area less attractive so reducing
housing demand
McMillen (2004), for example, finds that the impact of ‘severe noise’ in reducing demand lowers house prices by 9.2%.
The impact of additional airport capacity on noise is considered in module 5 of the Appraisal Framework.
Conversely, demand for housing is shown to be increased by Lipscomb (2003) through the improved connectivity
brought by an airport.
Land
Our analysis has examined the factors that influence the location of real estate developments and how local planning
influences developments close to airports (or other transport infrastructure improvements)
Our key findings are that:
The evidence demonstrates that the amount of land which is required in the locality of an airport varies greatly
according to the local context.
For example, Dallas/ Fort Worth airport covers 18,000 acres, of which 6,000 are for non-aviation activity. Most other
airports are, however, considerably smaller
Baker et al (2012) suggest that the nature of the land used by airports has changed with their recent development,
stating that ”large international airports in Europe, North America and Asia have varied functions beyond airport traffic
and operate as metropolitan hubs with a diverse range of land uses”
Similarly, CBRE research demonstrates how the role of land used by airports has changed, showing that occupiers of
office space at airports are dominated by the technology and telecommunications (T&T) and manufacturing sectors
The result of this has been to increase land rents on airports sites, to the extent that land at Amsterdam Schiphol is now
more expensive than in the Amsterdam CBD. This type of adjustment mechanism with regards to an increase in demand
will have a significant impact on the nature and level of land use in the vicinity of an airport.
Table 14 highlights some of the key studies referred to in this section besides those considered as part of the
case studies. For a full list of studies used, please see Appendix G.
Airports Commission
PwC 42
3. Local Economy: Literature Review
Table 14: Housing & land - key sources used
No.
Title
Author
Year
1
Airport Office Developments: Assessing the Potential for New Schemes
CBRE
2013
2
The Impact of Airport Noise on Residential Real Estate
Randall Bell
2001
3
Measuring the effects of transportation infrastructure location on real estate prices and
rents: investigating the current impact of a planned metro line
Antoniou &
Efthymiou
2013
4
Airport expansions and property values: the case of Chicago O’Hare Airport
Daniel P
McMillen
2004
5
Developing tools to support complex infrastructure decision-making
Baker &
Mahmood
2012
5.1 Housing
In this part of the Section, we briefly consider the limited available evidence on the influence of airports on
(local) housing demand and value. This includes a report by the Joseph Rowntree Foundation on the local
community surrounding Heathrow, however no similar study exists for the area around Gatwick. We focus on
the factors that influence individuals’ decisions on where to live in relation to an airport.
Factors influencing individuals’ decisions to live in the locality of an airport
The development of transport infrastructure is an important driver of urban development. According to
Efthiamou et al (2013), its impact on house prices “is either positive, due to the capitalization of the commuters’
travel costs in the housing market of the area, or negative, when there are generated externalities (such as
noise)”.
Bell (2001) states that there are hundreds of detrimental conditions that affect property market values. Airport
noise is recognised as an externality that is imposed on property owners, generally on a permanent basis.
Empirical studies indicate that airport noise reduces residential property values. McMillen undertook research
in 2004 which attempted to quantify the effect of airport noise on property values around one of the world’s
busiest airports, Chicago O’Hare. The author notes that “while much of the opposition to airport expansions
focuses on aircraft noise, it is ironic that airports are actually becoming significantly quieter over time. New
aircraft are much quieter than older planes, and the older aircraft are being retired. Indeed, a single model, the
B72Q, which is being phased out by the major airlines, generated over 70% of the incidents of “severe noise” at
O’Hare in 2001. In addition, airports have become quieter as night flights are reduced.” Nevertheless, McMillen
states that opponents of airport expansions continue to cite increased noise as a major complaint. Using
transactions data from 1997, McMillen finds that home prices are 9.2% lower in the area affected by severe
noise. However, it is suggested that as a result of aircraft becoming quieter, new runway reconfigurations and
proposed changes to flight paths, the forecast net impact of the proposed additional runway at O’Hare was
actually an increase in house prices by nearly $300 million.
In the case of Manchester Airport, sources cited in Efthymiou et al reached opposite conclusions when
measuring the impact of the airport: Pennington (1990) found that aircraft noise created a negative impact,
whilst Lipscomb (2003) concluded that increased accessibility led to an uplift in values. The length of time
between these studies and the development in aircraft technology in the intervening period (as highlighted
above) may explain the differences in findings. We note that the impact of airports on noise and quality of life is
being considered more fully as part of other Modules.
Research published by the Joseph Rowntree Foundation in 2011 suggests that proximity to employment
opportunities at Heathrow Airport has affected location decision-making for many local residents. The research
considered community experiences and understandings of globalisation in the UK and examined the ‘Heathrow
Airports Commission
PwC 43
3. Local Economy: Literature Review
Village’22 as a community that is outwardly connected and associated with a long history of immigration. As
such, it has strong and diverse external connections in economic, social and cultural terms. The report
described Heathrow Village as a ‘tight’, though ethnically diverse, community, on the basis that so many people
worked at Heathrow in a variety of roles such as catering, transit, baggage handling and customer services. The
authors state that “many people in the area are tied to Heathrow airport through their employment by a range
of firms, which often operate through dense and complex global contractual relationships. The area contains a
variety of ethnic groups, reflecting successive waves of inward migration from Ireland, south Asia and more
recently Somalia, which continues to open the area up to broader global social and cultural flows and
influences. By UK standards, the local labour market [around Heathrow Airport] is relatively buoyant, with low
levels of unemployment and median earnings in line with the national average.”
A local councillor interviewed by the researchers observed that as residents are upskilled they move further
away from the airport: “And what quite often happens is that the really unskilled work tends to get taken up by
the incoming communities… Because it’s been easier to do those jobs and they’ve (the established communities)
actually stepped up a grade. They’re integrated into the wider society. So they step up and move out further
which lets more people in.”
This finding only provides one viewpoint; nevertheless, it suggests that the housing market in Heathrow Village
is not seen as a desirable location in which residents want to settle; although employment levels are high, the
dominance of unskilled workers may constrain house price growth on the basis of affordability.
5.2 Land
In the second part of this Section, we consider the limited available evidence on the influence of airports on
land use and values. First, we examine the development of airport commercial markets and then consider how
accessibility shapes commercial property developments. Second, we review how airports influence local
economic and land use planning. Due to a lack of data availability around Heathrow, the second section
focusses on the experience of Gatwick Airport.
Airport commercial property markets
Baker et al (2012) state that the role and scale of major urban airports worldwide have changed over the past
decade as a result of corporate and economic transformation. Modern airports can no longer be considered in
isolation from the metropolis that they serve: “Large international airports in Europe, North America and Asia
have varied functions beyond airport traffic and operate as metropolitan hubs with a diverse range of land uses.
Most large international airports have developed land on the airport for commercial and light industrial
purposes that are often not associated with aviation-related uses. The change in land use around the airport,
coupled with the increasing use of the airport for international travel, has often placed demands on the
transportation infrastructure that services the airport area. Included in this demand is a wide range of
stakeholders, users and infrastructure providers that have differing goals, objectives, models and interests.”
CBRE has assessed a number of European airport markets. Its research shows that in addition to companies
which are directly related to aviation activity, occupiers of office space at airports are dominated by the
technology and telecommunications (T&T) and manufacturing sectors (see Figure 27).
Referring to the communities to the west of London around Heathrow airport, spanning the boroughs of Hillingdon,
Hounslow and Ealing.
22
Airports Commission
PwC 44
3. Local Economy: Literature Review
Figure 27: European airports occupier profile (2013)
Logistics
3%
Media
5%
Energy Public
2%
2%
T&T
29%
Travel
9%
Banking & Finance
10%
Business Services
12%
Manufacturing
28%
Source: CBRE
In terms of occupier trends, discussions with CBRE reveal that the large US hardware manufacturing firms who
established office campuses around European airports in the late 1980s/1990s are currently consolidating their
space in these locations, or are moving offices to more central areas. The new generation of technology firms
that is driving demand from this sector prefers central locations in order to appeal to their target workforce. As
a result, demand from this sector around airports is significantly lower than in the past. Manufacturing firms
and travel related occupiers still have a tendency to locate in these areas – they are less concerned with locating
in central markets and still benefit from the good connections and cheaper rents they typically find in the
airport area.
According to CBRE, market conditions in the majority of non-central business districts, including airports, have
been challenging during the economic downturn. Three general features have driven the airport-based office
markets that have performed best during this period:
Connectivity to other major global cities and to the local economy;
Prominence in the region of established occupiers from the potential occupier’s business sector; and
Supply and location of suitable, high quality office space.
CBRE argues that the global connections at an airport are of particular significance to multinational firms based
outside Europe. Figure 28 shows that more than half of occupiers originate from non-European locations. Of
these, over 70% are located at an airport that had direct flights to the city of their global headquarters.
Airports Commission
PwC 45
3. Local Economy: Literature Review
Figure 28: Country of origin of key European airport occupiers (2013)
Spain, 4%
Other nonEuropean, 5%
Netherlands, 3%
France, 6%
US, 41%
UK, 7%
Other European, 7%
Japan,
10%
Germany,
14%
Source: CBRE
The level and quality of connections to the local economy are also important like global connectivity. Figure 29
highlights that the highest rents of the main European hub airports are achieved at Frankfurt and Amsterdam.
In addition to being large hub airports, both have quick transfer times by train to the city centre (10-15
minutes), but are also connected to the high speed national and international rail networks (see, for example,
the Frankfurt case study). Discussions with CBRE revealed that there have been a few examples of business
services / banking companies setting up offices at airports; however these are only at airports which have very
high grade central business district style office space and extremely quick connections to the central business
district (less than 15 minutes).
In contrast, average transfer times from Paris and Heathrow to the city centre are significantly longer (see
Figure 30). The size of these airports and land pressures close to their perimeters have resulted in the location
of business parks further from their perimeters .
Figure 29: Prime airport and city office rents (€/sq. m per annum)
1,400
120%
1,200
100%
1,000
80%
800
60%
600
40%
400
20%
200
0
0%
Prime city rent
Prime airport rent
Airport rents as % of city rents
Source: CBRE
Airports Commission
PwC 46
3. Local Economy: Literature Review
Figure 30: Distance and time from airport to city centre
70
60
50
40
30
20
10
0
Paris CDG
London HW
Hamburg
Brussels
Amsterdam
Distance to city centre (kms)
Madrid
Frankfurt
Dusseldorf
Time to city centre (mins on train)
Source: CBRE
Influence of accessibility on location of commercial property developments
Rymarzak et al (2012)23 provide a recent systematic review of the literature related to factors affecting the
choice of location for real estate developments. The authors analyse factors connected with both the distant
environment (the macro-environment) and those relating to the more immediate environment (the microenvironment). These factors are summarised in Figure 31.
Figure 31: Factors affecting general location choice
Macro-environment
The environment
Globalisation
Microenvironment
Technological
progress
Demand
factors
General
location
Supply
factors
Government
policies
Cultural
changes
Financial
system
Taxation system
Socio-demographic
changes
Source: Rymarzak et al (2012)
Rymarzak, M and Siemińska, E (2012), “Factors affecting the location of real estate”, Journal of Corporate Real Estate,
Vol. 14 No. 4, pp. 214-225.
23
Airports Commission
PwC 47
3. Local Economy: Literature Review
Regarding the macro-environment, the authors state that “the factor covering the widest range of issues in
business activities, from a generic point of view, is government policy. By defining priorities and main
directions for economic and social activities, the state creates specific conditions and principles for the
functioning of various business entities… Therefore, government policy, in conjunction with the global
situation, largely determines whether business is good or bad for a given entity, affecting the entities’ financial
situation and the nature of the location decisions it makes. The economic system and its degree of market
freedom and impact are crucially important for the business’ objectives, assessment of productivity levels, and
therefore, location.”
Once a business has decided to locate within a macro-environment, it will try to find a location that will best
satisfy the needs of its planned operations (i.e. the micro-environment). Each location has a value which is
determined by factors related to both supply and demand. On the demand side, factors that influence a
location’s attractiveness from a market perspective include the number of consumers, their purchasing power
and transportation between consumers and the site; this may involve either delivery of goods to the buyers or
the means for the buyers to get to the point of sale or service. Supply side factors are determined by the
location’s conditions that allow the specific business to be conducted, which directly or indirectly impact the
size of investment outlays in the construction phase as well as the firm’s net profitability level at this location.
Supply side factors may include natural resources, human resources, technical facilities, raw materials and
energy.
Table 15: Demand and supply factors affecting the general location choice of real estate
Industrial
space
Retail space
Office space
Demand factors
Supply factors
Number of consumers (buyers/clients)
Expected sales volume
Seasonality
Availability of natural resources (water, quantity,
quality of minerals, agricultural, forest) and their
prices
Prices of substitute products
Availability of fuels (coal, oil, gas, electricity, fuel
expandability, reserves)
New household formations
Age composition of new households
Transportation methods and costs (water, rail,
highway, air, access)
Household income
Mortgage credit conditions
Human resources (wage rates, skill levels,
productivity, availability)
Prices, productivity of production
Number and location of competitors
Population (number, density, growth rate,
age and gender pattern, educational
attainment)
Number of existing retail outlets (number of major
and less immediate competitors)
Households (composition and size,
income levels, average disposable income
per capita)
Retail outlet pattern and size
Proximity of transport networks
Retail saturation in area
Retail space vacancy rate
Credit conditions and payment plans
Unemployment level
Growth rate of new outlets
Internal, external migrations
Market share of individual retail facilities
Social mobility
Merchandise offered
Trend for delayed marriage and
parenthood
Age of retail facilities
Technical standard of existing space
Customer tastes and preferences
Parking capacity
Prices of substitute products
Unemployment level
Number of existing office buildings
Number of local firms
Office building pattern and size
Type of business of local firms
Number of local firms (expanding or
upgrading, ceasing business or leaving
local market)
Accessibility to the client – location vs housing estates
and transport networks
Office space vacancy rate
Number of new firms entering local
New office facilities growth rate
Airports Commission
PwC 48
3. Local Economy: Literature Review
Demand factors
Supply factors
market
Age, technical standard of existing space
Office space per employee (square feet)
Parking capacity
Recent absorption of space, including types of tenants
or buyers
Market rents/sale prices
Developer expectations
Demolitions, conversions
Credit conditions
Source: Rymarzak et al (2012)
These findings were reinforced by the ULI/EY survey24 of global real estate and public leaders which
highlighted infrastructure as the top factor driving the location of commercial property development: 88% of
survey respondents ranked infrastructure quality as a top or very important consideration when determining
where real estate investments are made, with infrastructure scoring highest for public leaders (91%) and second
to the top for private leaders (86%). In terms of the importance of different infrastructure categories, some
interviewees noted that services such as water, electricity and telecommunications are part of the package of
infrastructure elements that well-functioning cities are expected to provide and, therefore, differentiators are
“proximity to transport, especially high-quality transit, good roads and bridges, and, for some real estate
sectors, airport and passenger connections.”
Land use planning around Gatwick and Heathrow airports
Finally, the Airports Commission asked each of the local authorities close to Heathrow and Gatwick Airports to
provide relevant background information on how their approach to planning took into account the influence of
the adjacent airports. Responses were provided for four areas: Crawley, Horsham, North West Sussex (covering
Crawley, Horsham and Mid-Sussex) and Surrey. Very limited information was provided in relation to Heathrow
Airport.
Two key documents provide some insight into the broad economic trends around Gatwick Airport:
The North West Sussex Economic Appraisal (September 2009), which focuses on Crawley, Horsham and
Mid-Sussex, covers the period from 2006 to 2026; and
The North West Sussex Economic Growth Assessment (April 2014) covers the Gatwick Diamond (which
includes Crawley, Horsham and Mid-Sussex as well as the Surrey districts of Epsom & Ewell, Reigate and
Banstead, Mole Valley and Tandridge) and assesses the period from 2011 to 2031.
Both documents provide detailed analyses of alternative scenarios for economic development around Gatwick
Airport, considering the implications for planning policy of potential changes in business and employment
structure, housing, employment space and land use. Significantly, although both reports consider the effect of
growth at Gatwick Airport, neither report considers a scenario in which Gatwick Airport would have a second
runway.
Table 16 summarises the overall levels of employment growth and B class space requirement25 and land
requirement for each local authority arising from the different scenarios examined in the most recent, North
West Sussex Economic Growth Assessment. Under the 2013 baseline scenario, employment is projected to
increase by 35,700 between 2011 and 2031. Just under half (46%) of this growth (equivalent to around 16,500
jobs) is expected to arise in Crawley with almost 10,500 jobs in Mid Sussex and nearly 8,900 jobs in Horsham.
The various alternative scenarios generate higher overall levels of employment growth than is implied by the
baseline scenario.
Urban Land Institute and EY, Infrastructure 2014: Shaping the Competitive City,
http://www.ey.com/Publication/vwLUAssets/EY_-_Infrastructure_2014:_shaping_the_competitive_city/$FILE/EYinfrastructure-2014-shaping-the-competitive-city.pdf
25 B class space includes B1 Business (offices, research & development, light industry), B2 General Industrial and B8 Storage
or Distribution (wholesale warehouses, distribution centres).
24
Airports Commission
PwC 49
3. Local Economy: Literature Review
The analysis suggests that, in total, up to 48,000 jobs could be accommodated and supported across Northern
West Sussex. This is equivalent to an increase of 35% over the baseline scenario and is contingent on relatively
significant policy interventions and provision of new employment land.
Table 16: Headline scenario outputs by local authority (2011-2031)
Scenario
Baseline Job
Growth
Northern
West Sussex
Mid Sussex
35,755
16,440
8,890
10,425
Jobs per year
1,785
820
445
520
714,560
387,540
178,770
148,250
144.2
77.2
36.3
30.7
Total employment
46,275
20,130
12,720
13,425
Jobs per year
2,320
1,010
640
670
896,010
435,300
218,630
242,080
183.8
87.6
43.4
52.8
48,000
22,440
15,135
2,400
1,120
760
828,320
440,330
239,740
193.4
110.1
52.6
Gross land requirement
(ha)
Gross floorspace
requirement (m2)
Gross land requirement
(ha)
Potential Sites
Capacity Potential
Horsham
Total employment
Gross floorspace
requirement (m2)
Higher Growth
Crawley
Total employment
Jobs per year
Gross floorspace
requirement (m2)
Gross land requirement
(ha)
Not modelled:
as per baseline
Source: NLP analysis *Note: totals rounded
Airports Commission
PwC 50
3. Local Economy: Literature Review
Appendix A. - London Heathrow
A.1. Introduction
In this Appendix we summarise the evidence we have collected in relation to London Heathrow airport. We
provide background information about the development of the airport since 2000. This includes route,
passenger and airline data alongside a timeline of infrastructure developments. We then summarise the
available evidence in terms of local business and services, employment, labour supply and housing. The case
study has drawn heavily on data published in 2011 by Optimal Economics, by far the most comprensive recent
source of data, which has enabled analysis of Heathrow-related employment and GVA, as well as earnings, skill
levels and employment type.
A.2. Background
Heathrow (LHR) is the third largest airport in the world in terms of passenger numbers (after Atlanta and
Beijing) having served over 72 million passengers in 2013. Figure 32 highlights the consistently large number of
connections at Frankfurt and the growth of the networks at Charles de Gaulle and Schiphol in comparison to
that of Heathrow, which has fluctuated slightly but shows no significant growth:
Figure 32: Number of routes available at the major European hub airports (2000-2014)
Number of Routes
350
300
250
200
150
100
50
0
2000
2001
2002
2003
2004
LHR
2005
2006
CDG
2007
Year
2008
FRA
2009
2010
2011
2012
2013
2014
AMS
Source: SABRE Airport Data Intelligence
However, restricted capacity will cause airlines to focus on the most profitable routes and it has been estimated
that, by 2030, constraints at Heathrow will limit the airport to serving as few as half the destinations provided
by Charles de Gaulle (CDG), Schiphol (AMS) and Frankfurt (FRA), the other three major European hubs26. In
the past fifteen years, Heathrow’s principal infrastructure developments have been the construction of Terminal
5, which opened in spring 2008 and the modernization of Terminal 2, which is scheduled to open in 2014. The
timeline in Figure 33 highlights both these infrastructure improvements and the trend in the number of
operating airlines and passengers.
Heathrow Airport Limited (2011), A Focus on the Economy Towards a Sustainable Heathrow
http://www.heathrowairport.com/static/Heathrow/Downloads/PDF/Afocusontheeconomy.pdf
26
Airports Commission
PwC 51
3. Local Economy: Literature Review
Figure 33: Heathrow timeline
Nov 2001
Terminal 5 construction
conditionally approved (£2.5
billion and 30 million of
capacity)
Jan 2006
Succession of T5
construction strikes
Mar 2006
Plans released to close T2 in
2009 for redevelopment
(£2.2b), operations become
unsustainable
120
111
106
105
104
101
96
100
100
Jun 2014
New T2 expected to
reopen
Jun. 2011
T5C extension opened (£340m
& +3m capacity)
Sep 2008
Mayor calls for study
into Thames Estuary
Jul 2013
Airports Commission
assigned to determine
expansion options
May 2010
New Government
overturns new
runway decision
120
108
109
108
103
102
102
93
90
99.33
95.36
72.37
93.47
70.04
94.33
69.43
97.38
65.88
90.72
66.04
93.69
67.05
92.76
68.07
67.53
96.21
97.10
67.91
93.57
67.34
88.80
63.50
60.76
40
87.01
63.36
60
89.94
60
90.84
80
40
20
20
0
Passenger Load
Factor**:
100
80
64.62
Millions
Mar 2008
T5 operations begin, full
schedules by April 5th
0
2000
2001
2002
71.1%
67.6%
72.8%
2003
2004
2005
71.5%
72.0%
69.9%
Available Seats
2006
2007
2008
2009
70.2%
73.4%
71.6%
72.8%
Passenger Movements
2010
2011
2012
2013
2014
67.7%
73.6%
74.9%
75.9%
N/A
Operating Airlines
*Available departing seats multiplied by 2
** Passengers divided by available seats
Sources: Available seats and operating airlines obtained from SABRE Airport Data Intelligence
Passenger data retrieved from CAA Statistics, http://www.caa.co.uk/default.aspx?catid=80&pagetype=88&pageid=3&sglid=3
Airports Commission
PwC 52
Number of Operating Airlines
Number of Passengers or Available Seats*
Jul 2002
Government lists London
expansion options, LHR
runway is favoured
Jan 2009
Third runway plans approved by
Government
3. Local Economy: Literature Review
It is difficult to credit the variation in capacity to one or a series of events as there are a lot of factors to take into
account; simply because a new infrastructure development has been opened does not necessarily mean that
available seats on flights will increase across the whole airport. The data highlight capacity growth of almost 6
million seats in the period in which infrastructure investment was made at the airport, although some of this
capacity may be attributable to the increasing use of larger aircraft.
A.3. Employment and value added
The overall aim in increasing capacity at an airport is to be able to accommodate additional passengers.
However, a thriving airport also draws new businesses to locate either onsite or nearby (e.g. cargo, logistics,
retail, hotels, offices, car parking and light industrial space).
The passenger numbers of an airport can be directly related to the number of jobs available and the gross value
added (GVA) to the local economy in terms of the income earned from the production of goods and services in
the area.
A report carried out in 2004 for the Airports Council International (ACI) Europe regarding the social and
economic impact of airports suggested an average of 950 on-site jobs are supported by every million passengers
at airports in Europe27. This gives an indication of how important airports are economically at the local level
throughout the continent.
Between 2008 and 2009, a survey was undertaken of on-site employees at Heathrow Airport. These results
were analysed in 2011 to investigate the impact Heathrow had on employment both directly and indirectly
across the UK. The summary of the findings is shown in Table 17.
Table 17: Total employment and GVA as a result of Heathrow (2010)28
Local
London
Rest of UK
Direct on-airport
76,600
76,600
76,600
Direct off-airport
7,700
7,700
7,700
Indirect
11,100
20,800
44,400
Induced
18,600
31,500
77,200
Total employment
114,000
136,600
205,900
Direct on-airport
3.276
3.276
3.276
Direct off-airport
0.328
0.328
0.328
Indirect
0.656
1.358
2.462
Induced
1.065
2.059
3.616
Total GVA
5.304
7.021
9.680
Employment (Jobs)
GVA (£ billion)
Source: Heathrow Related Employment, Optimal Economics, 201129
In this context direct employment is considered jobs where activity is directly related to Heathrow and is based
either on- or off-site; indirect employment refers to the firms that supply the goods and services to businesses
located at the airport; and induced is employment supported by the expenditure of those employees in the
ACI Europe and York Aviation (2004), The Social and Economic Impact of Airports in Europe
https://www.ryanair.com/doc/news/2012/ACI-Report.pdf
28 Employment figures to the nearest 100. Although the direct on-site figures were from 2009 they were expected to hold for
2010.
29 Optimal Economics (2011), Heathrow Related Employment
http://www.heathrowairport.com/static/Heathrow/Downloads/PDF/Heathrow-Related-Employment-Report.pdf
27
Airports Commission
PwC 53
3. Local Economy: Literature Review
previous categories. It is also worth noting that “Local” refers to local authorities in the immediate vicinity of
Heathrow, i.e. Hillingdon, Hounslow, Spelthorne, Slough and Ealing (see Figure 33).
From the figures reported in the 2011 paper, it is evident that Heathrow exceeds the European average quoted
by the ACI in 2004 of 950 employees per million passengers; in 2009, Heathrow served c. 66 million
passengers and employed 76,600 staff on-site, giving a ratio of around 1,160 employees for every million
passengers. Bearing in mind that the European employee numbers may have changed slightly since the survey,
this still suggests that in European terms Heathrow has an above-average direct economic impact in the local
area.
The 2011 study further breaks down on-site employment by sector. Figure 34 shows the split of employees by
employment category and Figure 35 shows the split by employers. The majority of jobs come from airlines and
airline associated services although this category has a significantly lower share in terms of employers (because
these companies are much larger than other companies on-site).
It is almost expected that cargo/freight/courier services have the lowest share as Heathrow only operates an
average of 69% of the freight carried by Charles de Gaulle and Frankfurt by weight (since 2007,
FlightglobalPro). Also, since freight companies handle goods rather than passengers, as airlines do, it requires
fewer staff to deliver their services.
Of the employees surveyed at Heathrow in the study, 99% were permanent, 82% were full time and there was a
57:43 male/female split.
Figure 34: % of direct on-site employment by sector (2009)
1%
4%
4%
Airlines/Airline Handling Agents
Government Services
10%
BAA/Heathrow Airport Limited
7%
Catering & Retail
Other Public Passenger Services
8%
62%
Cargo/Freight/Courier Services
4%
Building & Maintenance Contractors
Other Companies
Source: Heathrow Related Employment, Optimal Economics, 2011
Airports Commission
PwC 54
3. Local Economy: Literature Review
Figure 35: % of direct on-site employers by sector (2009)
Airlines/Airline Handling Agents
8%
Government Services
27%
13%
BAA/Heathrow Airport Limited
Catering & Retail
5%
3%
1%
16%
Other Public Passenger Services
Cargo/Freight/Courier Services
Building & Maintenance Contractors
27%
Other Companies
Source: Heathrow Related Employment, Optimal Economics, 2011
A.4. Earnings and skills
In 2010, the ONS estimated that salaries in an area contribute to 61% of that area’s total GVA30; carrying this
assumption through to Heathrow allows us to estimate a GVA of £3.3 billion in 2009 from direct on-site
employment alone. Figure 36 highlights the distribution of salaries of on-site employees. The majority of staff
earn between £20k and 23.999k. Figure 37 shows the split of employees at Heathrow by skill level: level 1 is
considered competence associated with general education and gives hotel workers and cleaners as examples of
jobs; level 2 occupations require knowledge provided by a good general education such as machine operators,
retailing and secretarial positions; level 3 normally require post school study but not to a degree level, such as
skilled engineering roles and construction trades; and level 4 covers professional and managerial positions
which would usually require a degree or equivalent. The relevance of this pie chart is that almost 60% of the
workers are level 2 which includes air cabin crew and baggage handlers (‘Airlines/Airline Handling Agents’
employer category).
Office for National Statistics (2010), Regional, sub-regional and local gross value added 2009
http://www.ons.gov.uk/ons/rel/regional-accounts/regional-gross-value-added--income-approach-/december2010/regional--sub-regional-and-local-gross-value-added.pdf
30
Airports Commission
PwC 55
3. Local Economy: Literature Review
Figure 36: % of LHR on-site employees by salary band (2009)
45.0%
41.6%
Percentage of Staff
40.0%
35.0%
30.0%
25.0%
20.0%
18.3%
17.0%
15.0%
8.4%
10.0%
5.0%
4.6%
0.2%
4.1%
4.7%
1.1%
0.0%
Source: Heathrow Related Employment, Optimal Economics, 2011
Figure 37: % of on-site employees by skill level (2009)
Level 4, 12.4%
Level 1, 15.8%
Level 3, 12.3%
Level 2,
59.5%
Source: Heathrow Related Employment, Optimal Economics, 2011
A.5. Labour supply
Figure 38 shows that Heathrow draws its workforce from a wide geographical area. Almost 55% of direct on-site
employees live outside the five closest local authorities. This suggests that the economic impact of the direct,
on-site employment of Heathrow extends beyond the local area since those who work at Heathrow and live in
the surrounding region will spend some of their wages there, helping the induced effects locally.
Airports Commission
PwC 56
3. Local Economy: Literature Review
Figure 38: Place of residence of Heathrow workforce (2009)
No. working at
Heathrow
% of Heathrow
workforce
Hounslow
10,760
14.6
Hillingdon
8,960
12.2
Ealing
5,760
7.8
Slough
4,090
5.6
Spelthorne
3,920
5.3
Local labour area
47,660
45.5
Other areas
25,770
54.5
Total
73,430
100.0
Local area
Ealing
Slough
Hounslow
Source: Heathrow Related Employment, Optimal Economics, 2011
Direct off-airport employment was also estimated by the study and divided into the same business sectors as
the on-site analysis, but limited to the five local authorities considered in the residency of on-site employment.
The results are shown in Figure 39.
Figure 39: Direct off-site employment from LHR (2010)
300
900
2,100
100
Airlines/Airline support services
Car parks
Freight
Hotels
Other
4,400
Source: Heathrow Related Employment, Optimal Economics, 2011
In contrast to on-site employment, direct off-site employment is dominated by freight services (which
contributes 57% of the jobs). This is because freight companies tend to be based outside the perimeter of the
airport but close enough to make the transport of goods to and from the airport convenient. The total
contribution to GVA of Heathrow’s off-site businesses is estimated as £0.3 billion.
Indirect employment at Heathrow (i.e. employment resulting from the purchases of goods and services by the
companies that provide direct employment) was estimated using a survey of companies in early 2011 and
applied to the local, regional and national economy. The results can be seen in Figure 40.
Airports Commission
PwC 57
3. Local Economy: Literature Review
Figure 40: Indirect employment as a result of Heathrow (2o1o)
UK
44,400 Jobs
£2.462b GVA
London
20,800 Jobs
£1.358b GVA
Local
11,100 Jobs
£0.636b GVA
Source: Heathrow Related Employment, Optimal Economics, 2011
The study estimates the induced employment supported by the local expenditure of those whose jobs depend
both directly and indirectly on the operation of Heathrow by adopting a multiplier and applying this to the
figures obtained from direct and indirect analysis. The (assumed) multipliers depend on the size and structure
of the economy being considered and multipliers of 1.2, 1.3 and 1.6 were chosen for induced employment on the
local, regional and national economies respectively. The resulting employment estimates can be seen in Figure
41.
Figure 41: Induced employment as a result of Heathrow (2010)
UK
77,200 Jobs
£3.616b GVA
London
31,500 Jobs
£2.059b GVA
Local
18,600 Jobs
£1.065b GVA
Source: Heathrow Related Employment, Optimal Economics, 2011
A.6. Housing
Analysis of ONS data was undertaken for the London Borough of Hillingdon, in which Heathrow is located.
There are 105,089 dwellings in the Borough, the majority of which are in private ownership (82.5%), similar to
the English average (82.1%).
Airports Commission
PwC 58
3. Local Economy: Literature Review
Figure 42 shows the percentage of dwellings in the five local authorities closest to Heathrow Airport
(Hillingdon, Hounslow, Ealing, Spelthorne & Slough), London and England within each Council Tax band31:
Figure 42: % of dwellings by Council Tax band (2011)
45%
40%
35%
30%
25%
20%
15%
10%
5%
0%
A
B
Hillingdon
C
Hounslow
D
Ealing
Slough UA
E
Spelthorne
F
G
London
H
England
Source: ONS32
Rental values in the Borough are 28% lower than the Greater London median (based on a sample of 321 two
bed properties in the Borough and 16,402 in the region). These data were derived from the London Rents Map,
which shows average private sector rents for different types of homes, and is based on a sample of Valuation
Office Agency data covering the last 12 months. Figure 43 highlights the inverse relationship between rental
values and distance from central London. Hillingdon Borough is delineated in red.
Council Tax Bandings (based on 1991 valuations): Band A - up to £40,000; B - £40,001 to £52,000; C - £52,001 to
£68,000; D - £68,001 to £88,000; E - £88,001 to £120,000; F - £120,001 to £160,000; G - £160,001 to £320,000; and H £320,001 and above.
31
32
http://www.neighbourhood.statistics.gov.uk/dissemination/LeadKeyFigures.do?a=7&b=6275131&c=hillingdon&d=13&e=7
&g=6329305&i=1001x1003x1004&m=0&r=1&s=1399399207893&enc=1
Airports Commission
PwC 59
3. Local Economy: Literature Review
Figure 43: Greater London rental map for 2 bed properties (2014)
Source: http://www.london.gov.uk/rents/
The dominant types of housing clustered around Heathrow are semi-detached (36%) and terraced (23%)
houses. At 22%, the proportion of apartments in Hillingdon is much lower than London as a whole (37%).
Airports Commission
PwC 60
3. Local Economy: Literature Review
Figure 44: Housing - %of unshared dwellings (2011)
40%
35%
30%
25%
20%
15%
10%
5%
0%
Detached
Semi-Detached
Ealing
Terraced
Purpose-Built
Part of a
In Commercial
Caravan or
(Including End- Block of Flats or Converted or
Building
Other Mobile or
Terrace)
Tenement
Shared House
Temporary
(Including BedStructure
Sits)
Hillingdon
Hounslow
Slough
Spelthorne
London
Shared
Dwelling
England
Source: ONS, 201133
33
http://www.neighbourhood.statistics.gov.uk/dissemination/LeadTableView.do?a=7&b=6275131&c=hillingdon&d=13&e=7
&g=6329305&i=1001x1003x1004&m=0&r=1&s=1399444048370&enc=1&dsFamilyId=2570
Airports Commission
PwC 61
3. Local Economy: Literature Review
Appendix B. - London Gatwick
B.1. Introduction
In this Appendix we summarise the evidence we have collected in relation to London Gatwick. We provide
background information about the development of the airport since 2000. We then summarise the available
evidence in terms of local business and services, employment, labour supply and housing.
B.2. Background
The number of available seats at Gatwick Airport has fluctuated despite the lack of any significant infrastructure
developments over the last fifteen years, as shown by the red bars in Figure 45; only in recent years has Gatwick
begun to experience capacity constraints. The largest effects have been the result of industry wide changes (i.e.
the global financial crisis of 2008 along with the Open Skies agreement between the UK and the USA in the
same year halted Gatwick’s earlier growth, although there has been a marked shift to low cost carriers). Before
the Open Skies Agreement airlines were restricted in where they could operate their transatlantic flights, but
the agreement removed these restrictions, allowing more carriers to operate from Heathrow. As a result, a lot of
airlines opted to leave Gatwick (also evident in ‘Operating Airlines’ line graph in Figure 40) and hence reduce
the number of seats available on flights to/from LGW.
Major events at LGW are highlighted in the timeline below; investments in recent years have focused on
improving facilities rather than building to accommodate additional capacity. Gatwick is currently the world’s
largest single-runway airport in terms of passenger numbers. The scope for expanding capacity depends on the
development of a new runway; increasing the terminal capacity cannot be justified if the runway capacity
(number of flights) cannot be increased to utilise it.
Passenger movements at Gatwick have fluctuated almost periodically over time (pink bars in Figure 40) and
reached an all-time high in 2013 with 35.4 million passengers served. It is likely that available seats data
provided in Figure 45 may be less than passengers served because the data source does not include charter
flights which were common at Gatwick in the early 2000s, before low-cost carriers (LCCs) began to dominate
the aviation industry.
Despite handling considerably fewer passengers than Heathrow (circa 50%), Gatwick currently offers more
routes than all other London airports (see Figure 46). Since 2007 Gatwick has served more destinations than
Heathrow, although more recently LHR has closed the gap. This lead in destinations served is partly because of
the Open Skies Agreement which led to Gatwick introducing more short-haul flights as longer haul flights
moved to Heathrow.
Airports Commission
PwC 62
3. Local Economy: Literature Review
Figure 45: Gatwick timeline
2000
£29.5 million extension to South
Terminal International Departure
Lounge offering more seating,
shops and restaurants
May 2013
South Terminal Pier 1 closed
for demolition; new 5-gate
pier to be built by 2015
87
90
81
81
40
74
77
76
68
66
60
58
30
80
74
63
66
70
37.29
35.44
36.23
34.24
38.35
33.67
38.46
31.38
35.17
32.39
38.97
34.21
38.68
35.22
32.73
34.16
31.25
32.78
27.59
31.47
24.96
30.01
10
24.52
29.63
28.72
31.18
20
39.84
47
25
15
60
54
50
40
30
20
5
Number of Operating Airlines
35
Jul 2013
Options for second
runway revisited by
Airports Commission
Nov 2008
LGW sold to Global
Infrastructure
Partners Consortium
May 2005
World’s first air-passenger bridge
to span a live taxiway opened
connecting North Terminal to 11
new pier-serving stands
45
28.15
32.07
Millions
2001
£35 million extension to North
Terminal Departure Lounge
similar to that which opened in
South Terminal in 2000
Number of Passengers or Available Seats*
Jun 2010
New ownership promises £11m
face-lift for LGW
Feb 2003
Gatwick extension options
released; possible 2 new
runways => up to 115m capacity
from 40m
10
0
0
2000
2001
2002
2003 2004
2005 2006
2007 2008
Available Seats
Passenger Movements
2009
2010 2011
2012
Operating Airlines
2013
2014
NOTE: Available seats (using SABRE data) does not include charter flights, hence passenger numbers appear to be greater than the number of available seats pre-2007, before the rise of
low-cost carriers,
*Available departing seats multiplied by 2
Sources: Available seats and operating airlines obtained from SABRE Airport Data Intelligence
Passenger data retrieved from CAA Statistics, http://www.caa.co.uk/default.aspx?catid=80&pagetype=88&pageid=3&sglid=3
Airports Commission
PwC 63
3. Local Economy: Literature Review
Figure 46: Number of routes available at London airports (2000-2014)
300
Number of Routes
250
200
150
100
50
0
LHR
LGW
STN
LCY
LTN
Source: SABRE Airport Data Intelligence
B.3. Labour demand
A study of employment linked to Gatwick airport by Berkeley Hanover Consulting Limited34 (BHC) in 2011
estimated that over 33,000 jobs were supported by the airport’s operations (based on 2009 statistics) (see
Figure 47). These jobs constitute those directly dependent on Gatwick (both on- and off-site), indirect jobs that
result from businesses that supply goods and services to the airport and induced employment that comes from
spending by employees in both categories in the local area35.
Between 1997 and 2008, the ratio of indirect to direct jobs at Gatwick airport fell from 54 off airport jobs for
every 100 on-site jobs in 1997 to 46 off-airport jobs in 2008. The BHC explains this change in terms of the rapid
development of LCCs at Gatwick which is seen as having adversely affected local hotels, cargo companies,
caterers and car parking services. The report also argues that LCCs “tend to offer lower wages to their staff and
negotiate tougher terms with support facilities than the national carriers” which may also have reduced the
impact on value added.
BHC (2011), Gatwick Airport Employment Generation to 2020 in the Context of the Local Labour Market
Note that the BHC study only considers local effects whereas the Optimal Economics report referenced in the Heathrow
case study also looks at the wider effect on London and the UK.
34
35
Airports Commission
PwC 64
3. Local Economy: Literature Review
Figure 47: Estimated Gatwick related employment (1997 and 2008)
45,000
39,417
No. of Employees
40,000
35,000
7,940
30,000
1,720
4,160
25,000
33,211
6,400
1,900
2,200
20,000
15,000
25,597
22,711
10,000
5,000
0
1997
2008
Year
On-Airport
Off-Airport
Indirect
Induced
Source: BHC
Figure 48 shows the number of passengers served (in millions), the number of on-airport jobs (in thousands)
and the ratio between the two for the years 1992, 1997, 2003 and 2008. This ratio, the number of employees per
million passengers, can be compared with the average for European airports as a whole in 2003 of 950 on-site
jobs per million passengers36.
Figure 48: Employment at London Gatwick (1992-2008)
1200
990
35
951
1000
823
30
600
34.2
400
22.7
24.6
29.9
25.5
19.6
19.8
15
26.8
20
10
800
664
25
200
5
0
Jobs per Million Passengers
Passengers (millions) or Jobs
(thousands)
40
0
1992
1997
2003
2008
Year
PAX (millions)
On-Airport Jobs (000s)
Employment per million passengers
Source: BHC
36
The Social and Economic Impact of Airports in Europe, York Aviation, 2004
Airports Commission
PwC 65
3. Local Economy: Literature Review
B.4. Labour supply
One measure of how far the local economy depends on an airport is the analysis of the percentage of locally
economically active persons that are employed there. Figure 49 highlights that the local borough of Crawley is
highly dependent on Gatwick in terms of employment: 13.7% of working people in the area worked at the
airport in 2008, a small increase from 13.4% in 1997. Crawley is the only local authority that has maintained its
dependence on LGW over the 11-year period between surveys.
14%
13.7%
16%
13.4%
12%
0.5%
0.4%
1.0%
1.6%
2%
4.6%
2.9%
4%
3.0%
6%
4.0%
8%
2.7%
10%
4.5%
% of Locally Economically Active
that Work at LGW
Figure 49: % of locally economically active persons that work at LGW by local authority (2009)
0%
1997
2008
Source: BHC
B.5. Housing
Figure 50 highlights the proportion of dwellings in Crawley, Horsham and Mid Sussex, the South East and
England that are within each Council Tax band37.
Council Tax Bandings (based on 1991 valuations): Band A - up to £40,000; B - £40,001 to £52,000; C - £52,001 to
£68,000; D - £68,001 to £88,000; E - £88,001 to £120,000; F - £120,001 to £160,000; G - £160,001 to £320,000; and H £320,001 and above.
37
Airports Commission
PwC 66
3. Local Economy: Literature Review
Figure 50: % of dwellings by Council Tax band (2011)
60%
50%
40%
30%
20%
10%
0%
A
B
C
Crawley
Horsham
D
Mid Sussex
E
F
South East
G
H
England
Source: ONS38
In terms of the housing supply around Gatwick, Figure 51 highlights that the dominant house type is terraced
houses or bungalows (42% compared to the 23% in the South East and 26% in England). The proportion of
purpose built apartments is also higher than average across England at 22%.
Figure 51: Housing - % of unshared dwellings (2011)
45%
40%
35%
30%
25%
20%
15%
10%
5%
0%
Detached
Semi-Detached
Terraced
Purpose-Built
Part of a
In Commercial
Caravan or
(Including End- Block of Flats or Converted or
Building
Other Mobile or
Terrace)
Tenement
Shared House
Temporary
(Including BedStructure
Sits)
Crawley
Horsham
Mid Sussex
South East
Shared
Dwelling
England
Source: ONS
38
http://www.neighbourhood.statistics.gov.uk
Airports Commission
PwC 67
3. Local Economy: Literature Review
Appendix C. - Manchester
C.1. Introduction
In this Appendix we summarise the evidence we have collected in relation to Manchester airport. First, we
provide background information about the development of the airport since 2000. We then summarise the
available evidence in terms of local impact on business and services and employment.
C.2. Background
Manchester Airport is the third largest airport in the United Kingdom in terms of passenger numbers, serving
over 20 million passengers in 201339.
The timeline in Figure 52 highlights the major infrastructure developments at Manchester Airport in the last 15
years, as well as trends in passenger movements, available seats, operating airlines and available routes. It
suggests that passenger numbers and movements increased following the opening of Manchester Airport’s
second runway in March 2001. Subsequently, in line with the global trend, passenger numbers at Manchester
Airport declined following the financial crisis in 2008; however, the data suggest signs of recovery. In 2013
Manchester served over 20 million passengers for the first time since 2008.
C.3. Employment and value added
York Aviation assessed the economic impact of Manchester Airport in 2008 focusing on two main metrics: the
number of employees in terms of full-time equivalents (FTEs) and gross value added (GVA). Like other reports
reviewed in these case studies, the impacts are split into direct on-airport, direct off-airport, indirect and
induced. The estimates are shown in Table 18.
Table 18: Total employment and GVA as a result of Manchester Airport in 200740
Greater
Manchester
Cheshire
Elsewhere in North
West41
Total
Direct on-airport
16,520
-
-
16,520
Direct off-airport
2,110
700
-
2,810
Indirect
10,150
2,310
460
12,920
Induced
7,100
1,620
320
9,040
35,880
4,630
780
41,290
Direct on-airport
320
73
15
408
Direct off-airport
54
12
2
69
Indirect
243
55
11
310
Induced
170
39
8
217
Total GVA
788
179
36
1,004
Employment (FTEs)
Total employment
GVA (£ million)
Source: Economic Impact of MAG Airports: Update Report, York Aviation,
200842
CAA Statistics http://www.caa.co.uk/docs/80/airport_data/2013Annual/Table_10_3_Terminal_Pax_2003_2013.pdf
Employment figures are rounded to the nearest 10 and GVA is rounded to the nearest £1 million
41 The York Aviation report estimates direct GVA elsewhere in the North West despite there being no direct employment.
42 York Aviation (2008), Economic Impact of MAG Airports: Update Report
http://www.manchester.gov.uk/download/downloads/id/15427/economic_impact_of_the_mag_airports_update_report
39
40
Airports Commission
PwC 68
3. Local Economy: Literature Review
Figure 52: Manchester Airport timeline
Mar 2004
MAG secure a £325m loan
from bank to be invested in
their airports; plans to expand
MAN terminal
Feb 2001
Second runway opens at MAN
Also, MAG acquire East Midlands
and Bournemouth Airport
Jan 2013
MAG acquire Stansted for
£1.5bn
2011
‘Airport City’ plans announced:
hotels, offices, factories, car
parks, world logistics hub =>
£100m investment from MAG
Apr 2005
MAG announce capital investment
plan at MAN; terminal
refurbishments and expansions,
increased car parking and larger
apron
25
250
198
20
200
184
170
150
70
21.45
77
21.39
20.75
83
20.36
19.74
2002
78
161
19.17
18.89
2001
79
63
66
62
60
58
2010
2011
2012
2013
2014
17.26
17.76
2000
74
18.58
18.72
63
65
5
93
157
134
22.91
21.22
14.70
19.70
61
65
90
20.08
22.42
14.11
18.81
98
15.17
19.31
10
16.61
21.25
116
103
137
20.30
22.40
128
161
146
23.89
22.11
15
14.71
18.57
Millions
Feb 2006
‘Reshuffle’ of MAN
management structure
0
100
Number of Operating Airlines
Number of Passengers or Available Seats*
2005
£5.5m retail upgrade of T1
completed
Jul 2009
Terminal 1 (£50m) and 2 (£11m)
refurbishment completed; new
security, catering and retail
facilities
50
0
2003
Available Seats
2004
2005
2006
2007
Passenger Movements
2008
2009
Operating Airlines
Routes Available
NOTE: Available seats (SABRE) does not count for charter flights, hence why pre-2007, before the rise of low-cost carriers, passenger numbers appear to be greater than the number of
available seats
*Available departing seats multiplied by 2
Sources: Available seats, operating airlines and routes available obtained from SABRE Airport Data Intelligence
Passenger data retrieved from CAA Statistics, http://www.caa.co.uk/default.aspx?catid=80&pagetype=88&pageid=3&sglid=3
Airports Commission
PwC 69
3. Local Economy: Literature Review
The focus is on the impacts in the surrounding area (i.e. Greater Manchester, Cheshire and the rest of the North
West), rather than the national level. The estimates are based on the results of a survey at Manchester Airport
in 2005/06 which have then been extrapolated to provide the results shown above by assuming that:
Productivity growth on-site is 1.8% per annum (the historical growth rate between 1997 and 2005, and
the lower band of growth found at large European airports43); and
A growth rate of 2% per annum for the economy in the North West of England based on Cambridge
Econometrics’ regional forecasts from the time.
In 2007, services and employment at Manchester Airport were at their peak. The available seats and routes
supported over 41,000 jobs and contributed over £1 billion in GVA to the regional economy in the North West
(see Table 18). York Aviation also forecast Manchester Airport’s future impact on the economy based on the
‘high’ and ‘low’ growth passenger forecasts taken from its Master Plan44. These forecasts were generated before
the financial crisis and assume a consistent growth rate: in the ‘high’ growth case, 38 million passengers are
estimated by 2015 compared with 17 million in 2013. The passenger forecasts were then used to project the
economic impact of Manchester Airport in 2015 and subsequently 2030. The forecast employment (in FTEs) is
shown in Figure 53 and the corresponding GVA in Figure 54.
ACI Europe and York Aviation (2004), The Social and Economic Impact of Airports in Europe
https://www.ryanair.com/doc/news/2012/ACI-Report.pdf
44 Manchester Airport Master Plan
http://www.manchesterairport.co.uk/manweb.nsf/alldocs/10F56C819A51454E8025739300388C1D/$File/Masterplan.pdf
43
Airports Commission
PwC 70
3. Local Economy: Literature Review
Low growth case
High growth case
Greater Manchester Employment Forecast
- Low Growth Case
Greater Manchester Employment Forecast
- High Growth Case
80000
80000
60000
40000
20000
51560
53850
10120
14470
3050
23920
10160
14530
3300
25860
0
2015
Direct On-site
2030
Direct Off-site
Indirect
Employees [FTEs]
Employees [FTEs]
Greater Manchester
Figure 53: Employment forecasts for Manchester Airport (2015 and 2030)
Induced
60000
40000
20000
Direct On-site
6720
2300
2310
3290
3310
1020
1100
2015
2030
4000
2000
0
Indirect
1000
1120
1120
460
460
660
660
2015
2030
500
0
Indirect
2015
2030
27950
Direct Off-site
Indirect
Induced
6850
7260
6000
2390
2500
3410
3570
4000
2000
0
Induced
1050
1190
2015
2030
Direct Off-site
Indirect
Induced
Elsewhere in North West Employment
Forecast - High Growth Case
Employees [FTEs]
1500
10990
15700
3560
8000
Elsewhere in North West Employment
Forecast - Low Growth Case
Employees [FTEs]
Elsewhere in North West
Direct Off-site
10490
14990
3160
24780
Cheshire Employment Forecast - High
Growth Case
Employees [FTEs]
Employees [FTEs]
Cheshire
6000
6610
58200
0
Cheshire Employment Forecast - Low
Growth Case
8000
53420
1500
1160
1210
1000
480
500
680
710
2015
2030
500
Induced
0
Indirect
Induced
Source: Economic Impact of MAG Airports: Update Report, York Aviation, 2008
The forecasts continue the trend seen in the 2007 estimates. The effect of the Airport diminishes with distance
from the airport. The ratios between direct, indirect and induced employment are consistent across the
different areas. Perhaps the most significant result is the difference between the low and high growth cases;
high growth is predicted to contribute 4,350, 540 and 100 more jobs in Greater Manchester, Cheshire and the
North West respectively by 2030 than the low growth case. Comparing the GVA forecasts individually in Figure
54 shows similar trends and ratios to those seen in Figure 53. Once again, the comparisons between the low and
high growth scenarios show significant differences in the impact on GVA.
Airports Commission
PwC 71
3. Local Economy: Literature Review
Low growth case
High growth case
Greater Manchester GVA - Low Growth
Case
Greater Manchester GVA - High Growth
Case
2000
1500
1000
500
0
Direct On-site
2500
1779
1316
384
284
406
91
535
549
123
2015
2030
Direct Off-site
723
GVA [£ million]
2500
GVA [£ million]
Greater Manchester
Figure 54: GVA forecasts for Manchester Airport (2015 and 2030)45
Indirect
Induced
300
65
92
21
122
200
100
1000
500
602
135
2015
2030
792
Direct Off-site
87
125
28
165
Indirect
Induced
444
400
315
96
300
68
97
22
128
137
31
2015
2030
200
100
180
0
2015
Direct On-site
Direct Off-site
2030
Indirect
Induced
Direct On-site
Elsewhere in North West GVA - Low
Growth Case
100
80
60
40
20
17
13
18
4
24
25
6
33
80
63
19
60
14
19
4
26
27
6
2015
2030
40
20
0
Induced
36
0
2015
Direct On-site
Indirect
88
100
81
59
Direct Off-site
Elsewhere in North West GVA - High
Growth Case
GVA [£ million]
GVA [£ million]
298
427
95
562
500
0
Elsewhere in North West
421
Cheshire Employment GVA - High Growth
Case
GVA [£ million]
GVA [£ million]
Cheshire
300
1382
1500
Direct On-site
405
400
1950
0
Cheshire Employment GVA - Low Growth
Case
500
2000
Direct Off-site
2030
Indirect
Induced
Direct On-site
Direct Off-site
Indirect
Induced
Source: Economic Impact of MAG Airports: Update Report, York Aviation, 2008
Forecasts are based on low-growth (left hand plots) and high-growth (right hand plots) by direct, indirect and induced
full-time equivalents in the Greater Manchester, Cheshire and North West regions
45
Airports Commission
PwC 72
3. Local Economy: Literature Review
Appendix D. - New York
D.1. Introduction
In this Appendix we summarise the evidence we have collected in relation to the New York airport system. We
start by providing background information about the development of the airport system since 2000. We then
summarise the available evidence in terms of local business and services, employment, labour supply and
housing.
D.2. Background
New York has one of the world’s premier transport systems with two of the world’s 50 busiest airports in terms
of passenger traffic. Taken together, the three main commercial airports in the region served over 112 million
passengers in 2013. Figure 50 shows the historical passenger numbers at John F. Kennedy Airport (JFK),
Newark Liberty International Airport (EWR) and LaGuardia Airport (LGA). JFK has grown to dominate in
terms of passengers served, despite EWR having served more annual passengers prior to 2002.
25.71
26.72
2011
35.02
49.29
2010
34.01
47.68
33.71
24.12
2009
23.98
2008
33.11
46.51
22.14
33.42
23.08
35.37
45.92
47.81
24.99
2005
47.72
2004
36.37
2003
25.81
2002
40.88
33.08
25.89
31.73
29.43
22.48
2001
37.52
31.89
24.44
29.94
29.22
21.99
30
29.35
31.10
22.52
40
32.83
34.19
25.36
Passengers (million)
50
42.63
35.76
60
50.42
Figure 55: Passenger traffic at major airports in New York (2000-2013)
2012
2013
20
10
0
2000
JFK
2006 2007
Year
EWR
LGA
Source: Port Authority of New York and New Jersey46
LaGuardia Airport mainly serves domestic flights, allowing JFK and Newark to operate international and longhaul routes. This approach was devised to allow New York to become a connection point across the Atlantic.
A lot of discussion relating to airport development in London uses New York as an example of how a major city
can have more than one large airport; however, the main difference between London and New York is that New
York has three national network airlines – Delta and American Airlines are based in JFK and United Airlines
operates from Newark – whereas London only has one, British Airways. For this reason, aviation in New York is
able to function under a two-hub system and why it may be more difficult for London to do the same. A report
by Heathrow Airport Limited in 2012, ‘One hub or none: The case for a single UK hub airport’, suggests that
New York’s two large hub airports result in poorer connectivity than one would expect (see Box). Despite New
46
www.panynj.gov
Airports Commission
PwC 73
3. Local Economy: Literature Review
York being four times the size of Atlanta and Frankfurt, it has direct access to fewer short haul flights than
Atlanta and fewer long haul flights than Frankfurt.47
Box 7: Comparison of connections at New York, Atlanta and Frankfurt
Source: One hub or none: The case for a single UK
hub airport, Heathrow Airport Limited, 2012
Many of the airports controlled by the Port Authority of New York and New Jersey (PANYNJ) make the
management and maintenance of their terminals the responsibility of the main airlines which operate from
them. For example, Terminal 2 at JFK is exclusively used and operated by Delta Airlines which also operates
from Terminal 4. Delta has a $1.4 billion development plan for Terminal 4, despite the fact that it also used by
other international airlines including Singapore Airlines, Emirates, Etihad and KLM. Terminals 5, 7 and 8 at
JFK are operated by JetBlue, British Airways and American Airlines respectively. Similarly, at Newark,
Terminals A and C are operated by United Airlines and at LaGuardia Terminals C, D and most of A are under
the control of Delta Airlines. This type of airport operating model results in ongoing infrastructure
developments at these airports, and JFK in particular. Having separate terminals maintained and managed by
different airlines encourages airlines to compete with each other to provide the best passenger experience. As a
result, construction is continuous at the PANYNJ airports, as can be seen from the timeline for the three
airports (see Figure 57). In the figure, available seats on flights and the number of operating airlines have been
plotted in sequence with the timeline to see how these indicators were affected by infrastructure developments;
note how at the turn of the century JFK utilised 10 terminals and now only operates 6, despite an increase in the
scale of operations. This is a result of large expansions and developments of the terminals over the years and
the desire to expand even further by demolishing old terminals to make way for newer, modern facilities.
All three New York airports suffered a substantial impact to their operations following the 9/11 attacks in 2001,
with significant decrease in available seats and operating airlines. Whilst Newark and LaGuardia have yet to
return to the same level of operations that they experienced prior to the attacks (although they have surpassed
the annual passenger figures), JFK has gained. It is now the busiest airport in PANYNJ’s portfolio. One between
JFK and the other two airports is the volume of developments that has taken place; since 2003, a new phase in
development or part of an expansion has opened at JFK almost every year. This emphasises the airports plan
for growth and ultimately allows room for that growth to occur. Another difference is that JFK serves three
times as many airlines as LaGuardia and twice as many as Newark.
D.3. Economic impact
These large scale operations of the three airports have a major contribution to the local economy of the New
York and New Jersey area. This is summarised in Table 19.
Heathrow Airport Limited (2012), One hub or none: The case for a single UK hub airport
http://mediacentre.heathrowairport.com/ImageLibrary/downloadmedia.ashx?MediaDetailsID=1105&SizeId=-1
47
Airports Commission
PwC 74
3. Local Economy: Literature Review
A study of the economic effects of aviation in New York was carried out by PANYNJ in 2005. Its findings are
summarised in terms of the jobs, wages and sales that were supported by operations at the airports,
investments in the airports and tourism that resulted from people visiting the area via the airports. Whilst jobs
are equivalent to employment as an impact metric (and thus similar to the other case studies), wages represent
only a component of GVA and sales do not take into account the cost of sales (and thus will overstate the value
added by the airports).
Table 19 incorporates all three of the PANYNJ case study airports together. Operations and tourism have the
biggest economic impact on the region, but investments are the focus of the study. Table 20 shows the
breakdown of the investment figures by airport both directly and as a whole. These demonstrate that together
the three airports contribute nearly half a million jobs to the local economic area; this is substantially larger
than comparative studies for other airports. This primarily occurs because the study covers an entire airport
system, rather than an individual airport, and therefore captures the impact of a larger number of passengers
(94 mppa) and cargo. In addition, the study area considered is very large, with a resident population of 19.7
million people. As discussed in Chapter 3, this will limit the amount of leakage from the local economy studied,
and therefore increase the magnitude of the indirect and induced multipliers.
Table 19: Economic impact of aviation in New York City in terms of operations, investments and
tourism from JFK, EWR and LGA (2004)
Impact
Operations
Investments
Tourism
Total
278,890
14,500
192,280
485,670
Wages ($ billion)
13.1
0.724
6.6
20.5
Sales ($ billion)
37.1
2.4
17.6
Jobs
Source: The Economic Impact of the Aviation Industry on the New York – New Jersey Metropolitan Region, PANYNJ,
57
2005 48
PANYNJ has analysed the economic impacts of the airports relative to the number of air passengers (per
million) as shown in .
Figure 56.
Figure 56: Economic impact per million passengers (connecting and non-connecting) (2004)
2,150
Jobs
$85
million in
Wages
Air
Passengers
(per million
passengers)
$260
million in
Sales
Source: The Economic Impact of the Aviation Industry on the New York – New Jersey Metropolitan Region, PANYNJ, 2005
48PANYNJ
(2005), The Economic Impact of the Aviation Industry in the New York – New Jersey Metropolitan Region
http://www.panynj.gov/about/pdf/reg-in-aviation-economic-impact.pdf
Airports Commission
PwC 75
3. Local Economy: Literature Review
Figure 57: New York airports timeline
2000 EWR
Two parallel runways
extended to 10km and
11km
2008 JFK
BA announce ground facility
enhancement plans in T7
2003 JFK
Terminal expansion
completed by British
Airways
Dec 2004 LGA
Terminal A’s
reconstruction
completed
($7 million)
Aug 2007 JFK
T8 official opening
2008 JFK
Terminal 5
opened
(Terminal 5i
scheduled to
open in 2015)
2006 JFK
Terminal 6
expansion
70
90
60
78
79
80
76
83
2011 LGA
New air traffic
2012 EWR
control tower
becomes $350m investment in
operational TB – construction
ongoing
2008 EWR
Terminal B is
developed to
increase
capacity
Jun 2010 JFK
Largest runway
(4,423m) re-opens
after 4 months of
resurfacing and
widening
2011 JFK
Terminal 6
closes for
demolition
May 2013 JFK
T3 closed for demolition;
T2 Phase I completed
2013 LGA
Connection
walkway
between TC
and TD opened
100
91
85
2014 JFK
Only 6
terminals
operating at
JFK
84
83
85
89
87
90
83
77
80
50
70
52
40
56
53
51
45
30
36
44
45
44
46
29
31
60
51
48
50
43
41
44
35
30
27
20
26
50
40
29
30
30
30
29
29
25
28
30
50.91
53.10
43.31
43.65
44.98
37.02
44.88
44.20
37.09
49.96
46.19
38.38
53.29
46.09
38.81
56.41
47.68
37.83
62.83
48.00
37.17
63.10
47.36
35.66
61.52
45.23
33.53
59.38
50.69
33.69
61.47
48.45
34.52
61.53
44.16
36.73
62.49
44.27
37.49
64.24
49.92
37.54
10
51.29
54.10
43.02
20
2000
2001
2002
2003
2004
2005
2006
2007
2008
2009
2010
2011
2012
2013
2014
0
Number of Operating Airlines
Number of Available Seats*
Millions
1990s-2000s LGA
2002 EWR
$340 million
New modern control
improvement
tower is constructed
scheme for Terminal
2003 EWR
1998 JFK
B
Terminal C’s rebuild
T1 opened; JFK
and expansion is
utilizes 10 terminals
completed
until the late 1990s
2005 JFK
First stages of
Terminal 8 opening
2013 JFK
T4 Phase II expansion
agreed; T2to be closed on
completion in 2015
10
0
JFK Available Seats
EWR Available Seats
LGA Available Seats
JFK Operating Airlines
EWR Operating Airlines
LGA Operating Airlines
*Available departing seats multiplied by 2
Sources: Available seats and operating airlines obtained from SABRE Airport Data Intelligence
Airports Commission
PwC 76
3. Local Economy: Literature Review
Table 20: Direct and total economic impact of all investments in airport infrastructure
regionally in New York (2000-2004)
EWR
JFK
LGA
Total
Direct impact
Jobs
1,920
3,650
260
5,830
Wages ($ million)
108
213
14
335
Sales ($ million)
499
914
69
1,482
Total impact
Jobs
4,850
8,970
680
14,500
Wages ($ million)
240
451
33
724
Sales ($ million)
803
1,435
114
2,352
Source: The Economic Impact of the Aviation Industry on the New York – New Jersey Metropolitan Region, PANYNJ, 2005
As a result of ongoing infrastructure investment, JFK had a much larger economic effect than EWR and LGA;
EWR contributed over 50% of the jobs, wages and sales that JFK supported between 2000 and 2004, and LGA
contributed circa 7%. The study expressed the impact of each $100 million of capital investment (see Figure
58).
Figure 58: Economic impact per $100 million in capital spending (2000-2004)
980
Total
Jobs
$159
million
in Total
Sales
Investment
(per $100
million in
capital)
$49
million
in Total
Wages
Source: The Economic Impact of the Aviation Industry on the New York – New Jersey Metropolitan Region, PANYNJ, 2005
If this ratio has been maintained, this would imply that the $1.4 billion expansion programme for Terminal 4 at
JFK (the first phase of which was completed in May 2013) will support 13,720 jobs, $0.7 billion in wages and
over $2.2 billion in sales. It is evident that large infrastructure projects such as these have the potential for a
significant impact on the local economy. This is before the developments are completed and the impacts of their
operations are included. As Table 19 illustrates, these were many times larger between 2000 and 2004.
Table 21 provides a breakdown of the direct economic impact of EWR, JFK and LGA across different business
sectors in 2004. It splits them into on-airport and off-airport impacts. On-airport operations have a larger
impact. JFK contributes half of the combined impacts of the three airports (i.e. JFK alone supports roughly the
same number of jobs and the same wages and sales as EWR and LGA combined).
Airports Commission
PwC 77
3. Local Economy: Literature Review
Table 21: Direct impact of the aviation industry by airport by employment category (2004)
Impact
EWR
JFK
LGA
Jobs
Wages
($m)
Sales
($m)
Jobs
Wages
($m)
Sales
($m)
Jobs
Wages
($m)
Sales
($m)
Airlines
15,960
926
3,942
19,140
1,080
4,515
7,410
403
1,644
Tenants &
Government
13,850
638
2,080
19,970
924
2,858
5,510
269
863
Sub-total
29,810
$1,564
$6,022
39,110
$2,004
$7,373
12,920
$672
$2,507
Landside Access
3,710
156
461
4,280
176
513
3,230
131
403
Air Ticket Agencies
3,440
155
260
4,050
183
306
2,640
119
199
Truck
Transportation
1,580
68
200
2,710
116
342
50
2
6
580
44
196
740
56
252
360
27
121
Brokerage &
Distribution
7,020
430
923
15,580
961
2,091
130
8
15
Airline Marketing
& Government
2,000
126
356
2,930
169
416
1,010
64
188
Sub-total
18,330
$979
$2,396
30,290
$1,661
$3,920
7,420
$351
$932
Total
48,140
$2,543
$8,418
69,400
$3,665
$11,293
20,340
$1,023
$3,439
35%
35%
36%
50%
51%
49%
15%
14%
15%
On-airport
Off-airport
Banking &
Insurance
% of Industry
Source: The Economic Impact of the Aviation Industry on the New York – New Jersey Metropolitan Region, PANYNJ, 2005
Table 22: Total impact of the aviation industry by employment category (2004)
Impact
Jobs
Number
Wages
Sales
%
($m)
%
($m)
%
On-airport
Airlines
96,360
57%
4,628
59%
14,108
61%
Tenants &
Government
72,850
43%
3,174
41%
9,057
39%
Sub-total
169,210
$7,792
$23,165
Off-airport
Landside Access
21,930
20%
940
18%
2,640
19%
Air Ticket
Agencies
18,280
17%
821
15%
1,721
12%
Truck
Transportation
8,860
8%
392
7%
1,114
8%
Banking &
Insurance
5,200
5%
302
6%
1,007
7%
Brokerage &
Distribution
42,330
39%
2,196
41%
5,661
41%
Airline
Marketing &
Government
13,080
12%
671
13%
1,788
13%
Sub-total
109,680
$5,322
$13,931
Total
278,890
$13,114
$37,096
Source: The Economic Impact of the Aviation Industry on the New York – New Jersey Metropolitan Region, PANYNJ, 2005
Airports Commission
PwC 78
3. Local Economy: Literature Review
Figure 59: Indirect jobs resulting from the aviation industry in New York by sector (2004)
All Other Industries
10%
Real Estate
4%
Manufacturing
4%
Wholesale Trade
5%
Business Services
34%
Health Care
Services
10%
Retail Trade
16%
Restaurants &
Food Services
17%
Total:
140,990 Jobs
Source: The Economic Impact of the Aviation Industry on the New York – New Jersey Metropolitan Region, PANYNJ, 2005
Figure 59 shows the types of jobs are generated (i.e. the main industries that benefit from aviation in New York)
are business services, restaurant & food services and retail trade.
D.4. Tourism
Table 23 shows more recent estimates of the direct and indirect economic impacts of JFK and LaGuardia
airports. Both sets of estimates are significantly larger than those provided earlier by PANYNJ – in part this is
because the PANYNJ estimates do not take into account all off-site employment, for example freight.
Table 23: Economic impact of JFK and LaGuardia airports (2009)
JFK International
Direct
Indirect
Total
Employment
132,610
92,011
224,621
Income ($m)
$6,127
$4,756
$10,883
Output ($m)
$19,344
$10,970
$30,314
State and Local Taxes ($m)
$2,852
LaGuardia
Direct
Indirect
Total
Employment
55,142
39,225
94,367
Income ($m)
$2,200
$2,078
$4,278
Output ($m)
$7,120
$4,625
$11,745
State and Local Taxes ($m)
$1,105
Source: New York State Economic Impacts of Aviation, New York State Department of Transportation, 2010 49
New York State Department of Transportation (2010), New York State Economic Impacts of Aviation
https://www.dot.ny.gov/divisions/operating/opdm/aviation/repository/NYS%20Economic%20Study%202010%20Techni
cal%20Report_0.pdf
NOTE: EWR data were unavailable as EWR is in New Jersey
49
Airports Commission
PwC 79
3. Local Economy: Literature Review
Another key economic impact of the airport system in the New York area is on tourism. Some indication of the
economic impacts of tourists visiting New York can be seen in Figure 60. The main points to note are that:
Domestic visitors add more to the local economy than international visitors at all airports;
LaGuardia contributes more from domestic passengers than JFK and EWR, despite only providing 15%
of the operational impacts (see Table 14); and
JFK is significantly ahead when it comes to international tourism.
Figure 60: Economic impact of visitors to New York by airport by origin (2004)
Wages
3,000
5,000
4,000
3087
1150
5391
5019
779
3,000
2,000
1,000
4240
LGA
6,000
4070
500
0
757
1,000
290
Sales [$ million]
JFK
10
1,500
1892
1602
44.5
EWR
20
2,000
1541
36.71
30
2032
1275
40
8.55
Wages [$ million]
50
46.19
60
54.74
7157
7,000
2,500
59.01
34.03
70
8,000
2691
2027
78.53
80
Sales
JFK
LGA
3364
90
22.3
Jobs
Thousands
Jobs
0
0
EWR
Airport
JFK
EWR
LGA
Airport
Airport
Domestic
International
Source: The Economic Impact of the Aviation Industry on the New York – New Jersey Metropolitan Region, PANYNJ, 2005
It is clear that tourism from these airports has an important economic impact, creating over 190,000 jobs
between 2000 and 2004 – 13 times that generated from airport investments in the same period – and $6.6
billion and $17.6 billion in wages and sales respectively across the same period.
D.5. Economic impact of aviation in the USA
Table 24 shows the economic impact of aviation as a whole in the USA in 2009. Comparing the economic
impact of JFK and LGA to the USA as a whole suggests that these two airports contributed 3.3%, 4.1% and 3.4%
in total USA jobs, wages and sales from the aviation industry.
Table 24: Estimated output, earnings and jobs attributable to the aviation industry in the USA
(2009)
Description
Output ($bn)
Earnings ($bn)
Jobs (‘000)
Airline operations
296.6
91.9
2,007
Airport operations
78.9
27.5
614
Civilian aircraft manufacturing
84.3
21.5
418
Civilian aircraft engine and engine parts manufacturing
20.9
5.6
112
Civilian other aircraft parts and equipment
72.2
21.5
454
Air couriers
72
21.5
637
Visitor expenditures
597
178.8
5,329
Travel arrangements
12.8
4
118
1,234.8
372.2
9,690
General aviation operations
38.8
12
262
General aviation aircraft manufacturing
25.8
6.6
128
Sub-total – Commercial
Airports Commission
PwC 80
3. Local Economy: Literature Review
Description
Output ($bn)
Earnings ($bn)
Jobs (‘000)
General aviation visitor expenditures
11.9
3.6
106
Sub-total – General Aviation
76.5
22.1
496
1,311.2
394.4
10,186
Total impact
Source: The Economic Impact of Civil Aviation on the U.S. Economy, U.S. Department of Transportation, Federal Aviation
Administration, 201150
U.S. Department of Transportation, Federal Aviation Administration (2011), The Economic Impact of Civil Aviation on
the U.S. Economy
http://www.faa.gov/air_traffic/publications/media/faa_economic_impact_rpt_2011.pdf
50
Airports Commission
PwC 81
3. Local Economy: Literature Review
Appendix E. - Frankfurt am Main
E.1. Introduction
In this Appendix we summarise the evidence we have collected in relation to Frankfurt am Main airport. We
provide background information about the development of the airport since 2000. We then summarise the
available evidence in terms of local business and services, employment, labour supply and housing. Finally, we
review the available evidence on the impact of the development of the airports intermodal connections on its
role and impact.
E.2. Background
Aviation is an important industry in Germany, with 66,000 people employed at airports (0.16% of the total
workforce in Germany)51. Fraport operates and manages a number of airports globally, including Frankfurt am
Main. Frankfurt am Main Airport is the largest airport in Germany in terms of passenger numbers, third in
Europe after London Heathrow and Charles De Gaulle and ninth in the world. This case study focuses on its
economic impact on the local region of Hessen (see Figure 61).
Figure 61: Location of Frankfurt am Main Airport
Source: http://en.wikipedia.org/wiki/File:Flugh%C3%A4fen_in_Deutschland.png
Frankfurt Airport has shown significant growth over recent years, with passenger numbers increasing by almost
9 million since 2000 (see Figure 63). Annual passenger numbers fluctuated slightly until the economic crisis of
2008; however, since the beginning of construction of the new runway in 2009, through its completion in 2011,
to the most recent statistics of 2013, the number of passenger has grown significantly as have load factors. This
is despite the decline in the number of airlines operating from Frankfurt; the airlines that have maintained a
presence have focused on their most profitable routes and the airport has benefitted from this as a whole.
Friedrich Ebert Stiftung (2003), Wachstum trotz Strukturwandel und Luftverkehrsteuer
http://library.fes.de/pdf-files/wiso/10252.pdf
51
Airports Commission
PwC 82
3. Local Economy: Literature Review
The construction of the Airbus maintenance stand between 2005 and 2007 has allowed the airport to
accommodate A380 aircraft, permitting wide-body aircraft and serving more passengers with fewer take-offs
and landings, but the major development that has spurred this growth is the construction of the international
train station. Although the Airport station was completed pre-2000, improvements in the technology of the
trains has allowed for a faster and more efficient schedule of trains to and from the Airport. The long-distance
station now operates, on average, 170 Inter City Express daily trains which travel across Germany and the
short-distance station offers 400 S-Bahn trains and buses on a daily basis which serve the Rein-Main region – a
journey to Frankfurt city takes only 15 minutes by these trains. These developments have allowed Frankfurt
Airport to expand its catchment area for German passengers whilst maintaining its status as a connection point
between Europe, the Middle East and the Americas.
E.3. Economic impacts
A study was carried out by INFRAS and BAKBASEL (both economic research and consultancy firms) for
Fraport, the airport owner, in 2013 to investigate the economic impact of Frankfurt Airport on the surrounding
region; this was then updated in February 2014. In this study, the effects of airport operations were measured
by considering the number of jobs generated and the value added, both directly and indirectly and using
broadly the same definitions of ‘direct’, ‘indirect’ and ‘induced’ as in the other case studies. The induced effect
was also calculated using multipliers. The measures were produced every four years starting in 2000 and
ending in 2012. Hence, they provide some indication of how the Airport’s impact has changed over time.
The total impact can be seen in Figure 62. It shows that Frankfurt Airport’s economic impact has increased
steadily over the period between 2008 and 2012. It also shows that the induced impact is significantly larger
than the direct and indirect impact.
Figure 62: Economic impact of Frankfurt Airport
Year
2000
2004
2008
2012
Direct
62.5
68.0
71.0
78.0
Indirect
38.1
38.2
36.8
38.3
Induced
93.9
76.8
46.6
39.2
Total
194.5
183.0
154.4
155.5
Of which wages and salaries
65.1
60.1
53.0
58.8
Direct
5.65
5.89
6.31
6.63
Indirect
1.98
2.15
2.26
2.51
Induced
2.48
2.25
0.9
1.05
Total
10.11
10.29
9.47
10.19
Of which wages and salaries
3.39
3.38
3.25
3.85
Employment (‘000 employees)
GVA (€ billions)
Source: Regional und volkswirtschaftliche Bedeutung des Flughafens Frankfurt, INFRAS, 2013
52
INFRAS (2013 – Updated Feb. 2014), Regional- und volkswirtschaftliche Bedeutung des Flughafens Frankfurt
http://www.fraport.de/content/fraport/de/misc/binaer/konzern/flughafen-und-region/regionale--undvolkswirtschaftliche-bedeutung-des-flughafens/jcr:content.file/regional--und-volkswirtschaftliche-bedeutung-desflughafen-frankfurts--aktualisierter-schlussbericht-februar-2014.pdf
52
Airports Commission
PwC 83
3. Local Economy: Literature Review
Figure 63: Frankfurt timeline
1994
Terminal 2
opened; new
total capacity of
54m
2011
“Squaire” opened;
largest office building
in Germany
2005-2007
New Airbus maintenance stand
constructed for LH; both terminals
required renovations to accommodate
A380s
90
134
136
136
137
80
Oct 2012
Terminal 1 expansion
completed (+6m of
capacity, LH only)
150
140
131
131
133
133
131
127
135
122
114
70
111
120
105
60
90
81.63
76.85
58.04
57.53
78.43
79.17
56.44
76.60
53.01
50.93
73.52
74.17
53.47
74.08
54.16
73.92
52.81
73.54
52.22
69.95
51.10
20
66.36
48.35
30
67.04
48.45
40
65.49
48.56
50
68.36
49.36
Millions
Oct 2011
New runway opened; used for
landings only (increased from
83 to 126 ATMs/hr)
60
45
30
10
15
0
Passenger
Load Factor**:
75
Number of Operating Airlines
Number of Passengers or Available Seats*
1999
New train station
becomes operational
at Terminal 1
135
Early 2009
Construction begins on new
fourth runway
Dec 2005
Rein-Mein air base handed back
to Fraport; new terminal
planned, “Gateway Gardens”
0
2000
2001
2002
2003
2004
2005
71.1%
67.6%
72.8%
71.5%
72.0%
69.9%
Available Seats
2006
2007
2008
2009
70.2%
73.4%
71.6%
72.8%
Passenger Movements
2010
2011
2012
2013
2014
67.7%
73.6%
74.9%
75.9%
N/A
Operating Airlines
*Available departing seats multiplied by 2
** Passengers divided by available seats
Sources: Available seats and operating airlines obtained from SABRE Airport Data Intelligence
Passenger data retrieved from CAA Statistics, http://www.caa.co.uk/default.aspx?catid=80&pagetype=88&pageid=3&sglid=3
Airports Commission
PwC 84
3. Local Economy: Literature Review
The study also splits the impacts on employment between:
Airline related (i.e. airlines, providers of general aviation, catering, technical operation (technology,
maintenance, servicing of airplanes)) - see Figure 64;
Airport related (i.e. airport operations, police/customs/further authorities, security and cleaning
companies) - see Figure 65; and
Non-aviation services on airports like stores, kiosks, banks, restaurants, travel agencies, car rentals,
barber shops, consulting companies - see Figure 66.
Airlines make the largest economic contribution (an average of 66% of the direct and indirect jobs at Frankfurt
Airport and 73% of the direct and indirect value added. The non-aviation companies, however, have a large
impact, contributing €850 million and supporting almost 15,000 jobs in 2012. We note the development of
each impact over time, particularly between 2008 and 2012. Within this period, passenger numbers increased,
after an initial decline due to the global economic crisis, and each sector showed growth, even when the number
of operating airlines was in decline. Importantly, non-aviation employment almost doubled and GVA did
double in this period. These trends are reflected in Figure 67 and Figure 68.
Figure 64: Economic impact of Frankfurt Airport – Airline
Year
2000
2004
2008
2012
Direct
38.57
43.28
44.25
47.22
Indirect
28.69
28.99
27.84
28.40
Induced
73.04
64.74
41.79
35.44
Total
140.30
137.01
113.88
111.06
Direct
4.01
4.38
4.61
4.66
Indirect
1.49
1.63
1.71
1.86
7.29
7.71
6.98
7.28
Employment (‘000 employees)
GVA (€ billions)
Induced
Total
Source: Regional- und volkswirtschaftliche Bedeutung des Flughafens Frankfurt, INFRAS, 2013
Figure 65: Economic impact of Frankfurt Airport – Other airport
Year
2000
2004
2008
2012
Direct
19.70
21.38
23.68
24.87
Indirect
7.64
8.04
8.08
7.82
Induced
18.69
11.18
5.23
4.91
Total
46.03
40.60
36.99
37.60
Direct
1.41
1.33
1.56
1.70
Indirect
0.40
0.45
0.50
0.51
Induced
0.58
0.5
0.21
0.25
Total
2.39
2.28
2.27
2.46
Employment (‘000 employees)
GVA (€ billions)
Source: Regional- und volkswirtschaftliche Bedeutung des Flughafens Frankfurt, INFRAS, 2013
Figure 66: Economic impact of Frankfurt Airport – Non-aviation
Airports Commission
PwC 85
3. Local Economy: Literature Review
Year
2000
2004
2008
2012
Direct
4.24
3.33
3.07
5.92
Indirect
1.74
1.14
0.92
2.04
Induced
2.24
0.91
-0.45
-1.08
Total
8.22
5.38
3.54
6.88
Direct
0.23
0.17
0.14
0.27
Indirect
0.09
0.06
0.06
0.13
Induced
0.11
0.07
0.02
0.05
Total
0.43
0.30
0.22
0.45
Employment (‘000 employees)
GVA (€ billions)
Source: Regional- und volkswirtschaftliche Bedeutung des Flughafens Frankfurt, INFRAS, 2013
Of approximately 500 employers, the five biggest at Frankfurt am Main Airport are:
Deutsche Lufthansa AG;
Fraport AG;
LSG Sky Chefs;
German Federal Police; and
International Mail Centre53.
Figure 67 shows the distribution of direct and indirect employment and value added arising from Frankfurt
Airport in 2012. The biggest contribution to value added is provided by airlines whose share is even greater if
the indirect impacts are included. This is because airlines buy more services from outside the airport than
airport related services. Airlines also account for the greatest proportion of the workforce. In the direct impact
the proportions of airport and non-aviation services are bigger than their value added. This is because their
activities are more labour-intensive (e.g. cleaning services, security, sales jobs, restaurant etc.).
Figure 67: Distribution of employment sectors in 2012
100%
Percentage Share
90%
4%
5%
8%
5%
80%
70%
60%
61%
70%
74%
74%
50%
40%
30%
20%
10%
32%
20%
26%
20%
Indirect
Direct
Indirect
0%
Direct
Employment
Airport
Value Added
Airlines
Non-avitaion
Source: Regional- und volkswirtschaftliche Bedeutung des Flughafens Frankfurt, INFRAS, 2013
Note: Percentages may not total 100% due to rounding
53
Fraport AG, ‘2012 Facts and Figures on Frankfurt Airport’
Airports Commission
PwC 86
3. Local Economy: Literature Review
Figure 68 suggests that airlines have slightly less impact on employment as time progresses and in recent years
non-aviation has grown thanks to the opening of Squaire and Gateway Gardens. These effects are consistent
across indirect effects and induced effects.
Figure 68: Development of direct employment sectors (2000-2012)
100%
7%
5%
4%
8%
62%
64%
62%
61%
32%
31%
33%
32%
2000
2004
2008
2012
90%
Percentage Share
80%
70%
60%
50%
40%
30%
20%
10%
0%
Airport
Airlines
Non-aviation
Source: Regional- und volkswirtschaftliche Bedeutung des Flughafens Frankfurt, INFRAS, 2013
Note: Percentages may not total 100% due to rounding
Airports Commission
PwC 87
3. Local Economy: Literature Review
Figure 69 illustrates the age composition of employees and compares it to the region (Hessen) and the whole of
Germany. Information on the age of those employed in Germany was unavailable on the same level as was
known for Frankfurt so two of the groupings (25-50 and 50-55) have been plotted together to form a new group,
25-55. Frankfurt employs fewer people younger than 25 and older than 55 compared to the national average.
The second part of
Airports Commission
PwC 88
3. Local Economy: Literature Review
Figure 69 (top-right) shows the split of employment across the three locations by gender, foreign nationality
and whether employed on a temporary contract. It shows that Frankfurt Airport has:
A smaller proportion of female staff than the surrounding region of Hessen and Germany as a whole;
A higher portion of staff who are foreign nationals (probably due to airlines from other countries having
staff based at the airport for check-in services, along with tourist companies and businesses requiring
multi-lingual staff); and
A smaller percentage of staff on temporary contracts than the national average, implying that the jobs at
the airport are more secure and less time-structured than the rest of Germany.
The last plot in
Airports Commission
PwC 89
3. Local Economy: Literature Review
Figure 69 (bottom) shows the duration of employment at Frankfurt Airport compared to the rest of Germany
and similar industries in Germany (‘Transportation & Storage’ and ‘Hotel, Restaurant & Commerce’). The
proportion of employees at Frankfurt Airport who have been employed for over 10 years is more than in the rest
of Germany. This suggests that workers at Frankfurt Airport are more likely to make a career of their role and
stay for more than 10 years than the rest of Germany and comparable sectors across Germany.
Airports Commission
PwC 90
3. Local Economy: Literature Review
Figure 69: Characteristics of employees at Frankfurt Airport in comparisson to other regions
Percentage of Workforce
Age of Employees
Gender/Nationality/Contract of Employees
100%
90%
80%
70%
60%
50%
40%
30%
20%
10%
0%
50%
45%
40%
35%
30%
25%
20%
15%
10%
5%
0%
Frankfurt Airport
15-25
25-50
Female
Foreign National
Germany
Hessen
Temporary
Contracts
Germany
50-55
Frankfurt Airport
>55
Percentage of Workforce
Duration of Employment
100%
90%
80%
70%
60%
50%
40%
30%
20%
10%
0%
Frankfurt Airport
0-1 Years
Germany
1-3 Years
3-6 Years
Germany: Transportation &
Germany: Hotel,
Storage
Restaurant & Commerce
6-10 Years
>10 Years
Source: Regional- und volkswirtschaftliche Bedeutung des Flughafens Frankfurt, INFRAS, 2013
*Statistical adjustment of Frankfurt Airport – some of the companies surveyed in the study did not respond so it is assumed that all of
their employees (8,500) have been employed for less than 1 year
Some 60% of the airport employees live within approximately 35 km of Frankfurt am Main airport:
16% in the city of Frankfurt;
16% in the Gross-Gerau area;
12% in the Offenbach area;
8% in the Mainz and Wiesbaden areas; and
6% in the Darmstadt area54.
54
Fraport AG, ‘2012 Facts and Figures on Frankfurt Airport’
Airports Commission
PwC 91
3. Local Economy: Literature Review
E.4. Intermodal connections at Frankfurt am Main
E.4.1. Background
Frankfurt am Main Airport has seen the steady growth of its rail connections over the last 40 years (see Table
25). As a consequence, it now has two rail stations:
The first regional train station (opened in 1992) is served by around 225 commuter and regional trains
per day which carried 3.5 million passengers in 2013; and
The more recent long-distance train station (opened in 1998) is served by around 180 high-speed
distance trains per day which carried 5.6 million passengers in 2013 and provided connections through
existing, improved or newly built high speed railway links.
The long-distance station cost €225 million to construct with €97 million coming from the Federal Government
and the remaining €128 million from Fraport AG, the company which runs the airport. Above the railway
station is the Frankfurt AirRail Centre (known as The Squaire) which was built by a private investor at a cost of
about €1 billion (and opened in 2011)55.
The two stations enable Frankfurt am Main Airport to offer integrated transport services to airport users.
Table 25: History of development of intermodal links at Frankfurt am Main Airport
Year
Developments
1972
First airport in Germany to have own railway station and adjacent terminal –served only by local trains
1978
Rail services extended to include infrequent semi-fast trains to wider catchment but no long distance
trains
1980
Local trains replaced by high frequency commuter trains from Frankfurt via the airport to Mainz –
Wiesbaden
Airport regular stop for inter-city trains along the River Rhine to Nuremberg and Munich
Special trains run for Lufthansa connecting Dusseldorf, Cologne and Bonn: later extended to Stuttgart
Used exclusively by air travellers connecting in Frankfurt to/from flights of Lufthansa and co-operating
airlines
Special trains ceased following merger of railway company
Partly replaced by a few public inter-city trains
Public inter-city trains stopped due to low demand
Lufthansa and Deutsche Bahn started the project which became AirRail in 2001
1999
Second railway station opened dedicated to long-distance trains with three IC-routes as well as additional
regional services on medium distances
2001
Lufthansa and Deutsche Bahn started project which became AirRail
2002
High-speed link opened to Cologne and Bonn in less than an hour
Additional InterCityExpress (ICE) routes enable Lufthansa to cease flights between Cologne and
Frankfurt
1982
1993
1995
Frankfurt am Main Airport was particularly suited to the development of inter-modal connections with long
distance trains because it (already) served a large number of destinations, especially with inter-continental
flights, some of which it was unique in Europe in offering. For that reason, a large proportion of passengers
were transferring at Frankfurt to another flight.
Lufthansa, Deutsche Bahn and Frankfurt am Main Airport developed and implemented AirRail as a competitive
airline product using high speed trains as a feeder for flights. It made regular trains with designated
compartments for air travellers. The service is considered part of the air travel offered by Lufthansa (and the
STAR Alliance) and is booked via the airline. It overcomes two challenges:
55
INTERCONNECT, 2009, Factors affecting interconnectivity: Case Study: Frankfurt am Main Airport Connections
Airports Commission
PwC 92
3. Local Economy: Literature Review
Long-distance trains run exclusively for air passengers are not viable (especially where competition exists
with other carriers for high yield passengers); and
Very short-haul flights (e.g. between Cologne and Frankfurt) are typically loss-making for the airline as
there are insufficient origin-destination passengers to generate enough income to supplement the limited
revenue from inter-continental ticket sales assigned to these short flights from transferring passengers.
Nonetheless, in developing its rail links, the Airport and its partners have needed to address some key barriers:
Monopolistic structures which limit incentives on the supply side: for example, Deutsche Bahn and
Lufthansa compete on some short haul routes which affects their willingness to co-operate in areas where
they do not compete;
Airport capacity constraints, reinforced by regulations (e.g. slot allocation, grandfather rights), which
encourage Lufthansa to replace its short haul flights with train services so that it can start new
intercontinental flights; and
Split responsibilities for infrastructure provision between different tiers of government (i.e. Federal
Government and Länder).
E.4.2. Expected benefits
The expected benefits of the enhanced intermodal connections at Frankfurt am Main Airport are summarised in
Table 26.
Table 26: Expected benefits of intermodal connections at Frankfurt am Main Airport
Beneficiary
Impact
Frankfurt Airport
Faster access by high speed trains and alternative access mode to road
Improved competitive position compared to other gateway airports in continental Europe
Enlarged catchment area enabling more passengers to be handled: Figure 70 shows Frankfurt
am Main Airport’s (modelled) share of total demand for air transport in each area (excluding
those where the market share is below 5%) and illustrates that, in addition to the Rhine-Main
area, the catchment covers parts of Southwest Germany and Eastern France down to
Switzerland in the South and the Ruhr area and parts of Belgium in the North West
Better (more profitable) use of constrained slots by long-haul instead of short-haul flights: and
airport with capacity constraints prefers to increase the number of arriving and departing
passengers in favour of twice counted transfer passengers because it allows an increased
catchment, more destinations and more retail business
Greater share of passengers travelling to the airport compared to other feeder modes
Improved loads on long distance trains
Stronger market position against competing airlines by offering a seamless transport chain to
the traveller
Improved loads on own flights
Greater scope for cutting less commercially attractive short haul flights to hub and more scope
for profitable use of slots with long-haul flights.
Other airlines
Feeds additional passengers into long-haul flights where Frankfurt is spoke end of network and
they do not have any (alliance) partner airline
Policy makers:
Sustainable growth of the airport business in Germany meaning more jobs, more direct and
indirect income
Improved accessibility of regions (not only close to airports) leading to time savings and more
attractive regions for investments, employment and tourism
Railway:
Lufthansa:
Source: PwC analysis
Airports Commission
PwC 93
3. Local Economy: Literature Review
Figure 70: Catchment of Frankfurt airport
Source: INTERCONNECT, 2009, Factors affecting interconnectivity: Case Study: Frankfurt am Main Airport Connections
Figure 71 shows the (modelled) origins of passengers expected to use public transport as a feeder mode at
Frankfurt am Main Airport. Several highly populated areas, some distant from the Airport, show significant
numbers of rail passengers, including Hamburg, Berlin, Hanover and Kassel in the north, the Dusseldorf /
Cologne area in the west and the area of Mannheim, Karlsruhe and Stuttgart in the south.
Airports Commission
PwC 94
3. Local Economy: Literature Review
Figure 71: Spatial distribution of air passengers using public transport as feeder mode
Source: INTERCONNECT, 2009, Factors affecting interconnectivity: Case Study: Frankfurt am Main Airport Connections
Airports Commission
PwC 95
3. Local Economy: Literature Review
Table 27 shows the (expected) mode of surface transport to and from Frankfurt am Main Airport based on data
collected as part of the planning process for capacity enhancements at the Airport. It is evident that many rail
passengers are not air-travel related (e.g. they are airport employees).
Table 27: Expected mode and purpose of surface transport to Frankfurt am Main Airport (‘000
passenger movements per working day, 2005)
Private /
rental car
Taxi
Coach
Public
transport
Total
Share of
public
transport
(%)
Air passengers
29.7
11.5
2.9
21.0
65.1
36.7
Employees
55.0
0
0
29.1
84.1
34.6
Attendants
35.3
0
0
1.8
37.1
4.7
Visitors/customers
17.6
0
0
3.2
20.8
15.5
Rail passengers not
airport related
1.9
0.6
0
2.3
4.8
48.2
139.5
12.1
2.9
57.4
211.9
27.1
Total
Source: INTERCONNECT, 2009, Factors affecting interconnectivity: Case Study: Frankfurt am Main Airport Connections
E.4.3. Impact
Shows the change in the composition of air passengers at Frankfurt am Main Airport between 2000 and 2008.
Although many (external) events affected this pattern (e.g. 9/11 and the emergence of low cost carriers), the
number of passengers on domestic flights to and from Frankfurt decreased, while the number of European and
Intercontinental passenger increased. This is significant given that the total number of passengers on domestic
flights within Germany increased over the same period.
Table 28: Changing composition of air passengers at Frankfurt am Main Airport (2000-2008)
Type
2000
2008
Change 2000 - 2008
Domestic
8.8
6.38
-27.5%
European
22.94
25.24
+10,0%
Intercontinental
26.42
28.23
+6,9%
Total
49.36
53.47
+8,3%
Source: INTERCONNECT, 2009, Factors affecting interconnectivity: Case Study: Frankfurt am Main Airport Connections
The introduction of AirRail led to many passengers choosing the train to connect for their (long-haul) flights at
Frankfurt instead of using an ultra-short haul feeder flight. The rail capacity offered increased whilst the
capacity on the equivalent flights decreased. Table 29 shows the number of air passengers in 2000 (before the
opening of AirRail) and 2008 and the change over the period.
Table 29: Passenger figures for selected years at Frankfurt airport
Passengers from
Frankfurt to (‘000)
2000
2008
% change 2000 – 2008
Stuttgart
445.6
203.3
-54.4%
Cologne
316.9
0.9
-99.7%
Total
762.5
204.2
-73.2%
Source: INTERCONNECT, 2009, Factors affecting interconnectivity: Case Study: Frankfurt am Main Airport Connections
Airports Commission
PwC 96
3. Local Economy: Literature Review
Not all the effects outlined (50% reduction on the Stuttgart route and 100% on Cologne route since 2000) can
be assigned to AirRail as other factors also influenced the development of demand on these links:
Some of the passengers arriving or leaving Frankfurt by rail do not use the AirRail concept, but travel
with rail tickets issued by Deutsche Bahn;
A change in route choice of passengers who refuse to use trains by transferring at Munich instead of
Frankfurt to/from their connection flights; and
A change in route choice or airport choice due to the increased number of destinations at the airports of
Cologne or Dusseldorf (40 km from Cologne) within the last 10 years.
More generally, whilst the number of long-distance rail passengers at Frankfurt am Main Airport rose
significantly following the development of the inter-modal connections, this masks several diverse effects:
Some passengers travelled to/from the airport by long-distance train instead of:
–
–
–
A private car
A transfer connection from Frankfurt central station and a commuter train to the airport
A short haul feeder flight;
Other passengers chose to use the new airport station as a starting point for their rail trips instead of
other rail stations (e.g. Frankfurt Central, Mainz and Wiesbaden);
Some passengers changed the routing of their travel (e.g. using a train to Frankfurt am Main Airport
before flying to New York instead of flying on another route such as Dusseldorf – New York nonstop or
Cologne – Amsterdam – New York);
Some air passengers took additional flights because of the improved accessibility of Frankfurt am Main
Airport whilst others substituted rail journeys for flights; and
Employees took up a job at Frankfurt am Main Airport because it was easier for them to commute from
their existing residence.
E.4.4. Conclusions
Although the evidence from Frankfurt am Main Airport needs to be interpreted with caution, it suggests that:
To justify the costs of providing rail services, the airport needs to be attractive to passengers:
–
–
By offering a good enough range of services to attract sufficient passengers from a large catchment
areas; and
By enabling them to use the rail network to access the airport without extending the travel-time.
Providing through-ticketing solutions for intermodal travel with rail and air improves the attractiveness
and effectiveness of the option, especially if the train segment is fully integrated with the air travel (like
AirRail).
Connecting airports to the railway network enables long-distance rail services to replace short haul
flights: the number of air passengers on long-distance trains at Frankfurt am Main Airport more than
doubled within a few years whilst the number of passengers on (short-haul) domestic flights decreased by
more than a quarter (contrary to the wider trend in Germany).
Switching from air to rail releases runway slots no longer needed for feeder flights for use by additional
(long-haul) flights at the capacity constrained airport.
The transferability of concepts like AirRail to other airports depends on several conditions being met:
Existing demand for rail travel is sufficient to make the rail service viable as trains operated exclusively
for air passengers are not viable at the frequency level needed to provide attractive transfer times to/from
connecting flights;
Potential demand comes largely from passengers transferring at the airport (rather than local demand);
The airport is connected to the railway network with its own railway station which is served by fast longdistance trains without transfers; and
Airports Commission
PwC 97
3. Local Economy: Literature Review
The travel-time on trains is not significantly more than 90 minutes, the typical elapsed time of a shorthaul flight allowing for check-in time.
Capacity constraints at the airports push airlines towards the substitution of short-haul flights.
Finally, with the additional runway completed in 2011, we compare the growth of Frankfurt am Main Airport
with other European hub airports and others in Germany. Figure 72 shows that Frankfurt am Main has
followed the same general trend as the other main European hubs, growing with the aviation industry.
Figure 72: Growth of European hubs over time
Aircraft Movements
20%
20%
15%
15%
Annual Growth
Annual Growth
Passengers Movements
10%
5%
0%
-5%
-10%
-15%
10%
5%
0%
-5%
-10%
-15%
2009
2010
2011
Frankfurt
Munich
Amsterdam
Heathrow
2012
2013
2009
Paris - CDG
2010
2011
Frankfurt
Munich
Amsterdam
Heathrow
2012
2013
Paris - CDG
Source: CAPA Centre for Aviation http://centreforaviation.com/
Of the four German airports considered in Figure 73, Dusseldorf has shown the most growth year-on-year and
Cologne/Bonn generally has the least in terms of both passenger and aircraft movements. Frankfurt is in the
middle following the general trend across these airports.
Figure 73: Growth of middle-sized neighbour airports over time
Aircraft Movements
10%
10%
5%
5%
Annual Growth
Annual Growth
Passenger Movements
0%
-5%
-10%
-5%
-10%
-15%
-15%
2009
Frankfurt
0%
2010
Dusseldorf
2011
2012
Cologne/Bonn
2009
2013
Stuttgart
Frankfurt
2010
Dusseldorf
2011
2012
Cologne/Bonn
2013
Stuttgart
Source: CAPA Centre for Aviation http://centreforaviation.com/
Airports Commission
PwC 98
3. Local Economy: Literature Review
Figure 74: Growth compared to Frankfurt Hahn over time
Aircraft Movements
10%
10%
5%
5%
Annual Growth
Annual Growth
Passenger Movements
0%
-5%
-10%
-15%
0%
-5%
-10%
-15%
-20%
-20%
2009
2010
Frankfurt
2011
2012
2013
Frankfurt Hahn
2009
2010
Frankfurt
2011
2012
2013
Frankfurt Hahn
Source: CAPA Centre for Aviation http://centreforaviation.com/
Frankfurt Hahn operates on a much smaller scale than Frankfurt Main, serving 2.6 million passengers in 2013
compared to 58 million at Main. Since 2010, however, Frankfurt am Main has consistently grown in passenger
numbers whereas Hahn has decreased each year. This suggests that expansion at Main has affected another
airport – some of the new passengers utilising Main may have previously used Hahn if the new runway
expansion had not been completed.
Figure 75: The Squaire
Source:
http://www.thesquaire.com/GridFS/uploads/header_picture/picture/4eef754dd70a596b430000fc/display_mde_CGahl_thesquaire_3
6292.JPG
Another important attribute of Frankfurt Airport that sets is aside from others is the construction of ‘The
Squaire’ (see Figure 75), the largest office space in Germany and is located on site as part of the long distance
train station. There is 140,000 m2 of useable space; 94,500 m2 of office space, 34,500 m2 for restaurants, cafes
and bistros, 34,500 m2 for hotels (two Hiltons with a total of 583 rooms) and there are an additional 250 stores
in Airport City – another development at Frankfurt which is separate from the Squaire. Such investment in
business near an airport will appeal to a number of companies and draw businesses to relocate to the airport for
convenient transport options; KPMG and Lufthansa are some of the main tenants. Between the Squaire and
Airport City there are a number of services available, including a conference centre, a concierge service, doctors,
fitness, cleaning services, day-care centres and barbers among others.
Airports Commission
PwC 99
3. Local Economy: Literature Review
Appendix F. - Paris (Charles de Gaulle)
F.1. Introduction
In this Appendix we summarise the evidence we have collected in relation to Paris (Charles de Gaulle) airport.
We provide background information about the development of the airport since 2000. We then summarise the
available evidence in terms of local business and services, employment, labour supply and housing.
F.2. Background
Charles de Gaulle Airport (CDG) is the largest in France and the second largest in Europe in terms of passenger
numbers, after Heathrow. Also, around 30% of CDG passenger traffic is connecting passengers56; Paris is in an
attractive location for a hub between Europe, America and Africa. Figure 76 shows the number of available
routes at CDG compared to its main European hub competitors; we note that CDG has seen the largest growth
of connections over the past 15 years compared to Heathrow (LHR), Schiphol (AMS) and Frankfurt (FRA). In
recent years, CDG’s operator, Aéroports de Paris, has turned its focus to establishing CDG as a major European
hub. The trend supports this.
Figure 76: Number of routes available at the major European hub airports (2000-2014)
350
Number of Routes
300
250
200
150
100
50
0
Year
LHR
CDG
FRA
AMS
Source: SABRE Airport Data Intelligence
Not all airport indicators have grown; the number of airlines operating from CDG has dropped since 2007 (see
Figure 78) although this is consistent with operators choosing to focus on airlines that they benefit from (i.e.
carriers from countries and regions that they wish to expand their network to). It can also be seen from Figure
78 that CDG handled more passengers in 2013 than ever before (62.05 million) whilst also achieving its highest
load factor (80.4%). This implies that the airlines using Aéroports de Paris have become more efficient in their
operations and have recovered from the situation in 2010 when scheduled capacity increased without the
passenger demand leaving the load factor at 64.1% (see Figure 78).
Figure 78 also shows the major infrastructure changes and developments at CDG. It provides an insight into
how terminal capacity has changed over the years although it is difficult to attribute the change in available
Charles de Gaulle Focus 2013 - http://www.aeroportsdeparis.fr/ADP/Resources/86ba4eb2-7daa-411f-bb965745ba410362-PARISCHARLESDEGAULLETERMINAUX.pdf
56
Airports Commission
PwC 100
3. Local Economy: Literature Review
seats or passengers served to infrastructure changes without considering wider market trends (which also
reflect world-wide trends rather than individual airport developments).
Figure 77 shows how the composition of passengers at Charles de Gaulle has changed since 2002. Over the
period, the total number of passengers using the airport increased by 28%, with the number of national (i.e.
domestic passengers growing at less than half the rate of international passengers – 14% compared to 30%).
Figure 77: Composition of passengers at Charles de Gaulle (2002-2013)
70,000,000
60,000,000
Passengers
50,000,000
40,000,000
30,000,000
20,000,000
10,000,000
0
2002
2003
2004
2005
2006
International
2007
National
2008
2009
2010
2011
2012
2013
Transit
Source: www.aeroport.fr
Airports Commission
PwC 101
3. Local Economy: Literature Review
Figure 78: Paris - Charles de Gaulle timeline
23 May 2004
T2E section collapses killing 4, investigation
launched, T2E closed
Mar 1998
New Terminal 2
opened
149
142
139
142
152
145
Jun 2012
Satellite 4
opened (7.8m
capacity)
2008
T2E re-opened fully
and new T2G
opened
148
160
143
139
142
131
125
80
120
126
140
120
70
100
93.30
77.17
62.05
60.97
84.41
90.76
58.17
78.54
57.91
80.75
60.87
79.42
59.92
76.39
56.85
73.16
53.80
70.54
51.26
20
68.35
48.22
30
67.29
48.35
40
69.07
48.00
50
77.95
61.61
60
66.61
48.25
Millions
100
Jan 2006
New regional terminal,
T2G, approved (+3m
of capacity, €80m)
Apr 2013
T2B closed for
refurbishment
60
40
20
10
0
Passenger
Load Factor**:
80
Number of Operating Airlines
Number of Passengers or Available Seats*
Jun 2003
Terminal 2E opens (+6m of capacity, €750m)
Phase II in 2007
128
Mar 2012
New boarding area
opened
Mar 2005
Opted to demolish and
rebuild T2E roof
Aug 2004
T2E partial reopening
90
Jun 2007
Satellite 3 opened, fully
operational by Sept
0
2000
2001
2002
2003
2004
2005
2006
2007
2008
2009
2010
2011
2012
2013
2014
72.4%
69.5%
71.8%
70.5%
72.7%
73.5%
74.4%
75.5%
75.4%
73.7%
64.1%
72.2%
79.0%
80.4%
N/A
Available Seats
Passenger Movements
Operating Airlines
*Available departing seats multiplied by 2
** Passengers divided by available seats
Sources: Available seats and operating airlines obtained from SABRE Airport Data Intelligence
Passenger data retrieved from ACI Statistics, http://www.aci.aero/Data-Centre/Annual-Traffic-Data/Passengers/2011-final
Airports Commission
PwC 102
3. Local Economy: Literature Review
F.3. Economic impacts
Aéroports de Paris manages three Parisian airports, CDG, Orly (ORY) and Le Bourget (LBG), which contribute
significantly to the economy of the Ile-de-France region. A study, in 2012 by BIPE, of the economic impact of
these airports found that the number of private companies established in the Ile-de-France region had grown
broadly in line with the growth in the number of aircraft movements at CDG and ORY (see Figure 79)57. Some
care, however, is needed in interpreting this correlation as it does not indicate causality.
Figure 79: Aircraft movements at CDG and ORY and the number of private companies in the Ilede-France region (1986-2011)
Source: Evaluation des impacts économique et social des aéroports Paris-Charles de Gaulle, Paris-Orly, Paris-Le Bourget pour l'année
2010, BIPE 2012
Figure 80 shows the direct, indirect, induced and catalytic value added value the employment created by the
aviation industry in Paris in 2010. The €29.6 billion of added value generated from the Paris airport system
represented 5.8% of the total GDP in the Ile-de-France and 1.7% of GDP in France. We estimate that every
additional million passengers in the Paris airport system contribute an additional €354.2 million in value added
to the economy.
The number of jobs arising from the Parisian airports over the 15 years prior to the study has grown at 3.09%
per annum (seven times more than the average across the Ile-de-France); 20,591 direct jobs were created by
CDG over this period and 18,450 jobs were created (direct, indirect and induced) by CDG in 2010 alone. The
study estimates that across the Paris airport system every one million additional passengers per annum creates
4,100 new jobs of which 1,400 are directly employed. The total of 340,290 jobs in 2010 represented 8.3% of
employees in the Ile-de-France and 2% of jobs in France. This implies that the airports as a whole are less
productive than the economy as a whole.
The Paris airports make a further impact through their influence on tourism. Between then, CDG and ORY
serve 11.6 million international passengers each year (15% of the total international visitors to France) and
spending by these visitors is estimated to support 70,200 jobs in the Ile-de-France region. This includes those
visiting from other parts of France. Overall, CDG and ORY are linked with 14% of the jobs in the tourism
industry in the Ile-de-France.
CP Etude BIPE – Aéroports de Paris - http://www.aeroportsdeparis.fr/ADP/Resources/0800d383-60d8-44bb-8cfc8aae6f6cacf3-CPEtudeBIPE.pdf
57
Airports Commission
PwC 103
3. Local Economy: Literature Review
Figure 80: Total economic impact of Aéroports de Paris airports (value added and employment,
2010)
Added Value (≈Remuneration + EBITDA)
€5.6 bn
€5.3 bn
Catalytic
Induced
€5.2 bn
Indirect
€13.5 bn
Direct
Employment
(4) Tourist spending in Ilede-France
69,954
(3) Spending of the directly
and indirectly employed
85,051
(2) Consumption of
intermediaries and direct
suppliers
69,869
(1) Direct suppliers of
airport goods and services
115,416
1,400 direct employees per million passengers
1,050 direct employees per million units of traffic
€29.6 bn
Or €270 per unit of traffic
Or 1.7% of GDP in France
TOTAL
340,290
Or 3,150 jobs per million units of traffic
Or 2.0% of jobs in France
1 unit of traffic = 1 PASSENGER OR 100KG OF FREIGHT
Source: Evaluation des impacts économique et social des aéroports ParisCharles de Gaulle, Paris-Orly, Paris-Le Bourget pour l'année 2010, BIPE 2012
Figure 81 shows the economic impact of CDG in the Ile-deFrance. It is evident that CDG contributes the majority of the
economic impact of the Paris airport system in the Ile-deFrance. Overall, CDG is responsible for 4.1% of the GDP in Ilede-France and 1.2% of the GDP in France. Also, it is estimated
that every one million additional passengers served annually by
CDG generates an extra €364.1 million in total added value.
CDG is also responsible for 247,893 jobs (6.1% of employees in
the Ile-de-France region) with 52,635 of these jobs engaged in
meeting the needs of visitors to the region. Every one million
additional passengers is estimated to support 4,300 jobs (of
which 1,500 are directly employed by CDG). This is more than
the average across the three Parisian airports.
We have not been able to find earlier studies of the economic
impact of CDG to enable us to investigate how its economic
impact has changed over time as Aéroports de Paris has
changed the focus of its operations towards connecting
passengers and improved the infrastructure of the airport by
constructing new piers to Terminal 2.
Airports Commission
Source:
http://www.holidayfrancedirect.co.uk/graphics/l
ibrary/IledeFrance.jpg
Figure 81: Map of Ile-de-France with
airports highlighted
PwC 104
3. Local Economy: Literature Review
Figure 82: Economic impact of Charles de Gaulle Airport (value added and employment, 2010)
Added Value (≈Remuneration + EBITDA)
€4.2 bn
€3.8 bn
Catalytic
Induced
€3.7 bn
Indirect
€9.5 bn
Direct
Employment
(4) Tourist spending in Ilede-France
52,635
(3) Spending of the directly
and indirectly employed
60,166
(2) Consumption of
intermediaries and direct
suppliers
49,084
(1) Direct suppliers of
airport goods and services
86,008
1,500 direct employees per million passengers
1,050 direct employees per million units of traffic
€21.2 bn
Or €260 per unit of traffic
Or 4.1% of GDP in Ile-de-France
TOTAL
247,893
Or 3,000 jobs per million units of traffic
Or 6.1% of jobs in Ile-de-France
1 unit of traffic = 1 PASSENGER OR 100KG OF FREIGHT
Airports Commission
PwC 105
3. Local Economy: Literature Review
Appendix G. - Bibliography
The table below lists the reports which have been reviewed as part of our research alphabetically by author.
Title
Author
Year
Airport
and/or
geography
covered
Frankfurt Airport:
Special Edition
ACI Europe
2011
Frankfurt
http://www.airport-business.com/wpcontent/page-flip/frankfurt-airport-official-report2011/
London Gatwick
Airport: Special
Edition
ACI Europe
2011
Gatwick
https://www.acieurope.org/component/downloads/downloads/29
85.html
London Heathrow
Airport: Special
Edition
ACI Europe
2011
Heathrow
https://www.acieurope.org/component/downloads/downloads/29
87.html
Economic Impact of
Canberra Airport
ACIL Tasmin
2011
Canberra
http://www.acilallen.com.au/cms_files/ACIL_Can
berraAirport_2011.pdf
Paris-Charles de Gaulle
Focus 2013
Aeroports de
Paris
2013
Paris
https://www.aeroportsdeparis.fr/ADP/Resources/
86ba4eb2-7daa-411f-bb96-5745ba410362PARISCHARLESDEGAULLETERMINAUX.pdf
ACI Airport Economics
Report
Airports
Council
International
2012
Global
http://www.aci.aero/Publications/ACI-AirportStatistics/ACI-Airport-Economics-Report-2012
Measuring the effects
of transportation
infrastructure location
on real estate prices
and rents: investigating
the current impact of a
planned metro line
Antoniou &
Efthymiou
2013
N/A
http://link.springer.com/article/10.1007%2Fs1367
6-013-0030-4#page-1
Cologne-Bonn Airport
as an economic and
location factor
(Translated)
ARC, Booz
Allen
Hamilton
2008
CologneBonn
http://www.koeln-bonnairport.de/uploads/tx_download/2008_Wirtschaf
tsfaktor_CGN_Oekonomische%20Bedeutung.pdf
Connecting the region
to the world
Atlanta
2009
Atlanta
http://www.atlantaairport.com/docs/NewsRoom/2009_Economic_I
mpact_Study_report.pdf
Developing tools to
support complex
infrastructure decisionmaking
Baker &
Mahmood
2012
N/A
http://www.emeraldinsight.com/journals.htm?arti
cleid=17035945
The Impact of Airport
Noise on Residential
Real Estate
Bell, Randall
2001
Global
http://www.eltoroairport.org/issues/AirportNoise.
pdf
Wellington Airport
Impact Assessment
BERL
2008
Wellington
http://www.wellingtonairport.co.nz/documents/W
ellington-Airport-Masterplan-January-2010.pdf
Airports Commission
Link
PwC 106
3. Local Economy: Literature Review
Title
Author
Year
Airport
and/or
geography
covered
Link
Employment
Generation and
Airports
BITRE
2012
Australia
http://www.bitre.gov.au/publications/2013/files/i
s_046.pdf
The Economic
Catalytic effects of Air
Transport in Europe
Britton,
Cooper &
Tinsley
2005
EU
www.abstracts.aetransport.org/paper/download/i
d/2088
GDP by Industry Data
Bureau of
Economic
Analysis
2014
USA
http://www.bea.gov/industry/gdpbyind_data.htm
Airport Office
Developments:
Assessing the Potential
for New Schemes
CBRE
2013
N/A
http://portal.cbre.eu/portal/page/portal/RRP/Res
earchReportPublicFiles/EMEA_VP_AIRPORT_O
FFICE_DEVELOPMENT_JULY_2013.pdf
Impact of Vancouver
Airport on commercial
property values
Cohen &
Brown
2013
Vancouver
www.aeaweb.org/aea/2014conference/program/re
trieve.php?pdfid=1225
Agglomeration,
Productivity and
Regional Growth:
Production Theory
Approaches
Cohen& Paul
2008
USA
http://www.fmpc.uconn.edu/are/seminar/Cohen/
cohen_morrisonpaul_agglomeration.pdf
The knowledge
economy, hub airports
and accessibility. A
location based
perspective. The Case
of AmsterdamSchiphol.
Conventz &
Thierstein
2011
Amsterdam
http://wwwsre.wu.ac.at/ersa/ersaconfs/ersa11/e110830aFinal
01569.pdf
European Cities
Monitor
Cushman &
Wakefield
2011
Europe
http://www.cushmanwakefield.co.uk/engb/research-and-insight/2012/european-citiesmonitor-2011/
Airport expansions and
property values: the
case of Chicago O’Hare
Airport
Daniel P
McMillen
2004
Chicago
http://www.sciencedirect.com/science/article/pii/
S0094119004000099
The Heathrow
Phenomenon
Deloitte
2007
Heathrow
http://www.westlondon.com/wpcontent/uploads/2011/10/Heathrow_Phenomeno
n.pdf
Economic Impact of a
Western Sydney
Airport
Deloitte
2013
Sydney
http://www.nswbusinesschamber.com.au/NSWBC
/media/Misc/Lobbying/Thought%20leadership/FI
NAL-Thinking-Business-Western-SydneyAirport.pdf
Job density,
productivity and the
role of transport
Department of
Transport
2012
N/A
http://www.transport.vic.gov.au/__data/assets/p
df_file/0005/74228/Job-density-productivityand-the-role-of-transport.pdf
Airports Commission
PwC 107
3. Local Economy: Literature Review
Title
Author
Year
Airport
and/or
geography
covered
Link
Stakeholder
management and path
dependence in largescale transport
infrastructure
development: the port
of Antwerp case
Dooms et al.
2013
Antwerp
http://www.sciencedirect.com/science/article/pii/
S0966692312001524
The economic impact
of the Budapest Airport
on the local economy
Dusek,
Lukovics &
Bohl
2011
Budapest
http://wwwsre.wu.ac.at/ersa/ersaconfs/ersa11/e110830aFinal
01228.pdf
2013 Economic Impact
Study of San Francisco
International Airport
EDRG
2013
San
Francisco
http://media.flysfo.com.s3.amazonaws.com/defaul
t/downloads/reports/SFOEconomicImpactReport
2013.pdf
Measuring the effects
of transportation
infrastructure location
on real estate prices
and rents: investigating
the current impact of a
planned metro line
Efthymiou,
Dimitrios and
Antoniou,
Constantinos
2013
Greece plus
some global
observation,
including
Manchester
http://link.springer.com/article/10.1007/s13676013-0030-4/fulltext.html#Bib1
Economic and social
analysis of potential
airport sites
Ernst & Young
2012
Sydney
http://www.infrastructure.gov.au/aviation/scopin
gstudy/files/Ernst_and_YoungEconomic_and_social_analysis_of_potential_airp
ort_sites.pdf
The Impact of Airport
Noise and Proximity on
Residential Property
Values
Espey, Molly
and Lopez,
Hilary
2002
US plus
global
observations
http://onlinelibrary.wiley.com/doi/10.1111/00174815.00135/abstract
2012 Facts & Figures
on Frankfurt Airport
Fraport
2012
Frankfurt
http://www.frankfurtairport.com/content/frankfurt_airport/en/misc/c
ontainer/facts-and-figures2011/jcr:content.file/zadafa-2012_e_lowres.pdf
The London Plan
GLA
2011
London
http://www.london.gov.uk/priorities/planning/lo
ndon-plan
Economic Evidence
Base
GLA
Economics
2010
London
http://www.london.gov.uk/sites/default/files/evid
ence-base-2010-final-low.pdf
Regional, sub-regional
and local gross value
added estimates for
London
GLA
Economics
2014
London
https://www.london.gov.uk/priorities/businesseconomy/publications/gla-economics/regionalsub-regional-and-local-gross-value-addedestimates-for
Agglomeration,
Productivity and
Transport Investment
Graham
2007
N/A
http://www.ingentaconnect.com/content/lse/jtep/
2007/00000041/00000003/art00003
The Regional
Economic Impact of an
Airport: The Case of
Amsterdam Schiphol
Airport
Hakfoort et al
2001
Amsterdam
http://dspace.ubvu.vu.nl/bitstream/handle/1871/
22163/theregionaleconomicimpact.pdf;jsessionid=
6369F93D3A3C116EED1F5794912DABE9?sequen
ce=2
Heathrow: On-airport
Employment Survey
Heathrow
Heathrow
http://www.heathrowairport.com/static/Heathrow
/Downloads/PDF/Employment-survey.pdf
Airports Commission
2008/09
PwC 108
3. Local Economy: Literature Review
Title
Author
Year
Airport
and/or
geography
covered
Link
A Focus on the
Economy: Towards a
sustainable Heathrow
Heathrow
2011
Heathrow
http://www.heathrowairport.com/static/Heathrow
/Downloads/PDF/Afocusontheeconomy.pdf
Sea-Tac International
Airport impact
mitigation study
Helmuth,
Obata &
Kassabaum
1997
Seattle
http://airportnoiselaw.org/study912.html
Airline Network
Benefits
IATA
2006
N/A
http://www.iata.org/whatwedo/Documents/econo
mics/airline_network_benefits.pdf
Economic Impact
Study for Colorado
Airports
ICF SH&E
2013
Colorado
http://www.coloradodot.info/programs/aeronauti
cs/PDF_Files/2013EIS_TECHRPT
Minneapolis- St.Paul
International Airport
InterVISTAS
2012
Minneapolis
-St. Paul
http://www.metroairports.org/documents/MSPEconomic-Impact-Study-2012-FINALREPORT_march2.aspx
http://www.ocair.com/reportspublications/Econo
micImpact/JWAEconomicImpactStudy.pdf
John Wayne Airport
Economic Impact
Study
InterVISTAS
2014
John Wayne
Airport,
Orange
County
City Momentum Index
Jones Lang
LaSalle
2014
Global cities
http://www.jll.com/Research/City-MomentumIndex-January-2014.pdf?5fa7cce1-7f58-4872-b1b58bad50592d4f
High-level commercial
and financial
assessment of selected
potential schemes
KPMG
2013
London &
surrounding
area
https://www.gov.uk/government/publications/air
ports-commission-interim-report
Economic Impact
Study: Sacramento
County Airport System
Leigh Fisher
2011
Sacramento
file:///C:/Users/899046/Downloads/SCAS_Econ
omic_Impact_Study.pdf
Economic Impacts of
Closure of Heathrow
Airport
Leigh Fisher
2013
Heathrow
https://www.gov.uk/government/publications/air
ports-commission-interim-report
Economic Impact
Study
Leigh Fisher
2011
Ottawa
http://ottawaairport.ca/sites/default/files/yow/files/publication
s/2010_economic_impact_study.pdf
Supporting London
business clusters
London
Councils
2010
London
http://www.londoncouncils.gov.uk/policylobbying
/economicdevelopment/boroughecdev/Supporting
Londonbusinessclusters.htm
Auckland Airport –
Future Economic
Impact Assessment
Market
Economics
2010
Auckland
http://www.aucklandairport.co.nz/~/media/Files/
Corporate/AIAL%20EIA%20Report%202021%20a
nd%202031%20final%20291010.pdf
Airport expansions and
property values: the
case of Chicago O’Hare
Airport
McMillen,
Daniel P.
2004
Chicago
http://www.oharenoise.org/news_page_files/Prop
erty_Values_OHare.pdf
Economic Impact: The
Miami-Dade County
Airport System
Miami-Dade
Aviation
Department
2009
Miami
http://www.miamiairport.com/pdfdoc/MDAD_2008_EconomicImpa
ctBrochure.pdf
Airports Commission
PwC 109
3. Local Economy: Literature Review
Title
Author
Year
Airport
and/or
geography
covered
Planning for Economic
Infrastructure
National Audit
Office
2013
UK
http://www.nao.org.uk/wpcontent/uploads/2013/03/Economicinfrastructure-Exec-Summ.pdf
Economic Impact of
Delhi Airport
National
Council of
Applied
Economic
Research
2012
Delhi
http://www.ncaer.org/downloads/Reports/NCAE
R_Airport%20Report_April_2012.pdf
Meta-analysis of
airport noise and
hedonic property
values: problems and
prospects
Nelson
2003
Canada &
USA
http://econpapers.repec.org/article/tpejtecpo/v_3
a38_3ay_3a2004_3ai_3a1_3ap_3a1-27.htm
New York State
Economic Impacts of
Aviation
New York State
Department of
Transportation
2010
New York
State
https://www.dot.ny.gov/divisions/operating/opd
m/aviation/repository/NYS%20Economic%20Stu
dy%202010%20Technical%20Report_0.pdf
JFK Air Cargo Study
NYC Economic
Development
Corporation
2013
New York
City
http://www.nycedc.com/sites/default/files/filema
nager/Projects/Air_Cargo_Study/07JFK_Business_and_Financial_053012_MN.pdf
Tourism Satellite
Account
ONS
2013
UK
http://www.ons.gov.uk/ons/rel/tourism/tourismsatellite-account/index.html
Heathrow related
employment
Optimal
Economics
2011
Heathrow
http://www.heathrowairport.com/static/Heathrow
/Downloads/PDF/Heathrow-RelatedEmployment-Report.pdf
The Case for
Agglomeration
Economies
Overman,
Gibbons &
Tucci
2012
UK
http://www.parisschoolofeconomics.eu/IMG/pdf/
Overman3-PSE-MEEDM.pdf
The economic value of
international
connectivity
Oxford
Economics
2013
World Cities
http://beta.tfl.gov.uk/static/1566634829/cms/documents/economic-value-ofconnectivity-oxford-economics-york-aviation.pdf
Economic Impact of
Stansted Scenarios
Oxford
Economics
2013
London
Stansted
http://lscc.co/wpcontent/uploads/2013/07/OXFORDECONOMICS-STANSTED-FINAL-REPORTNovember-2013.pdf
The Economic
Contribution of the
Aviation Industry in
the UK
Oxford
Economics
2006
UK
http://www.gacag.org/images/gacag/pdf/The%20
Economic%20Contribution%20of%20the%20Aviat
ion%20Industry%20in%20the%20UK.pdf
Impacts of a new hub
airport on upon local
and national economy
Oxford
Economics for
Transport for
London
2013/14
London
http://beta.tfl.gov.uk/cdn/static/cms/documents/i
mpacts-to-the-local-and-national-economy.pdf
Impacts of the closure
and redevelopment of
Heathrow
Oxford
Economics for
Transport for
London
2013/14
Heathrow
http://beta.tfl.gov.uk/cdn/static/cms/documents/i
mpacts-of-closure-and-redevelopment-ofheathrow-airport.pdf
Airports Commission
Link
PwC 110
3. Local Economy: Literature Review
Title
Author
Year
Airport
and/or
geography
covered
Heathrow Employment
Impact Study
Parsons
Brinckerhoff
and Berkeley
Hannover
Consulting
2013
Heathrow
http://www.hounslow.gov.uk/heathrow_employm
ent_impact_study.pdf
Estimating the Costs
and Benefits of
Regional Airport
Subsidies: A
Computable General
Equilibrium Approach
Peter Forsyth
2006
Australia
http://www.garsonline.de/Downloads/060629/Fo
rsyth%20-%20Paper%20%20Regional%20Airport%20Subsidies.pdf
Air Capacity for Sydney
Peter Forsyth
2013
Sydney
http://www.internationaltransportforum.org/jtrc/
DiscussionPapers/DP201302.pdf
Modelling the effect of
airport noise on
residential property
values: an examination
of the Manchester
Airport second runway
Pitt, Michael
and Jones,
Mark
2000
Manchester
plus global
trends
http://www.ingentaconnect.com/content/mcb/06
9/2000/00000018/f0020013/art00001
The London Project
Prime
Minister’s
Strategy Unit
2004
London
http://webarchive.nationalarchives.gov.uk/20070
402085917/http://strategy.gov.uk/work_areas/lo
ndon/index.asp
The Impact of Airport
Noise on Residential
Real Estate
Randall Bell
2001
N/A
http://realestatedamages.com/pdf/AirportNoise.p
df
London Heathrow
Economic Impact
Study
Regeneris
Consulting
2013
Heathrow
http://www.buckstvlep.co.uk/uploads/downloads
%5CHeathrow%20Economic%20Impact%20Asses
sment%20%20-%20Regeneris%20%20Final%20Report%2024%20Sep.pdf
Transport and its
infrastructure
Ribeiro &
Kobayashi
2012
Global
http://www.ipcc.ch/pdf/assessmentreport/ar4/wg3/ar4-wg3-chapter5.pdf
A comparison of the
multipliers of
IMPLAN, REMI and
RIMS II:
Benchmarking readymade models for
comparison
Rickman &
Schwer
1995
USA
http://link.springer.com/article/10.1007%2FBF01
581882
Evidence on the Nature
and Sources of
Agglomeration
Economies
Rosenthal &
Strange
2004
N/A
Handbook of Urban and Regional Economics
Factors affecting the
location of real estate
Rymarzak &
Sieminska
2012
N/A
Journal of Corporate Real Estate, Vol. 14 No. 4, pp.
214-225
Aviation and the
Economy
SDG
2013
UK
https://www.gov.uk/government/publications/air
ports-commission-interim-report
The Economic Impact
of the Aviation
Industry on the New
York – New Jersey
Metropolitan Region
The Port
Authority of
NY & NJ
2005
New York &
New Jersey
http://www.panynj.gov/about/pdf/reg-inaviation-economic-impact.pdf
Airports Commission
Link
PwC 111
3. Local Economy: Literature Review
Title
Author
Review of Heathrow
Employment Impact
Study
Transport for
London
Year
2013/14
Airport
and/or
geography
covered
Link
Heathrow
http://beta.tfl.gov.uk/cdn/static/cms/documents/
review-of-heathrow-employment-study.pdf
Airport Economic
Impact Methods and
Models
Transportation
Research Board
2007
N/A
http://books.google.co.uk/books?id=NuF6lY48RR
UC&lpg=PA24&ots=qVGIF2lGx2&dq=%22techniq
ues%20used%20to%20regionalize%20national%2
0inputoutput%20coefficients%22&pg=PP1#v=onepage&
q=%22techniques%20used%20to%20regionalize%
20national%20inputoutput%20coefficients%22&f=false
Exploring Airport
Employee Commute
and Parking Strategies
Transportation
Research Board
2012
USA/ UK
http://onlinepubs.trb.org/onlinepubs/acrp/acrp_s
yn_036.pdf
The Economic Impact
of Civil Aviation on the
U.S. Economy
U.S. Department
of
Transportation
Federal Aviation
Administration
2011
USA
http://www.faa.gov/air_traffic/publications/medi
a/faa_economic_impact_rpt_2011.pdf
Transportation and
storage sector: skills
assessment
UK
Commission
for
Employment
and Skills
2012
UK
https://www.gov.uk/government/publications/tra
nsportation-and-storage-sector-skills-assessment
Shaping the
Competitive City
Urban Land
Institute/ EY
2014
N/A
http://www.ey.com/Publication/vwLUAssets/EY_
_Infrastructure_2014:_shaping_the_competitive_
city/$FILE/EY-infrastructure-2014-shaping-thecompetitive-city.pdf
Vancouver
International Airport
2010 Economic Impact
Report
Vancouver
Airport
Authority
2011
Vancouver
http://www.yvr.ca/Libraries/2010_Annual_Repor
t/2011_05_12_Economic_Impact_Summary_FIN
AL.sflb.ashx
Inbound Visitor
Statistics
Visit Britain
2014
UK
http://www.visitbritain.org/insightsandstatistics/i
nboundvisitorstatistics/latestdata/
Overview of Land Use
Transport Models
Wegener,
Michael
Global
http://spiekermannwegener.com/pub/pdf/MW_Handbook_in_Trans
port.pdf
The social and
economic impact of
airports in Europe
York Aviation
2004
Europe
https://www.ryanair.com/doc/news/2012/ACIReport.pdf
The Economic Impact
of Edinburgh Airport
York Aviation
2009
Edinburgh
http://www.scotlandsglobalhub.com/media/downl
oads/edinburgh-airport-economic-impact-
Economic Impact of
the MAG Airports:
Update Report
York Aviation
2008
Manchester
http://www.manchester.gov.uk/download/downlo
ads/id/15427/economic_impact_of_the_mag_air
ports_update_report
Airports Commission
PwC 112
3. Local Economy: Literature Review
Title
Author
Year
Economic Effects of
Airports in Central
Europe: A Critical
Review of Empirical
Studies and Their
Methodological
Assumptions
Zak & Getzner
2014
Airports Commission
Airport
and/or
geography
covered
Link
Central
Europe
http://www.hrpub.org/download/20140105/AEB6
-11802008.pdf
PwC 113
© 2014 PricewaterhouseCoopers LLP. All rights reserved. 'PricewaterhouseCoopers' refers to PricewaterhouseCoopers
LLP (a limited liability partnership in the United Kingdom) or, as the context requires, other member firms of
PricewaterhouseCoopers International Limited, each of which is a separate and independent legal entity."


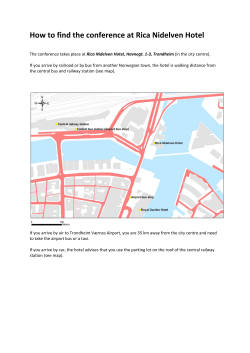
© Copyright 2026