
12291–12305, www.atmos-chem-phys.net/14/12291/2014/ doi:10.5194/acp-14-12291-2014 © Author(s) 2014. CC Attribution 3.0 License.
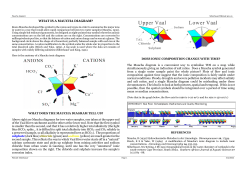
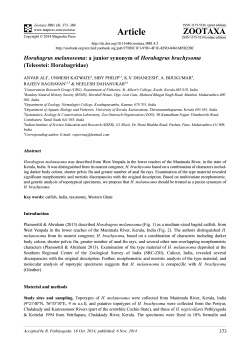
Atmos. Chem. Phys., 14, 12291–12305, 2014
www.atmos-chem-phys.net/14/12291/2014/
doi:10.5194/acp-14-12291-2014
© Author(s) 2014. CC Attribution 3.0 License.
Modeling of HCHO and CHOCHO at a semi-rural site in southern
China during the PRIDE-PRD2006 campaign
X. Li1,2 , F. Rohrer1 , T. Brauers1,† , A. Hofzumahaus1 , K. Lu1,* , M. Shao2 , Y. H. Zhang2 , and A. Wahner1
1 Institut
für Energie- und Klimaforschung Troposphäre (IEK-8), Forschungszentrum Jülich, Jülich, Germany
of Environmental Sciences and Engineering, Peking University, Beijing, China
† deceased
* now at: College of Environmental Sciences and Engineering, Peking University, Beijing, China
2 College
Correspondence to: X. Li ([email protected]) and A. Wahner ([email protected])
Received: 4 December 2013 – Published in Atmos. Chem. Phys. Discuss.: 17 December 2013
Revised: 25 September 2014 – Accepted: 19 October 2014 – Published: 21 November 2014
Abstract. HCHO and CHOCHO are important trace gases in
the atmosphere, serving as tracers of VOC oxidations. In the
past decade, high concentrations of HCHO and CHOCHO
have been observed for the Pearl River Delta (PRD) region in
southern China. In this study, we performed box model simulations of HCHO and CHOCHO at a semi-rural site in the
PRD, focusing on understanding their sources and sinks and
factors influencing the CHOCHO to HCHO ratio (RGF ). The
model was constrained by the simultaneous measurements of
trace gases and radicals. Isoprene oxidation by OH radicals
is the major pathway forming HCHO, followed by degradations of alkenes, aromatics, and alkanes. The production
of CHOCHO is dominated by isoprene and aromatic degradation; contributions from other NMHCs are of minor importance. Compared to the measurement results, the model
predicts significant higher HCHO and CHOCHO concentrations. Sensitivity studies suggest that fresh emissions of precursor VOCs, uptake of HCHO and CHOCHO by aerosols,
fast vertical transport, and uncertainties in the treatment of
dry deposition all have the potential to contribute significantly to this discrepancy. Our study indicates that, in addition to chemical considerations (i.e., VOC composition,
OH and NOx levels), atmospheric physical processes (e.g.,
transport, dilution, deposition) make it difficult to use the
CHOCHO to HCHO ratio as an indicator for the origin of
air mass composition.
1
Introduction
The degradation of directly emitted volatile organic compounds (VOCs) results in the formation of ozone (O3 )
and secondary organic aerosols (SOAs) in the troposphere
(Finlayson-Pitts and Pitts, 2000). This process consists of
the oxidation of VOCs by hydroxyl radical (OH), O3 , and
nitrate radical (NO3 ). Detailed understanding of the VOCs’
degradation mechanism is challenged by the co-existence of
vast variety of VOC species in the atmosphere. However,
investigations on ubiquitous oxidation intermediates, e.g.,
formaldehyde (HCHO) and glyoxal (CHOCHO), can help
us to test and improve the current knowledge of the VOCs’
sources and degradation pathways.
HCHO is the most abundant carbonyl compound in the
atmosphere. Maximum HCHO concentrations can reach
100 ppb in polluted areas whereas sub-ppb levels are found
in remote areas (Finlayson-Pitts and Pitts, 2000). Most of
HCHO is produced during the oxidation of organic compounds (Fortems-Cheiney et al., 2012). While methane
(CH4 ) oxidation by OH radicals is the major source of
HCHO in remote areas, the HCHO production in regions
(e.g., forest, urban area) with elevated non-methane hydrocarbons (NMHCs) (i.e., alkanes, alkenes, aromatics, isoprene, and terpenes) is dominated by their degradation. Direct emissions of HCHO originate mainly from fossil fuel
combustion (Schauer et al., 1999, 2002), biomass burning
(Lee et al., 1997), and vegetation (DiGangi et al., 2011), but
are usually of minor importance (Parrish et al., 2012). The
known removal pathways of HCHO in the atmosphere are
Published by Copernicus Publications on behalf of the European Geosciences Union.
12292
X. Li et al.: Modeling of HCHO and CHOCHO in China
reaction with OH, photolysis, and dry / wet deposition. Heterogeneous uptake by cloud droplets and aerosols is speculated to be an additional sink of HCHO, which could contribute to the HCHO destruction (Zhou et al., 1996; Tie et al.,
2001; Fried et al., 2003a). However, the existence of this process in the lower troposphere is still under discussion. Laboratory experiments indicate reactive loss of HCHO can happen on surfaces of H2 SO4 aerosols (Jayne et al., 1996), mineral dust aerosols (Sassine et al., 2010), and organic aerosols
(Li et al., 2011). Field observations by Wang et al. (2010)
suggest an uptake of HCHO by aerosols in the presence
of amines (or ammonia) and carbonyl compounds. HCHO
oligomerization is also proposed to contribute to the partitioning of gaseous HCHO to aerosol phase (Toda et al.,
2014). But, during a chamber study, Kroll et al. (2005) did
not find any growth of both neutral ((NH4 )2 SO4 ) and acidic
(NH4 HSO4 ) aerosols in the presence of gaseous HCHO, suggesting that the uptake of HCHO by aerosols is unlikely taking place. Although numerical simulations of HCHO, either
by multi-dimensional models or box models, can in some
cases reproduce HCHO observations (Wagner et al., 2001;
Fried et al., 2003b; MacDonald et al., 2012), significant discrepancies between modeled and measured HCHO concentration have been frequently found (Choi et al., 2010; Fried
et al., 2011, and references therein). The model underestimation can arise from the following: deviation from the steadystate assumption (Fried et al., 2003a), direct emissions and
their transport (Fried et al., 2011), missing consideration of
HCHO production from unmeasured precursors (Kormann
et al., 2003; Choi et al., 2010), etc. If the steady-state assumption is disturbed, e.g., in the vicinity of fresh emissions,
the model can also overpredict the measured HCHO concentration (Fried et al., 2011).
CHOCHO is the smallest dicarbonyl compound in the atmosphere. Ambient concentration of CHOCHO ranges from
tens of ppt in remote and rural areas to ≈1 ppb in heavy polluted urban regions (e.g., Volkamer et al., 2007; Washenfelder et al., 2011; DiGangi et al., 2012). Compared to
HCHO, CHOCHO has nearly no primary sources except
biomass burning and biofuel combustion. Globally, isoprene
and ethyne are the major precursors of CHOCHO (Fu et al.,
2008). While local CHOCHO production is dominated by
aromatics degradation in urban or sub-urban areas (Volkamer
et al., 2007; Washenfelder et al., 2011), significant contributions from 2-methyl-3-buten-2-ol (MBO) and isoprene oxidation are identified for rural areas (Huisman et al., 2011).
Removal of gaseous CHOCHO is driven by reaction with
OH, photolysis, deposition, and loss on aerosol surfaces (Fu
et al., 2008). By comparing CHOCHO column densities derived from a global model simulation to satellite observations, Myriokefalitakis et al. (2008) and Stavrakou et al.
(2009) speculate of a missing global source of CHOCHO.
Similar study performed recently by Liu et al. (2012) suggests that the missing CHOCHO sources in China is most
likely due to the underestimation of aromatics in the VOC
emission inventory. As first indicated by Volkamer et al.
(2007), if loss of CHOCHO on aerosol surfaces is not taken
into account, models can substantially overestimate measured CHOCHO concentrations. Laboratory studies found
that uptake of CHOCHO by aerosols is mainly through polymerization process and is related with the acidity and the
ionic strength within the aqueous phase of aerosols (Jang and
Kamens, 2001; Liggio et al., 2005; Kroll et al., 2005). Once
CHOCHO is taken up by aerosols, it can contribute to the formation of secondary organic aerosols (Volkamer et al., 2007;
Tan et al., 2009; Washenfelder et al., 2011).
Given that HCHO and CHOCHO have similar sinks but
different sources, the CHOCHO to HCHO ratio (RGF ) has
been proposed to be a tracer of changes of VOC mixture
in the atmosphere. Based on satellite observations, Vrekoussis et al. (2010) conclude that regions with RGF lower
than 0.045 are under influence of anthropogenic emissions,
whereas RGF higher than 0.045 often indicates that VOC
emissions mostly originate from biogenic sources. Average
RGF up to 0.2–0.4 were observed by MacDonald et al. (2012)
in an Asian tropic forest. However, after analyzing the measured RGF and relevant trace gases at a rural site, DiGangi
et al. (2012) found that higher RGF corresponded to increased
anthropogenic impact on local photochemistry.
The Pearl River Delta (PRD) region located in southern China has been identified by satellite observations as
the region with high levels of HCHO and CHOCHO (Wittrock et al., 2006; Vrekoussis et al., 2010). Yet simultaneous ground-based measurements of HCHO and CHOCHO
in this region are quite limited. During the PRIDE-PRD2006
campaign, which was dedicated to the understanding of the
formation mechanism of O3 and SOA in this heavy polluted region, we performed 1 month of continuous MAXDOAS observations for HCHO and CHOCHO at a semirural site in the PRD (Li et al., 2013). The measured HCHO
and CHOCHO concentrations as well as RGF were as high
as those obtained in other urban environments. Simultaneous
measurements of HOX (= OH + HO2 ) radicals, trace gases,
and aerosols suggest highly active photochemistry under the
influence of both anthropogenic and biogenic emissions (Lou
et al., 2010; Hu et al., 2012; Lu et al., 2012). In this paper,
we will focus on investigating the production and destruction pathways of HCHO and CHOCHO during the PRIDEPRD2006 campaign, and try to understand the change of RGF
with the change of air mass compositions.
Atmos. Chem. Phys., 14, 12291–12305, 2014
2
2.1
Approach
Field measurements
The PRIDE-PRD2006 field campaign took place in July
2006 in the Pearl River Delta (PRD) region in southern
China within the framework of the “Program of Regional
Integrated Experiments of Air Quality over the Pearl River
www.atmos-chem-phys.net/14/12291/2014/
X. Li et al.: Modeling of HCHO and CHOCHO in China
12293
Delta” (PRIDE-PRD2006). Field measurements of HOX radicals, trace gases, aerosols, and meteorological parameters
were performed at a semi-rural site called “Back Garden”
(BG, 23.50◦ N, 113.03◦ E), which is located at the northern edge of PRD. While big cities (i.e., Zhaoqing, Foshan,
Guangzhou, and Dongguan) are located tens of kilometers
south of the BG site, to the north of the BG site are small
towns close to mountain areas. These mountain areas are typically covered by evergreen broad-leaf forest. The BG site
is next to a water reservoir and is surrounded by farmland
(peanuts, lychees, trees, small forests).
Concentrations of HCHO and CHOCHO were retrieved
from MAX-DOAS scattered sunlight measurements at six
elevation angles. Since the concentration retrieval has been
described in detail in Li et al. (2013), only a brief outline
follows. During the retrieval, HCHO and CHOCHO are assumed to be well-mixed in a layer with height H . The vertical column density (VCD) and H are retrieved by comparing measured differential slant column densities (DSCDs) to
those simulated by a radiative transfer model (RTM). Using
the retrieved VCDs and H , mean mixing ratios of HCHO
and CHOCHO in the well-mixed layer were calculated. In
order to exclude the influence of clouds on the concentration retrieval, we only consider observations during cloudfree days. The errors of the retrieved HCHO and CHOCHO
mixing ratios consist of statistical errors which arise mainly
from the uncertainty of the measured DSCDs, and systematic
errors which originate from the uncertainty of the RTM input
parameters (e.g., aerosol optical depth, aerosol single scattering albedo, aerosol asymmetry factor under the Henyey–
Greenstein approximation) and of the DSCD simulation. The
systematic error is estimated to be around 35 %.
The MAX-DOAS measurements were performed in parallel with ground-based in situ measurements of CO, CH4 , C3–
C12 NMHCs, NOx (= NO + NO2 ), O3 , aerosol physical and
chemical properties, photolysis frequencies, relative humidity, and pressure on top of a hotel building (10 m a.g.l.). Simultaneously, measurements of HOx radicals, HONO, temperature, and 3d-wind were performed on top of two stacked
sea containers around 20 m away from the hotel building.
Details of these measurements were described in separate
papers (Lu et al., 2012, and references therein). Instrumentation, time resolution, and accuracy for parameters used in
this study are listed in Supplement Table S1.
pressure. Concentrations of ethane, ethene, and ethyne were
fixed to 1.5 ppb, 3 ppb, and 1.7 ppb, respectively, estimated
from few canister samples. H2 mixing ratio was assumed to
be 550 ppb. An additional loss process with a lifetime (τD )
of 24 h was assumed for all calculated species. This lifetime
corresponds to a dry deposition velocity of 1.2 cm s−1 and a
well-mixed boundary layer height of about 1 km. The model
was operated in a time-dependent mode for the entire campaign period (5–25 July), with 30 min time resolution and
a 2-day spin-up time. For periods when measured NMHCs
data were not available, values were taken from the campaign
mean diurnal variation. With regard to missing OH values,
they are estimated from the measured photolysis frequency
of O3 (JO1D ) using the empirical formula described by Lu
et al. (2012). The model run with the above settings represents the current understanding on the HCHO and CHOCHO
chemistry at the BG site, based on available precursor measurements. This base case scenario is called M0 in the text
and figures. In order to investigate to which extent the model
can reproduce the HCHO and CHOCHO measurements, different model scenarios were setup by including additional
mechanisms in M0. Table 1 gives an overview of the employed model scenarios. In this study, we only focus on those
6 days when HCHO, CHOCHO, NMHCs, and OH measurements were available, i.e., 12–13, 20–21, and 24–25 July.
2.2
Model description
Concentrations of HCHO and CHOCHO were calculated
by a zero-dimensional box model using the Master Chemical Mechanism (MCM) Version 3.2 (http://mcm.leeds.ac.
uk/MCM/). The model includes the full MCM chemistry
for all measured NMHCs and their oxidation products. The
model calculations were constrained to measurements of
OH, NO, NO2 , HONO, O3 , CO, CH4 , C3–C12 NMHCs,
photolysis frequencies, relative humidity, temperature, and
www.atmos-chem-phys.net/14/12291/2014/
2.3
Model uncertainty
The uncertainty of the model simulation of HCHO and
CHOCHO can arise from the uncertainty of (1) measured
trace gas concentrations, (2) measured meteorological parameters, i.e., photolysis frequencies J , temperature T , and
pressure P , (3) reaction rate constants k used in the model,
and (4) the lifetime τD for dry deposition. Using the same
uncertainty factors listed in Table S7 in Lu et al. (2012), we
run the model base case (M0) for n times (n equals to the
number of parameters been considered). During each model
run, the value of the considered parameter is multiplied by
its uncertainty factor. The model uncertainty is estimated by
error propagation from the errors of all considered parameters. Gaussian error propagation was applied within each of
the first three groups. The total model errors were then calculated conservatively by linear addition of the errors from all
four groups. The mean diurnal variation of the uncertainty
of the modeled HCHO and CHOCHO by the model base
case is shown in Fig. S2. On average, modeled HCHO and
CHOCHO concentrations in the model base case had an uncertainty of around 55 %.
3
3.1
Results
Measurements overview
The entire PRIDE-PRD campaign was characterized by
tropical conditions with high temperature (28–36 ◦ C), high
Atmos. Chem. Phys., 14, 12291–12305, 2014
12294
X. Li et al.: Modeling of HCHO and CHOCHO in China
Table 1. Model scenarios used in the sensitivity study of HCHO and CHOCHO simulation during the PRIDE-PRD2006 campaign.
Simulation
Mechanisms
Purpose
M0
M1
MCM v3.2 with τD = 24 h
as M0, but (1) change τD to 3 h for the time period of 06:00–
19:00 in 13, 24, and 25 July, (2) decrease isoprene concentration to 52 % of the measured value for the period of 8:00–
16:00, and (3) include measured PANs as model constraints
as M1, but replace τD of HCHO and CHOCHO by τdepo. =
vdepo.
−1 and 0.3 cm s−1 for HCHO
BLH . vdepo. is set to 1 cm s
and CHOCHO, respectively.
as M2, but add removal of all species by vertical dilution for
the period of 06:00–10:00, with rate constant of 0.41 h−1
as M3, but include uptake of HCHO and CHOCHO by
γ ×Saw ×v×C ∗
aerosols, i.e., dC
, with an uptake coefdt = −
4
ficient γ of 10−3
Base run
Influence of source terms
M2
M3
M4
Influence of dry deposition
Influence of vertical dilution
Influence of heterogeneous uptake
∗ C , v , and γ are the gas phase concentration, mean molecular velocity, and uptake coefficient, respectively. S
aw is the RH corrected aerosol surface
concentration.
humidity (60–95 % RH), and high solar radiation (indicated
by noontime JNO2 of (5–10) × 10−3 s−1 ) (Li et al., 2012).
These meteorological conditions, together with the prevailing emissions of air pollutants, are in favor of the high photochemical reactivity in the PRD region, which can be reflected
by the measured high OH concentrations (noontime value of
1.5 × 107 cm−3 ) and HOx turnover rate (3 × 108 cm−3 s−1
around noon) (Hofzumahaus et al., 2009). For the 6 cloudfree days in this study, Fig. 1 shows the time series of measured wind speed, wind direction, OH reactivities of C2–C12
NMHC ), OH concentrations, aerosol (PM ) surface
NMHC (kOH
10
concentrations, aerosol (PM1) compositions, and HCHO and
CHOCHO concentrations. The wind speeds were generally
below 3 m s−1 . According to the wind direction, air masses
arriving at the BG site were mainly from two directions, i.e.,
south on 20 and 21 July north on 13, 24, and 25 July. On
12 July, the wind was from north in the first night, and became south during daytime, and changed back to north after
NMHC were around 20 s−1 and norsunset. Peak values of kOH
mally occurred at night. Compared to southern wind days,
NMHC with average values of 5.6–6.7 s−1 were obelevated kOH
served in the period of 09:00–18:00 in northern wind days,
which was mainly attributed to the higher isoprene concentrations. This is consistent with the fact that north of BG site
is close to forest areas and air masses from north are therefore
influenced by biogenic emissions. However, average OH reactivities of anthropogenic NMHC for the same period were
Alkene ≈ 1.2 s−1 , regardnearly the same in the 6 days, e.g., kOH
less of the origin of air masses. OH concentrations also do
not show big difference in the 6 days, with peak values of
1.5 × 107 cm−3 around noon and values of 0–1 × 106 cm−3
during night. The aerosol (PM1) composition measurements
found that almost half of the sub-micron aerosol mass consisted of organics, and the the next most found substance was
sulfate. On 24 and 25 July when strong combustion events
Atmos. Chem. Phys., 14, 12291–12305, 2014
happened in the surrounding areas, the aerosol mass and surface concentrations were significantly higher than in other
days. The occurrence of the combustion events can be indicated by the increase of Cl− concentration in PM1 (Hu
et al., 2012). This Cl− increase is identified in the early
morning of 13, 24, and 25 July and around mid-night of 25
Alkene was also observed in the combusJuly. Increase of kOH
tion periods. In the 6 cloud-free days, the measured average concentrations of HCHO and CHOCHO were 7.3 ppb
and 0.37 ppb, respectively. Elevated HCHO and CHOCHO
concentrations were observed during periods when combustion events were prevailing. Diurnal variability of HCHO and
CHOCHO was not very prominent. After excluding the periods influenced by combustion events, a slight increase of
HCHO concentrations can be found from early morning to
12:00, whereas CHOCHO concentrations are almost stable
at around 0.3 ppb.
3.2
HCHO and CHOCHO simulation by the model
base case
The simulated HCHO and CHOCHO concentrations from
the model base case (M0) are shown in Fig. 2. Neither the observed diurnal variation nor the concentration can be well reproduced by the model. The model predicts HCHO maxima
occurring at around 09:00 with concentrations of 30–40 ppb,
followed by decrease of HCHO concentration to 10–25 ppb
from late morning to afternoon. In the afternoon, the simulated HCHO are separated into two groups; higher calculated
concentrations are found when the wind is coming from the
north of the BG site. This phenomenon also exists for the
modeled CHOCHO. In general, the model base case overpredicts HCHO and CHOCHO concentrations by factors of
2–6. While the measurements did not find prominent diurnal
variation of CHOCHO/HCHO ratios (RGF ), the model shows
www.atmos-chem-phys.net/14/12291/2014/
X. Li et al.: Modeling of HCHO and CHOCHO in China
Fig. 1.
12295
NMHC ), OH, aerosol
Figure 1. Time series of wind speed (WS), wind direction (WD), OH reactivity of measured C3–C12 NMHCs (kOH
(PM10 ) surface concentration (Saw , i.e., Sa corrected for hygroscopic growth), aerosol (PM1) compositions, HCHO, and CHOCHO for the
6 cloud-free days during the PRIDE-PRD2006 campaign. Saw is the RH corrected aerosol surface concentration, i.e., Saw = Sa × f (RH) =
(2008).
Sa × (1 +series
a × (RH)
The empirical
factors
a and wind
b used todirection
estimate f (RH)
were set
to 2.06
and 3.6 as described
by Liu et al.C3
Time
ofb ).wind
speed
(WS),
(WD),
OH
reactivity
of measured
– C12
NMHCs
NMHC
(kOH
), OH, aerosol (PM10) surface concentration (Saw , i.e., Sa corrected for hygroscopic growth), aerosol
(PM1) compositions, HCHO, and CHOCHO for the 6 cloud-free days during the PRIDE-PRD2006 campaign.
www.atmos-chem-phys.net/14/12291/2014/
Atmos. Chem. Phys., 14, 12291–12305, 2014
Saw is the RH corrected aerosol surface concentration, i.e., Saw = Sa × f (RH) = Sa × (1 + a × (RH)b ).
The empirical factors a and b used to estimate f (RH) were set to 2.06 and 3.6 as described by Liu et al. (2008).
12296
X. Li et al.: Modeling of HCHO and CHOCHO in China
Figure 2. Measured and modeled HCHO, CHOCHO, and CHOCHO/HCHO ratios (RGF ) for the 6 cloud-free days during the PRIDEPRD2006 campaign. The modeled values are from the model base case (M0). The error bar refers to the 1σ statistic error of the measurements.
Fig. 2. Measured and modeled HCHO, CHOCHO, and CHOCHO/HCHO ratios (RGF ) for the 6 cloud-free
days during
campaign.
The
values areproduction
from the model
base-case
(M0). The
of HCHO
and CHOCHO
in the
a decrease
of RGF the
fromPRIDE-PRD2006
morning to noon and
stable RGF
val-modeledMaximum
model
always
occurs
at
around
noon,
coinciding
with
the
ues in
the
afternoon
(Fig.
2).
Compared
to
the
discrepancy
error bar refers to the 1σ statistic error of the measurements.
peak of OH concentrations. We investigated the production
for the HCHO and CHOCHO concentrations, the RGF calof HCHO and CHOCHO from the oxidation of NMHCs by
culated by the model (0.075 ± 0.024) is only slightly higher
different oxidants (i.e., OH, O3 , and NO3 ). In general, OH
than that by the measurements (0.059 ± 0.024).
initiated oxidation of NMHCs accounts for most of the local
The contribution of different measured NMHCs to the proproduction rate of HCHO and CHOCHO (> 95 %) throughduction of HCHO and CHOCHO in the model base case is
out the day; ozonolysis and oxidation by NO3 are of minor
shown in Fig. 3. On average, isoprene oxidation contributes
importance. Compared to HCHO, we did not find any contrimost to the HCHO production (43 %), followed by the oxidabution of ozonolysis of alkenes to the CHOCHO formation.
tion of alkenes (29 %), aromatics (15 %), and alkanes (13 %).
With regard to the oxidation of NMHCs by NO3 , its conFor CHOCHO, half of its production is due to isoprene oxtribution to the CHOCHO production is larger than to the
idation, and the other half is dominated by aromatics oxiHCHO production. The nighttime production of HCHO and
dation. The contributions of alkanes, alkenes, and ethyne to
CHOCHO from OH initiated oxidation of NMHCs results in
the total CHOCHO production are in total less than 10 %.
The top-10 precursor NMHCs of HCHO and CHOCHO in
the maximum concentration of HCHO and CHOCHO occurring in early morning hours. Without existence of OH during
terms of their production rate are listed in Table 2. Comnight, the lifetime of HCHO and CHOCHO in the model is
pared to similar studies (e.g., Volkamer et al., 2010; Huisman et al., 2011; Washenfelder et al., 2011; MacDonald
determined by dry deposition (i.e., τD = 24 h), and the proet al., 2012; Parrish et al., 2012), anthropogenic and biogenic
duction of HCHO and CHOCHO from O3 and NO3 reactions
is quite small. Therefore, modeled HCHO and CHOCHO
sources contribute almost equally to the chemical formation
of HCHO and CHOCHO at the BG site. However, producconcentrations during night are determined mainly by the
tion of HCHO and CHOCHO from anthropogenic precursors
concentrations the day before. In a model run with nighttime
is larger than from isoprene before noon; in the afternoon, the
OH concentration fixed to zero, compared to the model base
case results, HCHO and CHOCHO show much lower concontribution of isoprene to HCHO and CHOCHO production
centrations during night and reach their peak concentration
becomes higher than from anthropogenic NMHCs. This diurnal variation is the result of the change of air mass composiat a later time (≈2 h) (Fig. S3).
In the model base case, the destruction of HCHO and
tion, i.e., from anthropogenically to biogenically dominated.
3. Production
HCHO andduring
CHOCHO
NMHCs
in the
base-case
(M0)reacCHOCHO
canprecursors
be expressed
as model
the sum
of first order
The Fig.
transition
of air massofcomposition
daytimefrom
at thedifferent
BG site has also been illustrated by Lu et al. (2012) during
tion rates of reaction with OH, photolysis, and dry deposifor the 6 cloud-free days during the PRIDE-PRD2006 campaign. HCHO
the analysis of the HOx budget.
tion, i.e., kd
and kdCHOCHO . It is found that reaction with
Atmos. Chem. Phys., 14, 12291–12305, 2014
www.atmos-chem-phys.net/14/12291/2014/
25
X. Li et al.: Modeling of HCHO and CHOCHO in China
12297
Table 2. Top-10 precursor NMHCs of HCHO and CHOCHO for the 6 cloud-free days during the PRIDE-PRD2006 campaign.
NMHCs
PHCHO ppb h−1
Isoprene
Propene
Ethene
Stryrene
Methane
m-Xylene
1-Butene
trans-2-Butene
Toluene
cis-2-Butene
3.85
0.97
0.67
0.24
0.30
0.33
0.17
0.18
0.21
0.15
NMHCs
43.2
12.8
8.2
6.1
4.2
3.2
2.5
2.2
1.9
1.7
Isoprene
Toluene
Ethylbenzene
m-Xylene
Ethene
Benzene
o-Xylene
Ethyne
1,2,4-Trimethylbenzene
o-Ehtylbenzene
Table 3. Relative changes of HCHO and CHOCHO mixing ratio and RGF under different model simulations (Table 1) for the
PRIDE-PRD2006 campaign. When the model scenario is changing
from Mi to Mj (i, j ∈ [0, 4]), the relative change in percentage is
calculated as % = 100 × (Mj − Mi )/Mi .
Model
Time period
M0 → M1
06:00–18:00
06:00–10:00
10:00–18:00
06:00–18:00
06:00–10:00
10:00–18:00
06:00–18:00
06:00–10:00
10:00–18:00
06:00–18:00
06:00–10:00
10:00–18:00
06:00–18:00
06:00–10:00
10:00–18:00
M1 → M2
M2 → M3
M3 → M4
M0 → M4
Relative change in %
HCHO CHOCHO RGF
−49
−41
−53
−16
−34
−7
−25
−36
−19
−49
−66
−40
−84
−92
−80
−37
−22
−44
−7
−16
−3
−30
−40
−26
−45
−71
−32
−79
−89
−74
22
31
18
13
30
4
−8
−7
−9
4
−14
13
30
38
26
OH and photolysis are responsible for 90 % of the HCHO and
CHOCHO removal during daytime. During night, HCHO
and CHOCHO are removed mainly by dry deposition (60 %);
the observation of nighttime OH with concentrations of
around 106 cm−3 accounts for the rest. The lifetime of
HCHO (reciprocal of kdHCHO ) is more than 10 h during night
and decreases to around 1.3 h at noon. CHOCHO has a similar lifetime as HCHO during the campaign.
www.atmos-chem-phys.net/14/12291/2014/
PCHOCHO ppb h−1
%
4
4.1
0.37
0.17
0.04
0.04
0.03
0.03
0.02
0.02
0.01
0.004
%
51.5
22.0
5.2
5.1
4.2
4.0
2.8
2.4
1.3
0.5
Discussion
Reconciliation between the modeled and the
measured HCHO and CHOCHO
Compared to the model base case results, our measurements
at the BG site show much lower concentrations of HCHO
and CHOCHO which can not be explained by the uncertainties of model and measurements. Moreover, observed concentrations in the afternoon hours do not separate into different groups. To identify the explanation for these discrepancies, we performed a number of sensitivity model runs (Tables 1 and S2). Given that direct emissions of HCHO and
CHOCHO are not considered in the model, periods which
are under the influence of local emissions (i.e., early morning of 13, 24, and 25 July) are excluded from the analysis in
this section.
The simulated HCHO and CHOCHO concentrations in
the model are determined by their production and destruction processes. The employed box model could inherently
overestimate the yield of HCHO and CHOCHO in the oxidation of different NMHCs. In the model base case, isoprene,
alkenes and aromatics are the major precursors of HCHO and
CHOCHO (Fig. 3). Firstly, when strong emission sources of
these NMHCs exist in the nearby area, the model might not
be in steady state resulting in an overestimation of secondary
products. Secondly, HCHO and CHOCHO concentrations
derived from MAX-DOAS measurements represent the average value over a certain horizontal and vertical space. During the 6 cloud-free days, as estimated from the MAX-DOAS
measured boundary layer height (BLH) and the visibility inside the boundary layer, the horizontal and vertical extension
of the observation volume were both within ≈2 km (Li et al.,
2010). If the air mass in this volume was not well mixed, different HCHO and CHOCHO production rates compared to
the rates calculated from the locally measured OH, NMHCs,
etc. would be the consequence. Since HCHO and CHOCHO
are mainly coming from the reaction of OH with NMHCs,
the above effects can be tested through the sensitivity of the
Atmos. Chem. Phys., 14, 12291–12305, 2014
12298
X. Li et al.: Modeling of HCHO and CHOCHO in China
Figure 3. Production of HCHO and CHOCHO from different NMHCs precursors in the model base case (M0) for the 6 cloud-free days
during the PRIDE-PRD2006 campaign.
Fig. 3. Production of HCHO and CHOCHO from different NMHCs precursors in the model base-case (M0)
for the 6 cloud-free days during the PRIDE-PRD2006 campaign.
modeled HCHO and CHOCHO on both (1) different τD valshort-lived NMHCs have strong vertical gradients due to verues and (2) different OH and NMHC concentrations.
tical mixing. At around noon, the typical mixing time for
The parameter τD can be used as a scale of the generic
a species in a well developed convective boundary layer is
removal of species included in the model. The shorter the
about 15 min (c.f. Stull, 1988). Given the observed noonτD , the faster the removal, resulting in less reaction time
time OH concentration of 1.5 × 107 cm−3 , this mixing time
1t (i.e., similar to the photochemical age as used by Fried
is longer than the lifetime of isoprene (≈ 10 min) but is much
et al. (2011)) and less oxidation products of primary emitted 25 shorter than the lifetime of aromatics and other alkenes at the
NMHCs. As described by Lou et al. (2010), oxidation prodBG site. Therefore, it has to be expected that isoprene emitted at ground level would not be well-mixed in the boundary
uct of the measured NMHCs account for more than 50 % of
layer within its lifetime. Assuming a vertical exponential dethe measured total OH reactivity (kOH ) at the BG site. Therecay of the isoprene concentration in the boundary layer and
fore, once τD deviates from the real value, modeled kOH will
using the measured noontime BLH of around 2 km, the efbecome different than measured kOH . While τD = 24 h, good
fective average isoprene concentration in the boundary layer
agreement between modeled and measured kOH is found in
is estimated to be only 52 % of the measured value at ground
most periods during the campaign. However, on 13, 24, and
(i.e., the value used in the model base case). For the time
25 July when strong isoprene emission existed at the north
period when convective mixing is strong, i.e., 08:00–16:00,
of the BG site, the value of τD during daytime needs to be
we reduced the isoprene concentration in the model to 52 %
reduced to 3 h to let the modeled kOH match the measured
of the measured value. Compared to the model base case,
kOH (Fig. S4), indicating the shorter photochemical age of
this change results in an average decrease of modeled HCHO
the measured air mass in these than in the other time periods. It is most likely that the air mass with freshly emitted
and CHOCHO concentration by 15 % for this time period
(Fig. S5). The decrease is larger (up to 35 %) for days when
isoprene was not photochemically degraded when it was dethe BG site was influenced by strong isoprene emissions (i.e.,
tected. Decrease of τD from 24 h to 3 h results in an average decrease of modeled daytime (06:00–18:00) HCHO and
13, 24, and 25 July).
CHOCHO concentrations by 31 % of the values in the model
Together with the formation of HCHO and CHOCHO,
base case (Fig. S4).
hydroperoxides (e.g., H2 O2 , CH3 OOH), and peroxyacyl nitrates (PANs) are produced in the oxidation of NMHCs. So,
Decrease of OH concentration by 20 % can result in a maxusing these measurement results as additional constraints in
imum decrease of modeled HCHO and CHOCHO concentration by 16 % and 20 %, respectively. The reconciliation bethe model, the prediction of NMHC oxidation processes can
be improved (Kormann et al., 2003). It is found that the
tween modeled and measured HCHO (CHOCHO) concentration would require OH concentration to be decreased to
model run with measured H2 O2 and CH3 OOH gives nearly
< 30 % of the measured value (Fig. S3). Similar sensitivity
the same HCHO and CHOCHO concentrations as in the
results are found for the NMHC concentrations (Fig. S5).
model base case (Fig. S6). Including measured PANs in the
Within ≈2 km along the MAX-DOAS viewing direction, the
model can only lead to a maximum reduction of modeled
land is covered homogeneously by trees. It is unlikely that
HCHO concentration by 30 % (Fig. S7). Modeled HCHO
OH or NMHC concentrations differ by a factor of 2–3 from
and CHOCHO seem not to be sensitive to the change of hythe local measurements. However, it is possible that some
droperoxide and PAN abundances.
Atmos. Chem. Phys., 14, 12291–12305, 2014
www.atmos-chem-phys.net/14/12291/2014/
X. Li et al.: Modeling of HCHO and CHOCHO in China
12299
Figure 4. Sensitivity analysis of HCHO and CHOCHO simulation for the 6 cloud-free days during the PRIDE-PRD2006 campaign. Dates
color coded in red are the days which were influenced by local combustion events. The blue dots are the measured concentrations with error
Fig. 4. Sensitivity
analysis
and CHOCHO
simulation
the 6orange,
cloud-free
therepresent
PRIDE-the modeled
bars indicating
the 1σ statistic
error of
of HCHO
the measurements.
Symbols
with colorfor
black,
green,days
gray,during
and red
concentrations
by
model
base
case
(M0),
and
M1–M4,
respectively.
Detailed
model
settings
are
described
in
Table
1
in
text.
PRD2006 campaign. Dates color coded in red are the days which were influenced by local combustion the
events.
The blue dots are the measured concentrations with error bars indicating the 1σ statistic error of the measureBy using
isoprene
concentrations
ments
have an
10 %, they can
have a minor
D values
ments.modified
Symbolsτwith
colorand
black,
orange,
green, gray, and red
represent
theaccuracy
modeledof
concentrations
byonly
model
in the model, and by including PAN measurements as addiinfluence on the overestimation.
(M0), and(model
M1 – M4,
respectively.
Detailed
model settings
are described
in Table
in the
text. in the model by
tional base-case
model constraints
scenario
M1), the
modeled
Dry deposition
of trace
gases1 was
included
HCHO (CHOCHO) concentrations during daytime (06:00–
a constant lifetime τD = 24 h, which corresponds to a depo18:00) decrease by 67 % (60 %) of the values in the model
sition velocity of 1.6 cm s−1 when taking the average meabase case for 13, 24, and 25 July and by 31 % (13 %) for 12,
sured daytime BLH of 1.4 km. The reported deposition ve20, and 21 July. Given the uncertainties of model and mealocities of HCHO and CHOCHO are 0.05–1 cm s−1 (Stickler
surements, the model results agree with the measurements of
et al., 2006) and 0.15–0.3 cm s−1 (c.f., Washenfelder et al.,
13, 24, and 25 July but are still twice as high as the measured
2011), respectively. Though the average loss of HCHO and
values for 12, 20, and 21 July (Fig. 4). Therefore, the uncerCHOCHO through dry deposition in the model base case is
tainties of the production terms of HCHO and CHOCHO in
faster than reported, it does not take the diurnal variation of
the model can only partly explain the discrepancy between
boundary layer into account. During night, assuming a BLH
of 100 m, a deposition velocity of 1 cm s−1 results in a lifemodeled and measured concentrations. As a consequence,
time of 2.8 h which is an order of magnitude shorter than the
HCHO and CHOCHO sink terms are most likely underestimated by the model.
τD of 24 h. This means the loss of HCHO and CHOCHO durMissing HCHO and CHOCHO sinks can originate either
ing night should be faster than the model base case predicted.
from the range of the existing HCHO and CHOCHO destrucBased on the model scenario M1, we replaced the constant
τD of HCHO (CHOCHO) by a time dependent lifetime caltion terms in the model (i.e., reaction with OH, photolysis,
culated from the measured BLH (assume nighttime value of
and dry deposition), or from horizontal advection, vertical
dilution, or loss on aerosol surfaces which are not considered
100 m) and a deposition velocity of 1 cm s−1 (0.3 cm s−1 )
(model scenario M2). As shown in Fig. 4, for morning hours
in the model.
We showed above that the sensitivity of modeled HCHO
(06:00–10:00), the calculated HCHO and CHOCHO concenand CHOCHO on the change of OH concentration can not
trations by the model scenario M2 decrease by 34 % and
explain the overestimation of HCHO and CHOCHO concen16 % of the values by the model scenario M1, respectively.
tration. Since all days mentioned in this paper showed clearHowever, the influence of dry deposition on the modeled
HCHO and CHOCHO is marginal during the afternoon.
sky conditions, the photolysis frequency measurements were
representative
enough
for of
themodeled
entire MAX-DOAS
If the
air mass
MAX-DOASand
was inhomoFig. 5. Time
series
RGF (by the observamodel base-case),
measured
NOdetected
and NO2byconcentrations
tion volume. Given that the photolysis frequency measuregeneously mixed, the HCHO and CHOCHO concentrations
NMHC compositions for the 6 cloud-free days during the PRIDE-PRD2006 campaign. The NMHC composition is expressed as the fraction of OH reactivity of a certain type of NMHC to that of the total NMHC.
www.atmos-chem-phys.net/14/12291/2014/
Atmos. Chem. Phys., 14, 12291–12305, 2014
26
12300
X. Li et al.: Modeling of HCHO and CHOCHO in China
calculated from locally measured OH, NMHCs, etc. could be
different from that at other points. This will result in HCHO
and CHOCHO concentration gradients, and lead to HCHO
and CHOCHO transport through horizontal advection. During daytime, considering the short lifetime of HCHO and
CHOCHO (≈1.5 h), the low wind speed (≈ 2 m s−1 ) at the
BG site, and the homogeneous type of land usage along the
MAX-DOAS viewing direction, horizontal advection might
have only a minor influence on the HCHO and CHOCHO
simulation.
With regard to the vertical dilution which is caused by the
mixing of the shallow (but growing) mixing layer with the
nocturnal boundary layer and with the residual layer between
sunrise and noon, we can estimate the dilution rate to be constant (kdilu ) from the decay of the measured black carbon
concentrations. During the campaign, the black carbon concentration usually experienced a fast decrease around sunrise
(i.e., 06:00–10:00) and showed stable values after 11:00 until
sunset. The diurnal variation of the black carbon concentration indicates an efficient vertical dilution in the period of
06:00–10:00, and a well mixed boundary layer since 11:00.
In the 6 modeling days, the calculated kdilu ranges from 0.2 to
0.61 h−1 with an average value of 0.41 h−1 . Assuming a constant kdilu of 0.41 h−1 , we applied this removal to all species
by vertical dilution for the time period of 06:00–10:00 in the
model scenario M2 (i.e., model scenario M3). Compared to
the model scenario M2, significant decrease (by ≈ 40 %) of
modeled HCHO and CHOCHO concentrations can be identified during morning hours (Fig. 4).
In addition to the modification of production terms of
HCHO and CHOCHO in the model, including vertical dilution and modified dry deposition (model scenario M3) results in reasonable agreement between modeled and measured HCHO and CHOCHO concentrations in most of the
time during the 6 cloud-free days (Fig. 4). However, during
early morning hours (06:00–09:00), the modeled CHOCHO
concentrations are still significantly higher than the measured
values. For days without the influence of direct precursor
emission in the morning (i.e., 12, 20, and 21 July), the modeled HCHO concentrations are also higher than the measured
values.
Laboratory and field studies indicate that HCHO and
CHOCHO in the gas phase can be lost on aerosols through
heterogeneous uptake processes (Volkamer et al., 2007;
Wang et al., 2010; Li et al., 2011; Washenfelder et al., 2011;
Toda et al., 2014). This uptake process has been shown to be
related to the acidity (Jayne et al., 1996; Liggio et al., 2005)
or the ionic strength (Kroll et al., 2005) of aerosols. Using
an online Aerosol Inorganics Model (AIM, Model II) (http:
//www.aim.env.uea.ac.uk/aim/model2/model2a.php) and the
method described by Zhang et al. (2007), we estimated H+
activity aH+ and ionic strength within the aqueous particle
phase from aerosol mass spectrometry (AMS) measurements
2−
−
−
of NH+
4 , SO4 , NO3 , and Cl in PM1. During the daytime of the 6 cloud-free days, the average value of the cal-
culated aH+ was 1.47 × 10⁻² mol L−1 (corresponding to a
pH value of 1.8), indicating high aerosol acidity at the BG
site. Given the high aerosol concentrations in the early morning hours (Fig. 1), we investigated the sensitivity of modeled
HCHO and CHOCHO concentrations on heterogeneous uptake processes (i.e., model scenario M4). Using an uptake
coefficient of 10−3 as indicated by laboratory and field studies (Jayne et al., 1996; Liggio et al., 2005; Volkamer et al.,
2007), the calculated CHOCHO concentration by the model
scenario M4 decrease significantly (by ≈ 70 %) from that by
the model scenario M3 for the early morning hours. In the
afternoon, due to decreased aerosol concentration, the influence of the uptake by aerosols on the modeled CHOCHO
concentrations becomes small. Compared to the model scenario M3, the model scenario M4 provides better agreement
between modeled and measured HCHO and CHOCHO concentrations (Fig. 4). Under tropospheric conditions, while the
uptake coefficient of 10−3 can be realistic for CHOCHO,
there remains a large uncertainty for HCHO. The value of
10−3 used in the model scenario M4 for HCHO is estimated
from laboratory studies representing typical conditions in the
upper troposphere or in the stratosphere (i.e., low temperature and high aerosol acidity) (Jayne et al., 1996). During experiments performed under tropospheric conditions by Kroll
et al. (2005), no uptake of HCHO by aerosols was observed.
However, some laboratory (Sassine et al., 2010; Li et al.,
2011) and field (Wang et al., 2010; Toda et al., 2014) studies
identified loss of HCHO on tropospheric aerosols under certain conditions. Therefore, it is possible that the use of 10−3
as the HCHO uptake coefficient could not well represent the
condition at the BG site.
Table 3 summarized the relative changes of modeled
HCHO and CHOCHO concentrations by adding additional
processes to the model base case (i.e., model scenarios M1–
M4). By including additional production and destruction
terms (i.e., model scenario M4), the modeled HCHO and
CHOCHO concentrations during daytime (06:00–18:00) decrease by ≈ 80 % of the values predicted by the model base
case. On average, the production terms (i.e., deviation from
steady-state, vertical transport of isoprene) and the uptake
by aerosols have the largest effect (≈ 50 %) on the concentration decrease, followed by vertical dilution (≈ 30 %) and
deposition (≈ 15 %). Increased influence of vertical dilution
and deposition on the concentration decrease can be found
for morning hours.
Atmos. Chem. Phys., 14, 12291–12305, 2014
4.2
Influences on the CHOCHO to HCHO ratio
As illustrated by Vrekoussis et al. (2010) and DiGangi et al.
(2012), the CHOCHO to HCHO ratio (RGF ) can be used
as an indicator of anthropogenic or biogenic impact on
photochemistry. When HCHO and CHOCHO are entirely
photochemically formed, RGF is determined by the relative strength of production and destruction of HCHO and
CHOCHO. When the system is in steady-state, RGF can be
www.atmos-chem-phys.net/14/12291/2014/
PRD2006 campaign. Dates color coded in red are the days which were influenced by local combustion events.
The blue dots are the measured concentrations with error bars indicating the 1σ statistic error of the measurements. Symbols with color black, orange, green, gray, and red represent the modeled concentrations by model
base-case
(M0), and
M1 – M4,
respectively.
model settings are described in Table 1 in the text.
X. Li et
al.: Modeling
of HCHO
and
CHOCHODetailed
in China
12301
Figure 5. Time series of modeled RGF (by the model base case), measured NO and NO2 concentrations and NMHC compositions for the
6 cloud-free days during the PRIDE-PRD2006 campaign. The NMHC composition is expressed as the fraction of OH reactivity of a certain
5. to
Time
of modeled
type ofFig.
NMHC
that series
of the total
NMHC. RGF (by the model base-case), measured NO and NO2 concentrations and
NMHC compositions for the 6 cloud-free days during the PRIDE-PRD2006 campaign. The NMHC composiTNMHC
tion as
is expressed as the fraction of OH reactivity of a certain ktype
of NMHC
that ofare
the decreased
total NMHC.
expressed
in thetomodel
to half of the meaOH
sured values, PCHOCHO and PHCHO are decreased similarly
[CHOCHO] PCHOCHO kdHCHO
by 46 % on average. As a result, RGF remains the same as be(1)
RGF =
=
· CHOCHO .
26
fore.
However, RGF slightly depends on the OH level. With
[HCHO]
PHCHO kd
the decrease of OH concentration, both PCHOCHO , PHCHO ,
Given a certain OH concentration, photolysis frequencies,
kdHCHO , and kdCHOCHO are found to be decreasing but to
and deposition rate, kdHCHO /kdCHOCHO is well defined, and
different extents. When OH concentration is decreased to
RGF depends on PCHOCHO /PHCHO . PCHOCHO /PHCHO is
50 % of the measured values, the decrease of kdHCHO and
largely influenced by the NMHC composition of the inveskdCHOCHO are similar (i.e., by 28 % on average), but the detigated air mass.
crease of PCHOCHO (by 55 % on average) is stronger than
In the 6 cloud-free days during the PRIDE-PRD2006 camthat of PHCHO (by 49 % on average). This results in an averpaign, the average value of measured and modeled (by the
age decrease of RGF by 12 %. The different dependence bemodel base case) RGF is 0.059 ± 0.024 and 0.075 ± 0.035,
tween PHCHO and PCHOCHO on OH concentration is caused
respectively. In addition to photochemical processes, direct
by the fact that HCHO and CHOCHO are produced at difemissions also contribute to ambient HCHO concentrations
ferent generations of NMHCs oxidation by OH. At the BG
(Garcia et al., 2006), which would lead to a decease of RGF .
site, oxidation of isoprene and alkenes by OH is the maDue to the lack of information on the primary HCHO sources
jor process producing HCHO (Sect. 3.2). During this profor areas around the BG site, HCHO emission were not incess, HCHO is mostly produced as a first generation prodcluded in our model. However, in the early morning of 13,
uct and only one OH radical is consumed when each HCHO
24, and 25 July when combustion events were prevailing in
is generated. Therefore, PHCHO is almost linearly dependent
the surrounding areas of the BG site, we found high HCHO
on OH concentration. However, this situation is different for
concentrations and low RGF (≈ 0.03). So, there is a possibilCHOCHO. Under the conditions at the BG site, we found
ity that some HCHO primary sources existed in the surroundthat CHOCHO is mostly the third or forth generation proding area, which causes the discrepancy between modeled and
uct of isoprene and aromatic oxidation by OH. Generating
measured RGF .
one CHOCHO molecule needs more than one OH radical,
On the other hand, the model base case can be used to
which leads to a non-linear dependence of PCHOCHO on OH.
investigate the influence of different chemical processes on
Looking at the time series of modeled RGF (Fig. 5),
the variation of RGF . Given the similarity of the photochemhigh RGF is usually found in early morning and a sharp
ical processes of HCHO and CHOCHO, RGF shows little
decrease of RGF is identified shortly after sunrise. This
TNMHC ). When
sensitivity on the total NMHC reactivities (kOH
www.atmos-chem-phys.net/14/12291/2014/
Atmos. Chem. Phys., 14, 12291–12305, 2014
12302
X. Li et al.: Modeling of HCHO and CHOCHO in China
pattern follows the diurnal variation of NOx concentrations
and of the contribution of aromatics to the total NMHC
Aromatics /k TNMHC ), but is opposite to that of
reactivities (kOH
OH
the contribution of isoprene to the total NMHC reactiviIsoprene TNMHC
ties (kOH
/kOH
), thereby indicating a positive (negative) impact of the anthropogenic (biogenic) emissions on
RGF . A similar phenomenon was observed by DiGangi et al.
(2012) at a rural site in the USA. Our model shows that
PCHOCHO /PHCHO of aromatic compounds (e.g., benzene,
toluene, m,p-xylene) are more than 3 times larger than that
of isoprene. The PCHOCHO /PHCHO of alkanes and alkenes are
even smaller than that of isoprene, due to the little contribution of alkanes and alkenes to the CHOCHO production.
Therefore, higher RGF can be expected when NMHC concentration is dominated by aromatics. Besides the NMHC
composition, NOx levels can also influence the RGF since
HCHO and CHOCHO have different sensitivities to the
change of NOx concentrations. The NO level determines the
conversion of RO2 to RO which finally produces HCHO and
CHOCHO. When the NO concentration in the model is increased, a larger concentration increase is found for HCHO
than for CHOCHO leading to a decrease of RGF . This is because the contribution of RO decomposition to the HCHO
formation is larger than to the CHOCHO formation at the
BG site. At low-NO, RO2 + HO2 reaction forming hydroperoxides competes with RO2 + NO. Therefore, the sensitivity
of RGF to NO is found to be low and high in high- and lowNO regimes, respectively. In general, an increase of NO concentration by 1 % results in a decrease of RGF by 0–0.2 %.
In contrast to NO, an increases of NO2 causes an increase
of RGF . This is because, compared to HCHO, the modeled
CHOCHO is more sensitive to NO2 . Change of NO2 concentrations can have an influence on OH (via OH + NO2 )
and NO3 concentrations. Since the OH concentration in the
model is constrained to the measurements, CHOCHO and
HCHO formation through OH initiated NMHC degradations
will only be marginally affected when the NO2 concentration
is increased / decreased. Since the NO3 reactions have different contribution to the HCHO and CHOCHO production
(Sect. 3.2), increase of the modeled NO3 concentration as a
result of the increase of NO2 can cause the change of RGF . It
is found that the change of RGF ranges from 0 to 0.3 % when
the NO2 concentration is changed by 1 %; the lower the NO2
concentration, the higher the sensitivity of RGF to NO2 .
Based on above analysis, the modeled diurnal variation of
RGF can be explained by the existence of nighttime OH, by
the change of NMHC composition, and by the NOx concentration. During night, the existence of significant amounts
of OH radicals made the OH + NMHC reactions the major pathway of HCHO and CHOCHO formation. The increase of RGF after sunset is then the result of the increase
Aromatics /k TNMHC and of the NO concentration; and the
of kOH
2
OH
slowing down of the RGF increase is caused by the occurrence of high NO concentrations later on. Around sunrise,
Aromatics /k TNMHC and of the NO
due to the decrease of kOH
x
OH
concentration, and the earlier occurrence of CHOCHO photolysis (compared to HCHO, the absorption cross section of
CHOCHO extends more to the visible wavelength range), the
decrease of PCHOCHO /PHCHO and of kdHCHO /kdCHOCHO lead to
the decrease of RGF in the model. When setting the nighttime
OH concentration to zero, modeled HCHO and CHOCHO
concentrations during night are then mainly determined by
their production in the previous afternoon which are mostly
determined through isoprene oxidation (Sect. 3.2). As a result, modeled RGF during night are as low as those during the
previous afternoon when total NMHC reactivity was dominated by isoprene.
In addition to the above factors, additional processes included in the model scenarios M1–M4 also influence the
CHOCHO to HCHO ratio (RGF ). As shown in Table 3 and
Fig. 4, from noon to the afternoon, the modeled RGF in the
model scenario M4 increase by 30 % of the values in the
model base case. Larger increase of RGF can be found during early morning hours, mainly caused by the faster removal
of HCHO by dry deposition than that of CHOCHO. Different from other processes, vertical dilution generally causes a
small decrease of RGF .
By analyzing satellite measurement results, Vrekoussis
et al. (2010) concluded that high RGF can represent regions
strongly influenced by biogenic emissions. However, based
on the in situ observations, DiGangi et al. (2012) found that
the anthropogenic emissions have positive impact on RGF .
Our model study at the BG site indicate that the influence
of anthropogenic emissions on RGF is rather complicated.
On the one hand, anthropogenic emissions of aromatics and
NO2 can contribute to the increase of RGF . On the other, both
emitted NO and HCHO can lead to a decrease of RGF . For
example, compared to the period of 12:00–18:00 on 21 July
TNMHC is lower
although the contribution of aromatics to kOH
than on 24 July the lower NO and higher NO2 concentrations
during 24 July caused higher modeled RGF . Moreover, processes like dry deposition and uptake by aerosols also have
influence on RGF .
Atmos. Chem. Phys., 14, 12291–12305, 2014
5
Summary and conclusion
HCHO and CHOCHO are trace gases produced through
the oxidation of NMHCs. High vertical column densities of
HCHO and CHOCHO have been observed by satellite measurements for the Pearl River Delta (PRD) region in southern
China, indicating the existence of high photochemical reactivity. However, investigations on the sources and sinks of
HCHO and CHOCHO in the PRD are rather limited. During the PRIDE-PRD2006 campaign, MAX-DOAS observations of HCHO and CHOCHO together with measurements
of HOX radicals, trace gases, aerosols, and meteorological
parameters were performed at the semi-rural site, Back Garden (BG), in the PRD. Using these measurement results and
www.atmos-chem-phys.net/14/12291/2014/
X. Li et al.: Modeling of HCHO and CHOCHO in China
12303
a box model, we investigated production and destruction processes of HCHO and CHOCHO for 6 cloud-free days during
the campaign.
The production of HCHO and CHOCHO at the BG site
took place under the combined influence of anthropogenic
and biogenic emissions. OH initiated oxidation of isoprene
accounts for nearly half of the HCHO and CHOCHO formation, with increased contribution in the afternoon. The anthropogenic source of HCHO includes the degradation of
alkenes (29 %), aromatics (15 %), and alkanes (13 %). Besides isoprene, most of the CHOCHO production is due
to the oxidation of aromatics (41 %). While the ozonolysis of alkenes contributes to the formation of HCHO, some
CHOCHO is formed through the oxidation of NMHCs by
NO3 radicals. However, compared to the OH initiated oxidation of NMHCs, ozonolysis of alkenes and NO3 initiated
NMHCs degradations are of minor importance in terms of
the total HCHO and CHOCHO production. The observation of OH radicals at night results in maximum HCHO and
CHOCHO concentrations during early morning, which however is different from observations at other places around the
world.
Compared to the measurements, the box model overestimates the HCHO and CHOCHO concentrations by a factor
of 2–5. This discrepancy seems to be caused by a combination of effects each contributing approximately by the same
amount, i.e., the lack of knowledge about (1) fresh emissions,
(2) fast vertical transport of precursor NMHCs, (3) dry deposition, (4) vertical dilution during the lift of the mixing layer
height during early morning hours, and (5) uptake of HCHO
and CHOCHO by aerosols. Our analysis indicates that, in
addition to chemical considerations, physical processes like
transport, dilution, and dry deposition have to be well considered for any model predicting HCHO and CHOCHO concentrations.
Our model simulations indicate that the CHOCHO to
HCHO ratio at the BG site is influenced not only by the
NMHC composition but also by the concentration levels of
OH and NOx . Higher RGF result from higher aromatic contributions to total NMHCs, from higher OH and NO2 but lower
NO concentrations. Moreover, processes like vertical transport/dilution, dry deposition, and uptake by aerosols can also
influence the CHOCHO to HCHO ratio. The complex dependence of RGF on NMHCs, OH, NOx , and other physical
/ chemical processes makes it difficult to use RGF as an indicator of anthropogenic or biogenic emissions.
Acknowledgements. This work was supported by the Strategic
Priority Research Program of the Chinese Academy of Sciences
(XDB05010500) and the National Natural Science Foundation
of China (21190052). The research was also supported by the
Collaborative Innovation Center for Regional Environmental
Quality.
The Supplement related to this article is available online
at doi:10.5194/acp-14-12291-2014-supplement.
www.atmos-chem-phys.net/14/12291/2014/
The service charges for this open access publication
have been covered by a Research Centre of the
Helmholtz Association.
Edited by: S. C. Liu
References
Choi, W., Faloona, I. C., Bouvier-Brown, N. C., McKay, M., Goldstein, A. H., Mao, J., Brune, W. H., LaFranchi, B. W., Cohen, R. C., Wolfe, G. M., Thornton, J. A., Sonnenfroh, D. M.,
and Millet, D. B.: Observations of elevated formaldehyde over
a forest canopy suggest missing sources from rapid oxidation
of arboreal hydrocarbons, Atmos. Chem. Phys., 10, 8761–8781,
doi:10.5194/acp-10-8761-2010, 2010.
DiGangi, J. P., Boyle, E. S., Karl, T., Harley, P., Turnipseed, A.,
Kim, S., Cantrell, C., Maudlin III, R. L., Zheng, W., Flocke,
F., Hall, S. R., Ullmann, K., Nakashima, Y., Paul, J. B., Wolfe,
G. M., Desai, A. R., Kajii, Y., Guenther, A., and Keutsch, F. N.:
First direct measurements of formaldehyde flux via eddy covariance: implications for missing in-canopy formaldehyde sources,
Atmos. Chem. Phys., 11, 10565–10578, doi:10.5194/acp-1110565-2011, 2011.
DiGangi, J. P., Henry, S. B., Kammrath, A., Boyle, E. S., Kaser, L.,
Schnitzhofer, R., Graus, M., Turnipseed, A., Park, J.-H., Weber,
R. J., Hornbrook, R. S., Cantrell, C. A., Maudlin III, R. L., Kim,
S., Nakashima, Y., Wolfe, G. M., Kajii, Y., Apel, E., Goldstein,
A. H., Guenther, A., Karl, T., Hansel, A., and Keutsch, F. N.: Observations of glyoxal and formaldehyde as metrics for the anthropogenic impact on rural photochemistry, Atmos. Chem. Phys.,
12, 9529–9543, doi:10.5194/acp-12-9529-2012, 2012.
Finlayson-Pitts, B. J. and Pitts, J. N.: Chemistry of the Upper
and Lower Atmosphere - Theory, Experiments and Applications,
Academic Press, San Diego, first edn., 2000.
Fortems-Cheiney, A., Chevallier, F., Pison, I., Bousquet, P., Saunois,
M., Szopa, S., Cressot, C., Kurosu, T. P., Chance, K., and Fried,
A.: The formaldehyde budget as seen by a global-scale multiconstraint and multi-species inversion system, Atmos. Chem.
Phys., 12, 6699–6721, doi:10.5194/acp-12-6699-2012, 2012.
Fried, A., Crawford, J., Olson, J., Walega, J., Potter, W., Wert, B.,
Jordan, C., Anderson, B., Shetter, R., Lefer, B., Blake, D., Blake,
N., Meinardi, S., Heikes, B., O’Sullivan, D., Snow, J., Fuelberg,
H., Kiley, C. M., Sandholm, S., Tan, D., Sachse, G., Singh, H.,
Faloona, I., Harward, C. N., and Carmichael, G. R.: Airborne tunable diode laser measurements of formaldehyde during TRACEP: Distributions and box model comparisons, J. Geophys. Res.,
108, 8798, doi:10.1029/2003jd003451, 2003a.
Fried, A., Wang, Y., Cantrell, C., Wert, B., Walega, J., Ridley, B.,
Atlas, E., Shetter, R., Lefer, B., Coffey, M. T., Hannigan, J.,
Blake, D., Blake, N., Meinardi, S., Talbot, B., Dibb, J., Scheuer,
E., Wingenter, O., Snow, J., Heikes, B., and Ehhalt, D.: Tunable
Atmos. Chem. Phys., 14, 12291–12305, 2014
12304
X. Li et al.: Modeling of HCHO and CHOCHO in China
diode laser measurements of formaldehyde during the TOPSE
2000 study: Distributions, trends, and model comparisons,
J. Geophys. Res., 108, D4, 8365, doi:10.1029/2002jd002208,
2003b.
Fried, A., Cantrell, C., Olson, J., Crawford, J. H., Weibring, P.,
Walega, J., Richter, D., Junkermann, W., Volkamer, R., Sinreich, R., Heikes, B. G., O’Sullivan, D., Blake, D. R., Blake, N.,
Meinardi, S., Apel, E., Weinheimer, A., Knapp, D., Perring, A.,
Cohen, R. C., Fuelberg, H., Shetter, R. E., Hall, S. R., Ullmann,
K., Brune, W. H., Mao, J., Ren, X., Huey, L. G., Singh, H. B.,
Hair, J. W., Riemer, D., Diskin, G., and Sachse, G.: Detailed comparisons of airborne formaldehyde measurements with box models during the 2006 INTEX-B and MILAGRO campaigns: potential evidence for significant impacts of unmeasured and multigeneration volatile organic carbon compounds, Atmos. Chem.
Phys., 11, 11867–11894, doi:10.5194/acp-11-11867-2011, 2011.
Fu, T.-M., Jacob, D. J., Wittrock, F., Burrows, J. P., Vrekoussis, M., and Henze, D. K.: Global budgets of atmospheric
glyoxal and methylglyoxal, and implications for formation of
secondary organic aerosols, J. Geophys. Res., 113, D15303,
doi:10.1029/2007JD009505, 2008.
Garcia, A. R., Volkamer, R., Molina, L. T., Molina, M. J., Samuelson, J., Mellqvist, J., Galle, B., Herndon, S. C., and Kolb, C. E.:
Separation of emitted and photochemical formaldehyde in Mexico City using a statistical analysis and a new pair of gas-phase
tracers, Atmos. Chem. Phys., 6, 4545–4557, doi:10.5194/acp-64545-2006, 2006.
Hofzumahaus, A., Rohrer, F., Lu, K., Bohn, B., Brauers, T., Chang,
C.-C., Fuchs, H., Holland, F., Kita, K., Kondo, Y., Li, X., Lou,
S., Shao, M., Zeng, L., Wahner, A., and Zhang, Y.: Amplified
Trace Gas Removal in the Troposphere, Science, 324, 1702–
1704, doi:10.1126/science.1164566, 2009.
Hu, W. W., Hu, M., Deng, Z. Q., Xiao, R., Kondo, Y., Takegawa, N.,
Zhao, Y. J., Guo, S., and Zhang, Y. H.: The characteristics and
origins of carbonaceous aerosol at a rural site of PRD in summer
of 2006, Atmos. Chem. Phys., 12, 1811–1822, doi:10.5194/acp12-1811-2012, 2012.
Huisman, A. J., Hottle, J. R., Galloway, M. M., DiGangi, J. P., Coens, K. L., Choi, W., Faloona, I. C., Gilman, J. B., Kuster, W. C.,
de Gouw, J., Bouvier-Brown, N. C., Goldstein, A. H., LaFranchi,
B. W., Cohen, R. C., Wolfe, G. M., Thornton, J. A., Docherty,
K. S., Farmer, D. K., Cubison, M. J., Jimenez, J. L., Mao, J.,
Brune, W. H., and Keutsch, F. N.: Photochemical modeling of
glyoxal at a rural site: observations and analysis from BEARPEX
2007, Atmos. Chem. Phys., 11, 8883–8897, doi:10.5194/acp-118883-2011, 2011.
Jang, M. and Kamens, R. M.: Atmospheric Secondary Aerosol Formation by Heterogeneous Reactions of Aldehydes in the Presence of a Sulfuric Acid Aerosol Catalyst, Environ. Sci. Technol.,
35, 4758–4766, doi:10.1021/es010790s, 2001.
Jayne, J. T., Worsnop, D. R., Kolb, C. E., Swartz, E.,
and Davidovits, P.: Uptake of Gas-Phase Formaldehyde by
Aqueous Acid Surfaces, J. Phys. Chem., 100, 8015–8022,
doi:10.1021/jp953196b, 1996.
Kormann, R., Fischer, H., de Reus, M., Lawrence, M., Brühl,
C., von Kuhlmann, R., Holzinger, R., Williams, J., Lelieveld,
J., Warneke, C., de Gouw, J., Heland, J., Ziereis, H., and
Schlager, H.: Formaldehyde over the eastern Mediterranean
during MINOS: Comparison of airborne in-situ measurements
with 3D-model results, Atmos. Chem. Phys., 3, 851–861,
doi:10.5194/acp-3-851-2003, 2003.
Kroll, J. H., Ng, N. L., Murphy, S. M., Varutbangkul, V., Flagan, R. C., and Seinfeld, J. H.: Chamber studies of secondary organic aerosol growth by reactive uptake of simple carbonyl compounds, J. Geophys. Res., 110, D23 207,
doi:10.1029/2005jd006004, 2005.
Lee, M., Heikes, B. G., Jacob, D. J., Sachse, G., and Anderson, B.:
Hydrogen peroxide, organic hydroperoxide, and formaldehyde
as primary pollutants from biomass burning, J. Geophys. Res.,
102, 1301–1309, doi:10.1029/96jd01709, 1997.
Li, X., Brauers, T., Shao, M., Garland, R. M., Wagner, T.,
Deutschmann, T., and Wahner, A.: MAX-DOAS measurements
in southern China: retrieval of aerosol extinctions and validation
using ground-based in-situ data, Atmos. Chem. Phys., 10, 2079–
2089, doi:10.5194/acp-10-2079-2010, 2010.
Li, X., Brauers, T., Häseler, R., Bohn, B., Fuchs, H., Hofzumahaus,
A., Holland, F., Lou, S., Lu, K. D., Rohrer, F., Hu, M., Zeng,
L. M., Zhang, Y. H., Garland, R. M., Su, H., Nowak, A., Wiedensohler, A., Takegawa, N., Shao, M., and Wahner, A.: Exploring the atmospheric chemistry of nitrous acid (HONO) at a rural site in Southern China, Atmos. Chem. Phys., 12, 1497–1513,
doi:10.5194/acp-12-1497-2012, 2012.
Li, X., Brauers, T., Hofzumahaus, A., Lu, K., Li, Y. P., Shao,
M., Wagner, T., and Wahner, A.: MAX-DOAS measurements of
NO2, HCHO and CHOCHO at a rural site in Southern China,
Atmos. Chem. Phys., 13, 2133–2151, doi:10.5194/acp-13-21332013, 2013.
Li, Z., Schwier, A. N., Sareen, N., and McNeill, V. F.: Reactive
processing of formaldehyde and acetaldehyde in aqueous aerosol
mimics: surface tension depression and secondary organic products, Atmos. Chem. Phys., 11, 11 617–11 629, doi:10.5194/acp11-11617-2011, 2011.
Liggio, J., Li, S.-M., and McLaren, R.: Reactive uptake of glyoxal by particulate matter, J. Geophys. Res., 110, D10 304,
doi:10.1029/2004jd005113, 2005.
Liu, X., Cheng, Y., Zhang, Y., Jung, J., Sugimoto, N., Chang, S.Y., Kim, Y. J., Fan, S., and Zeng, L.: Influences of relative humidity and particle chemical composition on aerosol scattering
properties during the 2006 PRD campaign, Atmos. Environ., 42,
1525–1536, doi:10.1016/j.atmosenv.2007.10.077, 2008.
Liu, Z., Wang, Y., Vrekoussis, M., Richter, A., Wittrock, F.,
Burrows, J. P., Shao, M., Chang, C.-C., Liu, S.-C., Wang,
H., and Chen, C.: Exploring the missing source of glyoxal
(CHOCHO) over China, Geophys. Res. Lett., 39, L10812–,
doi:10.1029/2012GL051645, 2012.
Lou, S., Holland, F., Rohrer, F., Lu, K., Bohn, B., Brauers, T.,
Chang, C. C., Fuchs, H., Häseler, R., Kita, K., Kondo, Y.,
Li, X., Shao, M., Zeng, L., Wahner, A., Zhang, Y., Wang,
W., and Hofzumahaus, A.: Atmospheric OH reactivities in
the Pearl River Delta – China in summer 2006: measurement
and model results, Atmos. Chem. Phys., 10, 11243–11260,
doi:10.5194/acp-10-11243-2010, 2010.
Lu, K. D., Rohrer, F., Holland, F., Fuchs, H., Bohn, B., Brauers, T.,
Chang, C. C., Häseler, R., Hu, M., Kita, K., Kondo, Y., Li, X.,
Lou, S. R., Nehr, S., Shao, M., Zeng, L. M., Wahner, A., Zhang,
Y. H., and Hofzumahaus, A.: Observation and modelling of OH
and HO2 concentrations in the Pearl River Delta 2006: a missing
Atmos. Chem. Phys., 14, 12291–12305, 2014
www.atmos-chem-phys.net/14/12291/2014/
X. Li et al.: Modeling of HCHO and CHOCHO in China
12305
OH source in a VOC rich atmosphere, Atmos. Chem. Phys., 12,
1541–1569, doi:10.5194/acp-12-1541-2012, 2012.
MacDonald, S. M., Oetjen, H., Mahajan, A. S., Whalley, L. K., Edwards, P. M., Heard, D. E., Jones, C. E., and Plane, J. M. C.:
DOAS measurements of formaldehyde and glyoxal above a
south-east Asian tropical rainforest, Atmos. Chem. Phys., 12,
5949–5962, doi:10.5194/acp-12-5949-2012, 2012.
Myriokefalitakis, S., Vrekoussis, M., Tsigaridis, K., Wittrock, F.,
Richter, A., Brühl, C., Volkamer, R., Burrows, J. P., and Kanakidou, M.: The influence of natural and anthropogenic secondary
sources on the glyoxal global distribution, Atmos. Chem. Phys.,
8, 4965–4981, doi:10.5194/acp-8-4965-2008, 2008.
Parrish, D. D., Ryerson, T. B., Mellqvist, J., Johansson, J., Fried, A.,
Richter, D., Walega, J. G., Washenfelder, R. A., de Gouw, J. A.,
Peischl, J., Aikin, K. C., McKeen, S. A., Frost, G. J., Fehsenfeld, F. C., and Herndon, S. C.: Primary and secondary sources
of formaldehyde in urban atmospheres: Houston Texas region,
Atmos. Chem. Phys., 12, 3273–3288, doi:10.5194/acp-12-32732012, 2012.
Sassine, M., Burel, L., D’Anna, B., and George, C.: Kinetics of the tropospheric formaldehyde loss onto mineral
dust and urban surfaces, Atmos. Environ., 44, 5468–5475,
doi:10.1016/j.atmosenv.2009.07.044, 2010.
Schauer, J. J., Kleeman, M. J., Cass, G. R., and Simoneit,
B. R. T.: Measurement of Emissions from Air Pollution
Sources. 2. C1 through C30 Organic Compounds from Medium
Duty Diesel Trucks, Environ. Sci. Technol., 33, 1578–1587,
doi:10.1021/es980081n, 1999.
Schauer, J. J., Kleeman, M. J., Cass, G. R., and Simoneit,
B. R. T.: Measurement of Emissions from Air Pollution
Sources. 5. C1 through C32 Organic Compounds from GasolinePowered Motor Vehicles, Environ. Sci. Technol., 36, 1169–1180,
doi:10.1021/es0108077, 2002.
Stavrakou, T., Müller, J. F., De Smedt, I., Van Roozendael, M.,
Kanakidou, M., Vrekoussis, M., Wittrock, F., Richter, A., and
Burrows, J. P.: The continental source of glyoxal estimated by the
synergistic use of spaceborne measurements and inverse modelling, Atmos. Chem. Phys., 9, 8431–8446, doi:10.5194/acp-98431-2009, 2009.
Stickler, A., Fischer, H., Williams, J., de Reus, M., Sander, R.,
Lawrence, M. G., Crowley, J. N., and Lelieveld, J.: Influence of
summertime deep convection on formaldehyde in the middle and
upper troposphere over Europe, J. Geophys. Res., 111, D14308,
doi:10.1029/2005jd007001, 2006.
Stull, R. B.: An Introduction to Boundary Layer Meteorology,
Kluwer Academic Publishers, Dordrecht, The Netherlands,
1988.
Tan, Y., Perri, M. J., Seitzinger, S. P., and Turpin, B. J.: Effects of Precursor Concentration and Acidic Sulfate in Aqueous Glyoxal-OH Radical Oxidation and Implications for Secondary Organic Aerosol, Environ. Sci. Technol., 43, 8105–8112,
doi:10.1021/es901742f, 2009.
Tie, X., Brasseur, G., Emmons, L., Horowitz, L., and Kinnison, D.: Effects of aerosols on tropospheric oxidants: A
global model study, J. Geophys. Res., 106, 22931–22964,
doi:10.1029/2001jd900206, 2001.
Toda, K., Yunoki, S., Yanaga, A., Takeuchi, M., Ohira, S.-I., and
Dasgupta, P. K.: Formaldehyde Content of Atmospheric Aerosol,
Environ. Sci. Technol., 48, 6636–6643, doi:10.1021/es500590e,
2014.
Volkamer, R., San Martini, F., Molina, L. T., Salcedo, D., Jimenez,
J. L., and Molina, M. J.: A missing sink for gas-phase glyoxal in
Mexico City: Formation of secondary organic aerosol, Geophys.
Res. Lett., 34, L19807, doi:10.1029/2007gl030752, 2007.
Volkamer, R., Sheehy, P., Molina, L. T., and Molina, M. J.: Oxidative capacity of the Mexico City atmosphere – Part 1: A radical source perspective, Atmos. Chem. Phys., 10, 6969–6991,
doi:10.5194/acp-10-6969-2010, 2010.
Vrekoussis, M., Wittrock, F., Richter, A., and Burrows, J. P.:
GOME-2 observations of oxygenated VOCs: what can we learn
from the ratio glyoxal to formaldehyde on a global scale?,
Atmos. Chem. Phys., 10, 10145–10160, doi:10.5194/acp-1010145-2010, 2010.
Wagner, V., Schiller, C., and Fischer, H.: Formaldehyde measurements in the marine boundary layer of the Indian Ocean during the 1999 INDOEX cruise of the R/V Ronald H. Brown, J.
Geophys. Res., 106, 28529–28538, doi:10.1029/2000jd900825,
2001.
Wang, X., Gao, S., Yang, X., Chen, H., Chen, J., Zhuang, G.,
Surratt, J. D., Chan, M. N., and Seinfeld, J. H.: Evidence
for High Molecular Weight Nitrogen-Containing Organic Salts
in Urban Aerosols, Environ. Sci. Technol., 44, 4441–4446,
doi:10.1021/es1001117, 2010.
Washenfelder, R. A., Young, C. J., Brown, S. S., Angevine, W. M.,
Atlas, E. L., Blake, D. R., Bon, D. M., Cubison, M. J., de Gouw,
J. A., Dusanter, S., Flynn, J., Gilman, J. B., Graus, M., Griffith, S., Grossberg, N., Hayes, P. L., Jimenez, J. L., Kuster,
W. C., Lefer, B. L., Pollack, I. B., Ryerson, T. B., Stark,
H., Stevens, P. S., and Trainer, M. K.: The glyoxal budget
and its contribution to organic aerosol for Los Angeles, California, during CalNex 2010, J. Geophys. Res., 116, D00V02,
doi:10.1029/2011JD016314, 2011.
Wittrock, F., Richter, A., Oetjen, H., Burrows, J. P., Kanakidou,
M., Myriokefalitakis, S., Volkamer, R., Beirle, S., Platt, U., and
Wagner, T.: Simultaneous global observations of glyoxal and
formaldehyde from space, Geophys. Res. Lett., 33, L16804,
doi:10.1029/2006gl026310, 2006.
Zhang, Q., Jimenez, J. L., Worsnop, D. R., and Canagaratna, M.: A
Case Study of Urban Particle Acidity and Its Influence on Secondary Organic Aerosol, Environ. Sci. Technol., 41, 3213–3219,
doi:10.1021/es061812j, 2007.
Zhou, X., Lee, Y.-N., Newman, L., Chen, X., and Mopper,
K.: Tropospheric formaldehyde concentration at the Mauna
Loa Observatory during the Mauna Loa Observatory Photochemistry Experiment 2, J. Geophys. Res., 101, 14711–14719,
doi:10.1029/95jd03226, 1996.
www.atmos-chem-phys.net/14/12291/2014/
Atmos. Chem. Phys., 14, 12291–12305, 2014


© Copyright 2026