
dnb group
FOURTH QUARTER REPORT 2016
(Preliminary and unaudited)
Q4
DNB GROUP
Creating value for customers, shareholders,
employees and society at large.
Financial highlights
Income statement
Amounts in NOK million
Net interest income
Net commissions and fees
Net gains on financial instruments at fair value
Net financial and risk result, DNB Livsforsikring
Net insurance result, DNB Forsikring
Other operating income
Net other operating income, total
Total income
Operating expenses
Restructuring costs and non-recurring effects
Pre-tax operating profit before impairment
Net gains on fixed and intangible assets
Impairment of loans and guarantees
Pre-tax operating profit
Tax expense
Profit from operations held for sale, after taxes
Profit for the period
DNB Group
4th quarter
2016
4th quarter
2015
Full year
2016
Full year
2015
8 372
2 136
1 689
232
181
(9)
4 230
12 602
(5 213)
19
7 409
(12)
(1 753)
5 644
(290)
26
5 380
9 062
2 082
2 164
(681)
132
129
3 825
12 888
(5 437)
1 811
9 262
(9)
(1 420)
7 833
(1 077)
28
6 784
34 110
8 280
6 513
664
648
1 948
18 053
52 163
(20 693)
(639)
30 830
(19)
(7 424)
23 387
(4 140)
4
19 251
35 358
8 862
8 683
(389)
534
959
18 648
54 006
(21 068)
1 157
34 096
45
(2 270)
31 871
(7 048)
(51)
24 772
31 Dec.
2016
31 Dec.
2015
2 653 201
1 509 078
934 897
206 423
2 841 117
2 930 891
2 598 530
1 542 744
944 428
190 425
2 946 119
2 900 714
Balance sheet
Amounts in NOK million
Total assets
Loans to customers
Deposits from customers
Total equity
Average total assets
Total combined assets
Key figures
Return on equity, annualised (per cent)
Earnings per share (NOK)
Combined weighted total average spread for lending and deposits
(per cent) 1) 2)
Cost/income ratio (per cent)
Impairment relative to average net loans to customers, annualised
(per cent) 1)
Common equity Tier 1 capital ratio, transitional rules, at end of period
(per cent) 3)
Tier 1 capital ratio, transitional rules, at end of period
(per cent) 3)
Capital ratio, transitional rules, at end of period (per cent) 3)
Share price at end of period (NOK)
Price/book value
Dividend per share (NOK) 4)
Score from RepTrak's reputation survey in Norway (points)
Customer satisfaction index, CSI, personal customers in Norway (score)
1)
2)
3)
4)
4th quarter
2016
4th quarter
2015
Full year
2016
Full year
2015
10.9
3.16
15.0
4.11
10.1
11.46
14.5
14.98
1.29
41.2
1.32
28.1
1.32
40.9
1.33
36.9
(0.45)
(0.37)
(0.48)
(0.15)
16.0
14.4
16.0
14.4
17.6
19.5
128.40
1.10
15.3
17.8
109.80
0.98
64.0
67.3
70.1
73.2
17.6
19.5
128.40
1.10
5.70
65.4
70.2
15.3
17.8
109.80
0.98
4.50
69.8
73.9
Includes assets and liabilities in the Baltics, reclassified as held for sale in August 2016.
As from the first quarter of 2016, interest rate spreads are based on customer segments. Figures for previous periods have been restated accordingly.
Including 50 per cent of profit for the period, except for the full year figures.
Proposed dividend for 2016.
For additional key figures and definitions, please refer to pages 35-36.
Fourth quarter report 2016
Directors’ report .................................................................................................................................. 2
Accounts for the DNB Group
Income statement ........................................................................................................................................ 12
Comprehensive income statement ............................................................................................................. 12
Balance sheet ............................................................................................................................................. 13
Statement of changes in equity................................................................................................................... 14
Cash flow statement.................................................................................................................................... 15
Note 1
Basis for preparation................................................................................................................. 16
Note 2
Segments .................................................................................................................................. 17
Note 3
Capital adequacy ...................................................................................................................... 20
Note 4
Liquidity risk .............................................................................................................................. 22
Note 5
Net interest income ................................................................................................................... 22
Note 6
Net commission and fee income .............................................................................................. 23
Note 7
Net gains on financial instruments at fair value........................................................................ 23
Note 8
Operating expenses.................................................................................................................. 24
Note 9
Taxes ........................................................................................................................................ 24
Note 10
Impairment of loans and guarantees ........................................................................................ 25
Note 11
Loans to customers .................................................................................................................. 25
Note 12
Net impaired loans and guarantees for principal customer groups ......................................... 26
Note 13
Fair value of financial instruments at amortised cost ............................................................... 26
Note 14
Financial instruments at fair value ............................................................................................ 27
Note 15
Commercial paper and bonds, held to maturity ....................................................................... 29
Note 16
Investment properties .............................................................................................................. 30
Note 17
Assets and liabilities held for sale ............................................................................................ 31
Note 18
Debt securities issued and subordinated loan capital .............................................................. 32
Note 19
Off-balance sheet transactions and contingencies .................................................................. 33
Accounts for DNB ASA
Income statement ........................................................................................................................................ 34
Balance sheet ............................................................................................................................................. 34
Statement of changes in equity................................................................................................................... 34
Basis for preparation ................................................................................................................................... 34
Additional information DNB Group
Key figures .................................................................................................................................................. 35
Profit and balance sheet trends .................................................................................................................. 37
Information about the DNB Group .............................................................................................................. 39
There has been no full or partial external audit of the quarterly directors’ report and accounts, though the report has been reviewed by the
Audit Committee.
DNB GROUP – FOURTH QUARTER REPORT 2016 (PRELIMINARY AND UNAUDITED) / 1
Directors’ report
Fourth quarter financial performance
DNB recorded profits of NOK 5 380 million in the fourth quarter of
2016, a reduction of NOK 1 404 million from the fourth quarter
of 2015. The decline in profits mainly reflected lower net interest
income and higher impairment losses. However, there were also
non-recurring effects related to the transition from a defined-benefit
to a defined-contribution pension scheme for the Group’s
employees, which affected profits in the fourth quarter of 2015.
The target for the common equity Tier 1 capital ratio was
reached one year ahead of plan and was 16.0 per cent at endDecember 2016, up from 14.4 per cent a year earlier. This is
conditional on a dividend payout ratio of 49.8 per cent or NOK 5.70
per share. The build-up of common equity Tier 1 capital, primarily
through profits generated during the period, accounted for more
than half of the increase in the capital ratio. In addition, a strategic
reduction in risk-weighted assets relating to large international
corporates with low profitability contributed to the increase.
The proposed dividend is in accordance with the Group’s
ambition of a payout ratio above 50 per cent from 2017.
The leverage ratio for the Group was 7.3 per cent in the fourth
quarter of 2016, up from 6.7 per cent a year earlier and well above
the upcoming requirement.
Return on equity was 10.9 per cent in the quarter, which was
4.1 percentage points lower than in the year-earlier period. Despite
the build-up of capital, the Group delivered a double-digit return on
equity.
Net interest income was down NOK 690 million from the
fourth quarter of 2015, reflecting a reduction in volumes, narrower
spreads and higher long-term funding costs. Higher money market
rates had a negative effect on spreads in the fourth quarter. The
announced repricing of home mortgages came into effect on
9 January 2017.
Net other operating income was NOK 4 230 million, up
NOK 405 million from the fourth quarter of 2015. There was a
positive contribution from trading activities, and commissions and
fees were higher than in the year-earlier period.
Total operating expenses increased by NOK 1 568 million
compared with the fourth quarter of 2015. Adjusted for nonrecurring effects, underlying operating expenses were NOK 225
million lower than in the year-earlier period. The cost/income ratio
for the quarter was 41.2 per cent.
Impairment losses on loans and guarantees totalled NOK 1 753
million in the quarter. There was a rise in individual impairment
losses, referring mainly to the offshore and energy segments.
The other credit portfolios are still of high quality and the difficult
situation in the oil-related industries has had no material impact on
these portfolios.
In the course of the fourth quarter, DNB’s share price rose by
21.8 per cent, while the Oslo Børs Benchmark Index was up 9.8 per
cent.
In the middle of October, the NXT Conference was held at
DNB’s head office in Oslo. The conference was part of Oslo
Innovation Week, a digital and physical meeting place for entrepreneurs and investors to help them make contacts and share
networks, knowledge and inspiration. In November, DNB and
StartupLab launched NXT Accelerator, a programme to help
promising technological startup companies to expand quickly,
establish partnerships and create commercial opportunities for
both the companies themselves and DNB.
DNB Markets topped all categories within equity brokerage and
research in Norway in the Prospera survey in the fourth quarter.
DNB’s updated financial ambitions for 2017-2019 were
presented at the Group’s Capital Markets Day in late November.
In consequence of the competitive situation and rising market
rates, DNB decided in November to increase interest rates on home
mortgages by up to 0.2 percentage points.
DNB received the Confederation of Vocational Unions’ (YS)
equal opportunity award due to its work to equalise salary
differences between men and women.
As the first Norwegian financial institution, DNB was awarded a
rating of A- for its climate work by the Carbon Disclosure Project,
CDP.
During the fourth quarter, DNB improved its ranking on the lists
of the most attractive employers in Norway, also among employees
who have worked for some years. DNB advanced to first and fifth
place in the business and IT segments, respectively, in the
Universum survey.
In October, it became known that DNB is one of many banks
involved in the financing of the construction of a new and
controversial oil pipeline in North Dakota in the US. DNB will ensure
that the bank can answer for its part of the project financing and
may potentially reconsider its exposure in the pipeline project.
During the fourth quarter, the Group’s mutual funds sold their
holdings in the companies building the pipeline.
In mid-December, the Ministry of Finance adopted a new home
mortgage regulation. At the same time, it became clear that the
Norwegian parliament (Stortinget) supported the government's
proposal to introduce a financial activities tax. This will have an
estimated annual effect on DNB’s operating expenses of around
NOK 400 million.
The Ministry of Finance raised the counter-cyclical buffer
requirement from 1.5 to 2.0 per cent with effect from year-end 2017.
In late October, DNB received the award for best annual report
for listed companies, the Farmand Award.
Important events in the fourth quarter
Vipps Invoice was launched at the start of November. Vipps Invoice
is a simple solution for companies wishing to send invoices to
customers directly in Vipps. The Vipps app has been downloaded
by close to 50 per cent of the Norwegian population. The introduction of Vipps to new product areas will contribute to future
profitability.
2 / DNB GROUP – FOURTH QUARTER REPORT 2016 (PRELIMINARY AND UNAUDITED)
Fourth quarter income statement – main items
Operating expenses
Net interest income
Amounts in NOK million
4th quarter
4th quarter
4th quarter
Total adjusted operating expenses
4th quarter
2016
Change
2015
(5 213)
225
(5 437)
Amounts in NOK million
2016
Change
2015
Expenses related to operations
Net interest income
8 372
(690)
9 062
Other costs
194
Salaries and other personnel expenses
(excl. pension and restructuring costs)
159
Exchange rate movements
(30)
Other net interest income
(31)
Long-term funding costs
(93)
Lending and deposit volumes, customer segments
(101)
Lending and deposit spreads, customer segments
(215)
Amortisation effects and fees
(220)
Pension expenses
49
IT expenses
(36)
Provisions for financial activities tax
Non-recurring effects
(142)
19
IT restructuring
Net interest income declined by NOK 690 million from the fourth
quarter of 2015. Higher money market rates had a negative effect
on spreads in the fourth quarter. For the customer segments,
average lending spreads contracted by 0.15 percentage points,
while deposit spreads widened by 0.13 percentage points. Volumeweighted spreads for the customer segments narrowed by 0.04
percentage points compared with the same period in 2015. There
was an average decrease of NOK 17.7 billion or 1.2 per cent in the
healthy loan portfolio compared with the fourth quarter of 2015. Due
to changes in customer behaviour, amortisation periods are
increasing, and customers are no longer so eager to refinance their
loans. Consequently, amortisation and fee income was reduced by
NOK 220 million compared with the fourth quarter of 2015. During
the same period, deposits were down NOK 12.8 billion or 1.3 per
cent. Adjusted for exchange rate movements, loans were reduced
by 0.9 per cent and deposits by 0.1 per cent. Repricing of the
personal customer loan portfolio was implemented in early January
2017 and will result in wider spreads.
Restructuring costs
Other non-recurring effects
Operating expenses
(1 793)
1 811
(9)
9
(203)
(56)
(148)
222
(1 728)
1 950
(5 194)
(1 568)
(3 626)
(5 292)
146
Of which:
Exchange rate effects for units outside Norway
Currency-adjusted operating expenses
79
(5 437)
Total operating expenses increased by NOK 1 568 million
compared with the fourth quarter of 2015. Adjusted for nonrecurring effects, operating expenses were NOK 225 million lower
than in the year-earlier period. Provisions for financial activities tax
of NOK 142 million were recorded in the quarter.
Non-recurring effects recorded in the fourth quarter of 2015
mainly related to the transition from a defined-benefit to a definedcontribution pension scheme for the Group’s employees.
In the fourth quarter of 2016, the cost/income ratio was 41.2 per
cent.
Impairment of loans and guarantees
Net other operating income
4th quarter
4th quarter
Amounts in NOK million
2016
Change
2015
Net other operating income
4 230
405
3 825
Use of the risk equalisation fund in 2015
980
Net gains on other financial instruments
234
Net gains on the sale of loans
Net commissions and fees
Other operating income
94
55
(23)
Realised gains and rents from investment
properties in København Ejendomme in 2015
(226)
Basis swaps
(709)
Net other operating income increased by NOK 405 million or
10.6 per cent from the fourth quarter of 2015. Net gains on other
financial instruments were up NOK 234 million compared with the
year-earlier period, reflecting the volatility in the financial markets.
Profits from commissions and fees rose by NOK 55 million, mainly
due to increased corporate finance activity in equity capital markets
and mergers and acquisitions. Other operating income in 2015 was
negatively affected by the transfer from the risk equalisation fund to
the policyholders’ premium reserve in DNB Livsforsikring. Negative
mark-to-market adjustments related to basis swaps increased by
NOK 709 million in 2016.
Impairment losses on loans and guarantees totalled NOK 1 753
million for the quarter, up NOK 333 million from the corresponding
quarter in 2015. Individual impairment was on a level with the third
quarter and mainly represented impairment losses in offshore and
energy in the large corporate and international customers segment,
while some losses stemmed from a few small and medium-sized
enterprises.
There was a reduction in collective impairment. The losses
were mainly concentrated in the shipping and offshore portfolio.
There was a minor reduction in collective impairment for other
industries, mainly due to more favourable economic conditions
and positive migration in the portfolio.
Net non-performing and doubtful loans and guarantees
increased by NOK 11.7 billion from end-December 2015, totalling
NOK 25.7 billion at end-December 2016. This represented 1.49 per
cent of the loan portfolio, up from 0.76 per cent at end-December
2015. The increase mainly stemmed from offshore and energyrelated segments. There are no signs of negative spill-over effects
from the situation in the oil-related industries to the other credit
portfolios.
Taxes
The DNB Group's tax expense for the fourth quarter of 2016 is
estimated at NOK 290 million, or 5.1 per cent of pre-tax operating
profits. The low tax expense in the quarter was due to one-off
effects related to entities outside Norway, and Norwegian taxation
rules for the allocation of interest expenses between Norway and
the US.
DNB GROUP – FOURTH QUARTER REPORT 2016 (PRELIMINARY AND UNAUDITED) / 3
Financial performance, segments
Financial governance in DNB is adapted to the different customer
segments. Reported figures reflect total sales of products and
services to the relevant segments.
Personal customers
4th quarter
Change
NOK mill
%
sold during the quarter. There were also reversals on impairment
losses in the fourth quarter of 2015. Adjusted for the reversals, net
impairment losses on loans remained stable at a low level.
DNB’s market share of credit to households stood at 25.1 per
cent at end-November 2016, while the market share of total household savings was 31.8 per cent. DNB Eiendom had a market share
of 19.2 per cent in the fourth quarter of 2016.
Customers’ use of digital services continues to increase,
and DNB is continuing to digitalise its products and services. An
important milestone was reached in the fourth quarter, when a
new digital solution for extending existing home mortgages was
launched. The new digital solution will provide significant efficiency
gains in the personal customer segment. In addition, DNB has
introduced a new solution for pension savings called “Lev Mer”
(Live More). The product is both more straightforward and less
costly for customers as, based on customer age, it automatically
offers a tailor-made combination of equities and fixed-income
instruments.
DNB aspires to achieve continued profitable growth in the
personal customer segment. Impairment losses on loans are
expected to remain stable at a low level.
Income statement in NOK million
2016
2015
Net interest income
3 228
3 496
(268)
Net other operating income
1 145
1 120
26
2.3
Total income
4 374
4 616
(242)
(5.2)
(2 024)
(2 157)
133
6.2
2 350
2 459
(108)
(4.4)
0
(0)
129
15
113
Pre-tax operating profit
2 479
2 474
5
0.2
Tax expense
(620)
(668)
48
7.2
0
(1)
1
1 859
1 805
54
3.0
Net loans to customers
718.2
695.7
22.4
3.2
Deposits from customers
399.4
391.1
8.3
2.1
Lending spread 1)
1.61
1.95
Deposit spread 1)
0.43
0.24
Income statement in NOK million
2016
2015
NOK mill
%
Return on allocated capital 2)
18.4
21.2
Net interest income
1 638
1 610
28
1.7
Cost/income ratio
46.3
46.7
Net other operating income
556
449
107
23.9
Ratio of deposits to loans
55.6
56.2
Total income
2 194
2 059
135
6.6
Operating expenses
(898)
(807)
(91)
(11.2)
Pre-tax operating profit before impairment
1 296
1 252
44
3.5
(0)
(0)
(0)
(289)
(360)
71
19.8
40
35
4
12.2
Pre-tax operating profit
1 047
927
120
12.9
Tax expense
(262)
(250)
(11)
(4.5)
785
677
108
16.0
Net loans to customers
231.9
220.3
11.6
5.3
Deposits from customers
185.7
172.8
12.8
7.4
Lending spread 1)
2.43
2.35
Deposit spread 1)
0.44
0.39
Return on allocated capital 2)
12.6
12.8
Cost/income ratio
40.9
39.2
Ratio of deposits to loans
80.1
78.5
Operating expenses
Pre-tax operating profit before impairment
Net gains on fixed and intangible assets
Impairment of loans and guarantees
Profit from operations held for sale, after taxes
Profit for the period
(7.7)
Average balance sheet items in NOK billion
Small and medium-sized enterprises
Key figures in per cent
1)
2)
Calculated relative to the 3-month money market rate.
Calculated on the basis of allocated capital, corresponding to the
external capital adequacy requirement which must be met by the
DNB Group.
Pre-tax operating profit was in line with the fourth quarter of 2015.
Pressure on spreads was a factor behind the decline in net interest
income, which, however, was offset by strict cost control and
reversals on impairment losses on loans related to the sale of a
portfolio of non-performing loans.
In November 2015, a portfolio of fixed-rate home mortgages
amounting to approximately NOK 20 billion was sold from DNB
Boligkreditt to DNB Livsforsikring, and in November 2016,
mortgages representing an additional NOK 5 billion were sold.
Adjusted for these sales, average loans to customers were up 4.8
per cent from the fourth quarter of 2015. The home mortgages are
included in DNB Livsforsikring’s portfolio as an investment that
yields a healthy return for the company, though the customers
are still served by the bank. Adjusted for a portfolio of deposits
of NOK 8 billion from associations and clubs that was transferred
to the small and medium-sized enterprises segment in December
2016, there was an average rise in deposits of 2.5 per cent from the
fourth quarter of 2015.
Weighted average combined spreads contracted by 0.15 percentage points from the fourth quarter of 2015 and by 0.03 percentage points from the third quarter of 2016. Approved interest
rate adjustment with effect as of 9 January 2017 will help reverse
the negative trend.
There was a stable level of net other operating income from the
fourth quarter of 2015. Income from insurance products showed a
positive trend, while the level of income from payment transfers and
real estate broking was maintained. Lower interchange fees as of
1 September and costs related to SAS Eurobonus agreements had
a negative impact on income.
Implemented restructuring measures and strict cost control
ensured lower costs compared with the previous year. Restructuring
costs were in line with the 2015 figure.
Close to 95 per cent of loans to personal customers represent
well-secured home mortgages entailing low risk. Impairment losses
in the fourth quarter of 2016 reflected reversals of NOK 147 million
related to a portfolio of non-performing consumer loans which was
4th quarter
Net gains on fixed and intangible assets
Impairment of loans and guarantees
Profit from repossessed operations
Profit for the period
Change
Average balance sheet items in NOK billion
Key figures in per cent
1)
2)
Calculated relative to the 3-month money market rate.
Calculated on the basis of allocated capital, corresponding to the
external capital adequacy requirement which must be met by the
DNB Group.
Increases in both net interest income and other operating income
contributed to a rise in pre-tax operating profits from the fourth
quarter of 2015.
Average loans to customers increased by 5.3 per cent from the
fourth quarter of 2015, while average customer deposits were up
7.4 per cent. From year-end 2015 to year-end 2016, deposits from
customers increased by 13.5 per cent, including deposits transferred from the personal customer segment. Adjusted annual growth
was 8.7 per cent. Combined with wider interest rate spreads this
ensured an increase in net interest income compared with the
fourth quarter of 2015.
The significant improvement in net other operating income
primarily reflected higher income from cash management and
increased activity within interest rate hedging products. Income
from investment banking products showed very positive growth.
The increase in operating expenses from the fourth quarter of
2015 was partly due to restructuring costs and higher IT development costs. Costs related to defined-contribution pensions, foreign
4 / DNB GROUP – FOURTH QUARTER REPORT 2016 (PRELIMINARY AND UNAUDITED)
exchange, fixed-income and equity products increased as a
reflection of the higher level of activity.
Net impairment losses totalled 0.50 per cent of net loans on an
annual basis, down from 0.65 per cent in the fourth quarter of 2015.
The impairment losses stemmed primarily from a few exposures
spread over various industries and geographical areas, of which
one non-oil related exposure accounted for approximately 37 per
cent of total impairment losses. There has been no material
deterioration in the general quality of DNB’s portfolio of loans to
small and medium-sized corporate customers. Developments in oilrelated sectors as well as all other sectors are closely monitored,
and preventive measures are implemented to retain the level of
quality.
DNB expects lending growth to small and medium-sized
corporate customers to be on a level with the expected domestic
credit growth to this customer segment.
Large corporates and international customers
4th quarter
Change
Net impairment losses on loans and guarantees increased
compared with the fourth quarter of 2015, mainly due to the
exposure to oil-related industries and the offshore markets. On an
annual basis, net impairment represented 1.19 per cent of average
loans, up 0.45 percentage points from the year-earlier period. There
was a 0.54 percentage point rise in individual impairment losses, to
1.01 per cent in the fourth quarter of 2016, while collective impairment was reduced by 0.09 percentage points, reflecting generally
more stable economic conditions compared with the fourth quarter
of 2015. Net non-performing and doubtful loans and guarantees
amounted to NOK 20.2 billion at end-December 2016, compared
with NOK 9.5 billion a year earlier.
DNB is operating in highly competitive markets and one of the
challenges facing the Group is different capital requirements for
banks. In consequence of strict capital requirements in Norway
combined with higher impairment losses, 2016 was a challenging
year for the large corporate segment in DNB. The main aim for the
business area is to strengthen profitability and contribute to fulfilling
DNB’s long-term ambitions. A reduction in and rebalancing of large
corporate exposures through 2017, focusing on higher turnover in
the portfolio, will ensure lower final hold on DNB’s books and
increase ancillary income. Interest rate spreads are expected to
increase somewhat, and new transactions are expected to
contribute positively in a longer-term perspective. DNB will continue
to focus on utilising in-depth industry expertise, offering a wide
product range and up-to-date technological solutions to prioritised
customers. Through close relations with leading companies, DNB is
well-positioned to cover a wide range of customers’ financial needs
and increase the contribution from non-lending products, such as
investment banking, trade finance, leasing, factoring and definedcontribution pensions.
Income statement in NOK million
2016
2015
NOK mill
%
Net interest income
3 668
3 929
(261)
(6.6)
Net other operating income
1 519
1 358
161
11.8
Total income
5 187
5 287
(100)
(1.9)
(1 976)
(2 202)
225
10.2
3 211
3 086
125
4.0
(4)
5
(8)
(1 586)
(1 079)
(507)
7
(6)
13
Pre-tax operating profit
1 628
2 006
(378)
Tax expense
(439)
(582)
142
24.4
Profit for the period
1 188
1 424
(236)
(16.6)
Net loans to customers
531.1
579.3
(48.2)
(8.3)
Trading
Deposits from customers
367.0
403.5
(36.4)
(9.0)
This segment comprises market making and other trading in foreign
exchange, fixed-income, equity and commodity products, including
the hedging of market risk inherent in customer transactions.
Customer activities are supported by trading activities.
Operating expenses
Pre-tax operating profit before impairment
Net gains on fixed and intangible assets
Impairment of loans and guarantees
Profit from repossessed operations
(18.8)
Average balance sheet items in NOK billion
Key figures in per cent
Lending spread 1)
2.23
2.19
Deposit spread 1)
(0.05)
(0.12)
Return on allocated capital 2)
5.5
8.0
Cost/income ratio
38.1
41.6
Ratio of deposits to loans
69.1
69.6
1)
2)
4th quarter
Income statement in NOK million
Calculated relative to the 3-month money market rate.
Calculated on the basis of allocated capital, corresponding to the
external capital adequacy requirement which must be met by the
DNB Group.
2015
NOK mill
1
3
(3)
Net other operating income
817
796
21
2.7
Total income
818
799
19
2.3
(159)
(97)
(62)
Net interest income
Operating expenses
Pre-tax operating profit
Lower volumes and higher impairment losses on loans were the
main factors behind the reduction in profits compared with the
fourth quarter of 2015.
Average lending volumes were down 8.3 per cent from the
fourth quarter of 2015. Adjusted for exchange rate movements,
the underlying volume declined by 6.4 per cent. The reduction is
a consequence of the rebalancing of the business area’s overall
portfolio and the restructuring of portfolios within shipping and oil
and offshore-related segments. Customer deposits were down 9.0
per cent from the fourth quarter of 2015. Adjusted for exchange rate
movements, the decline was 7.7 per cent.
Due to reduced volumes, net interest income was down
compared with the fourth quarter of 2015. Weighted average
combined spreads widened by 5 basis points from the fourth
quarter of 2015 due to increased lending and deposit spreads.
Other operating income was up 11.8 per cent from the fourth
quarter of 2015, mainly reflecting higher activity within investment
banking products related to both debt and equity capital markets,
such as mergers and acquisitions.
Operating expenses decreased by 10.2 per cent from the fourth
quarter of 2015 and increased by 2.4 per cent from the third quarter
of 2016. The number of full-time positions was reduced by 74 from
end-December 2015. The reductions took place in both Norwegian
and international operations.
Change
2016
Tax expense
Profit for the period
%
659
702
(44)
(165)
(183)
18
(6.2)
9.8
494
520
(26)
(4.9)
27.2
28.4
Key figures in per cent
Return on allocated capital 1)
1)
Calculated on the basis of allocated capital, which corresponds to the
external capital adequacy requirement which must be met by the
DNB Group.
All product areas contributed positively to a profitable quarter for
trading activities, with particularly strong contributions from money
market activities and trading in Norwegian interest rate instruments.
DNB GROUP – FOURTH QUARTER REPORT 2016 (PRELIMINARY AND UNAUDITED) / 5
Traditional pension products
This segment comprises the portfolio of traditional defined-benefit
pension products in DNB Livsforsikring. DNB no longer offers such
products to new customers.
company’s solvency position without the transitional rules primarily
reflected a rise in market rates, higher buffer capital and reserves
for higher life expectancy during the quarter.
Full year 2016
4th quarter
Income statement in NOK million
Change
2016
2015
NOK mill
Upfront pricing of risk and guaranteed
rate of return
56
137
(81)
Owner's share of administration result
79
78
1
1.3
101
82
18
22.5
832
Owner's share of risk result
Owner's share of interest result
(168)
(1 001)
Return on corporate portfolio
116
107
9
Pre-tax operating profit
184
(596)
780
Tax expense
Profit for the period
49
705
(657)
233
109
123
202.8
200.3
2.5
34.3
(14.3)
4.7
2.4
%
8.2
Average balance sheet items in NOK billion
Assets under management
1.3
Key figures in per cent
Cost/income ratio
Return on allocated capital 1)
1)
Calculated on the basis of allocated capital, which corresponds to the
external capital adequacy requirement which must be met by the
DNB Group.
There was a healthy level of profits in the fourth quarter of 2016, in
spite of a reduction in income from upfront pricing relating to the
conversion from defined-benefit to defined-contribution pension
schemes. In the fourth quarter of 2015, operating profits were
reduced by NOK 980 million due to a transfer from the risk
equalisation fund to the policyholders’ premium reserve.
The prolonged low interest rate level could make it challenging
for life insurance companies to achieve a satisfactory level of
earnings over the coming years. DNB Livsforsikring has adapted to
the low interest rate level by holding a large portfolio of long-term
bonds at amortised cost, fixed-rate home mortgages and property
investments. The structure of the portfolios will help ensure that
returns will cover the guaranteed rate of return over the next years.
Each quarter, DNB Livsforsikring carries out a test to assess
whether the company has adequate premium reserves. In the test,
insurance provisions calculated on the basis of market rates and
insurance liabilities calculated on the basis of the contracts’ base
rate (guaranteed rate of return) are compared. The test showed
positive margins at year-end 2016.
In consequence of higher life expectancy, it will be necessary
to strengthen the premium reserve for group pension insurance. At
end-December 2016, reserves for higher life expectancy totalled
NOK 10.8 billion, while the total required increase in reserves is
estimated at NOK 11.4 billion. The reserves were increased by
NOK 0.5 billion during the fourth quarter. The remaining required
increase in reserves of NOK 0.6 billion will be financed during the
period up to and including 2020. The entire amount refers to paidup policies, while the required increase relating to defined-benefit
pensions was fully financed during 2016. The remainder may be
financed by the policyholders’ interest result, provided that the
return is adequate to cover both the rate of return guaranteed in
the contracts and the required increase in reserves for higher life
expectancy. This gives the company a sound basis for providing
DNB with profits also in the remaining years in which reserves have
to be strengthened.
The Solvency II directive stipulates solvency capital requirements. DNB Livsforsikring has been given permission to use the
transitional rules for insurance provisions, which ensures a
controlled and predictable implementation of Solvency II. The
solvency margin, calculated according to the transitional rules,
was 209 per cent as at 31 December 2016. Without the transitional
rules, DNB Livsforsikring had a solvency margin of 152 per cent. At
end-September 2016, the solvency margins were 208 per cent and
119 per cent, respectively. The significant strengthening of the
DNB recorded profits of NOK 19 251 million in 2016, down
NOK 5 521 million from 2015.
Despite high impairment losses, mainly in oil-related industries
and shipping, DNB delivered solid profits.
The target for the common equity Tier 1 capital ratio was
reached one year ahead of plan and was 16.0 per cent at year-end
2016. This is conditional on a dividend payout ratio of 49.8 per cent.
Common equity Tier 1 capital increased by NOK 5.3 billion in the
period. A strategic reduction in loans to large international
corporates with low profitability contributed to the increase in the
CET1 ratio, as did profits generated during the period. The payout
ratio is in accordance with the Group’s ambition to increase
dividend payments.
Return on equity was 10.1 per cent, compared with 14.5 per
cent in 2015. Despite the build-up of capital, higher impairment
losses and the closing of branch offices, the Group delivered a
double-digit return on equity.
Increased funding costs and a decline in amortisation and fee
income had a negative impact on net interest income in 2016. Due
to changes in customer behaviour, amortisation periods are
increasing, since customers are no longer so eager to refinance
their loans. Volume-weighted spreads narrowed slightly. The
interest rate adjustments for personal customers implemented in
the fourth quarter of 2016 will have full effect from the start of
January 2017. Lending volumes were down in 2016, reflecting a
strategic reduction in low profitability exposures in the large
corporates and international customers portfolio.
Other operating income was NOK 595 million lower than in
2015, mainly due to the effect of basis swaps.
Operating expenses were up NOK 1 423 million from 2015,
which was primarily a consequence of the transition from a definedbenefit to a defined-contribution pension scheme in the fourth
quarter of 2015. Adjusted for non-recurring effects, there was a
reduction in underlying operating expenses of NOK 374 million or
1.8 per cent. DNB continued to invest in IT infrastructure in 2016 to
prepare for future competition.
Impairment losses on loans and guarantees increased by
NOK 5 154 million during the year due to higher individual
impairment in the shipping and offshore segments. There was
also a rise in collective impairment, reflecting weaker economic
conditions in some industries. Excluding the sale of non-performing
portfolios during 2015 and 2016, impairment losses increased by
NOK 4 750 million.
The engagement index in the employee survey remained high
at 84 points. This paints a picture of a robust organisation that has
coped well through extensive restructuring, but is naturally affected
by the reorganisation processes in the Group. Sickness absence in
DNB’s Norwegian operations was 4.5 per cent in 2016, a slight
increase from 4.4 per cent in 2015. The special follow-up of units
with high sickness absence rates continued.
The Board of Directors has proposed a dividend for 2016 of
NOK 5.70 per share, which corresponds to 49.8 per cent of profits.
When considering the dividend proposal, the Board of Directors has
taken the regulatory capital adequacy requirements into account.
The payout ratio is in accordance with the Group’s ambition to
increase dividend payments.
6 / DNB GROUP – FOURTH QUARTER REPORT 2016 (PRELIMINARY AND UNAUDITED)
Income statement for 2016
Net interest income
Amounts in NOK million
Net interest income
2016
Change
2015
34 110
(1 248)
35 358
Exchange rate movements
480
Other net interest income
(42)
Lending and deposit spreads, customer segments
(100)
Equity and non-interest bearing instruments
(149)
Long-term funding costs
(329)
Lending and deposit volumes, customer segments
(464)
Amortisation effects and fees
(644)
Net interest income was down NOK 1 248 million from 2015. The
reduction was mainly attributable to a decline in amortisation and
fee income and an increase in long-term funding costs. Due to
changes in customer behaviour, amortisation periods are
increasing, and customers are no longer so eager to refinance their
loans. Consequently, amortisation and fee income was reduced by
NOK 644 million compared with 2015. The reduction in volumes
from 2015, was offset by exchange rate effects. Average lending
spreads narrowed by 0.14 percentage points from 2015, while
deposit spreads widened by 0.20 percentage points. There was an
average increase of NOK 0.2 billion in the performing loan portfolio,
while average deposits rose by NOK 9.2 billion compared with
2015.
Net other operating income
Amounts in NOK million
Net other operating income
2016
Change
2015
18 053
(595)
18 648
Sale of holdings in Visa
1 128
Net gains on other financial instruments
1 057
Use of the risk equalisation fund in 2015
980
Net gains on the sale of loans
258
Other operating income
236
Realised gains and rents from investment
properties in København Ejendomme in 2015
(583)
Basis swaps
Operating expenses
2016
Change
2015
(20 693)
374
(21 068)
Expenses related to operations
Other costs
268
Salaries and other personnel expenses
(excl. pension and restructuring costs)
196
IT expenses
117
Pension expenses
(65)
Provisions for financial activities tax
Non-recurring effects
(142)
(639)
IT restructuring
Restructuring costs
Other non-recurring effects
Operating expenses
(1 797)
1 157
234
(234)
(857)
(377)
(480)
218
(1 654)
1 871
(21 333)
(1 423)
(19 910)
Of which:
Exchange rate effects for units outside Norway
Currency-adjusted operating expenses
Impairment losses on loans and guarantees totalled NOK 7 424 million in 2016, up NOK 5 154 million from 2015.
Total impairments losses for 2016 were mainly related to
shipping, offshore and energy in the large corporate and international customers segment. Individual impairment losses stemmed
primarily from a small number of large customers. The sale of nonperforming portfolios led to recoveries and reassessed impairment
in the personal customer segment totalling NOK 668 million in
2016, compared with NOK 1 067 million in 2015.
The rise in collective impairment is mainly related to negative
migration and less favourable economic conditions in these
industries. The other credit portfolios are still of high quality and the
difficult situation in the oil-related industries has had no material
impact on these portfolios.
Net non-performing and doubtful loans and guarantees
amounted to NOK 25.7 billion at end-December 2016, up from
NOK 14.0 billion at year-end 2015. Net non-performing and doubtful
loans and guarantees represented 1.49 per cent of the loan portfolio, an increase of 0.73 percentage points from end-December
2015. The increase in non-performing and doubtful loans and
guarantees is linked to shipping, offshore and energy in the large
corporate and international customers segment.
Taxes
(3 227)
Net other operating income decreased by NOK 595 million from
2015. There was a strong increase in net gains on other financial
instruments due to a higher level of activity in the equity, foreign
exchange and interest rate markets. Profits from the sale of Visa
Norway’s holding in Visa Europe gave a NOK 1 128 million rise
in income in 2016. Basis swaps gave a reduction in profits of
NOK 3 227 million compared with the same period in 2015. Other
operating income in 2015 was negatively affected by the transfer
from the risk equalisation fund to the policyholders’ premium
reserve in DNB Livsforsikring.
Total adjusted operating expenses
Impairment of loans and guarantees
(444)
Net commissions and fees
Amounts in NOK million
Total operating expenses were up 7.1 per cent from 2015. Adjusted
for non-recurring effects, there was a 1.8 per cent reduction in
expenses. Significant non-recurring effects had a negative impact
and resulted in a rise in expenses of NOK 1 797 million. The main
factor was lower personnel expenses in 2015 due to the transition
from a defined-benefit to a defined-contribution pension scheme.
Exchange rate effects gave an increase of NOK 104 million. In the
longer term, implemented restructuring measures will ensure lower
costs and a reduction in both the number of employees, the number
of branch offices and the number of production units. Provisions for
financial activities tax represented NOK 142 million.
(104)
(20 590)
478
(21 068)
The DNB Group's tax expense for 2016 was NOK 4 140 million,
representing 18 per cent of pre-tax operating profits. The tax rate
was down 4 percentage points from 2015. The tax rate was lower
than the anticipated rate of 22 per cent, mainly due to equity sales
under the tax exemption model, reduced tax expenses in entities
outside Norway, and Norwegian taxation rules for the allocation of
interest expenses between Norway and the US.
Funding, liquidity and balance sheet
Throughout the year, the short-term funding markets were
characterised by uncertainty related to the effects of new regulatory
reforms for US money market funds. The limited availability of
longer maturities in combination with increased demand led to wider
spreads. DNB had ample access to short-term funding throughout
the year.
The long-term funding markets were characterised by
regulatory and political uncertainty in 2016. Concerns related to the
Chinese economy and a weaker growth outlook for European banks
led to higher spreads and lower activity at the beginning of the year.
Spreads were markedly reduced after the European Central Bank
meeting in March, where, among other things, the asset purchase
programme was further expanded. The level of activity declined
towards the summer as the EU referendum in the UK was
approaching. After the vote markets normalised and spreads
decreased. The activity level was once again down ahead of the US
presidential election, but increased markedly afterwards. Concerns
related to a potential reduction in the ECB’s asset purchase
programme resulted in wider spreads towards the end of the year.
DNB had good access to long-term funding in 2016 and
spreads on covered bonds and ordinary senior debt decreased
markedly throughout the year.
DNB GROUP – FOURTH QUARTER REPORT 2016 (PRELIMINARY AND UNAUDITED) / 7
The nominal value of long-term debt securities issued by the
Group was NOK 580 billion at end-December 2016 and NOK 606
billion a year earlier. The average remaining term to maturity for
these debt securities was 3.9 years at end-December 2016,
compared with 3.8 years at year-end 2015.
The short-term liquidity requirement, Liquidity Coverage Ratio
(LCR), remained stable at above 100 per cent throughout the year.
At end-December 2016, the total LCR was 138 per cent.
Total combined assets in the DNB Group were NOK 2 931
billion, up from NOK 2 901 billion at end-December 2015. Total
assets in the Group’s balance sheet were NOK 2 653 billion as at
31 December 2016 and NOK 2 599 billion a year earlier. Of this,
total assets in DNB Livsforsikring amounted to NOK 299 billion and
NOK 288 billion, respectively.
In the DNB Bank Group, loans to customers decreased by
NOK 40 billion or 2.6 per cent from end-December 2015. Customer
deposits were down NOK 12 billion or 1.2 per cent during the same
period. For the banking group the ratio of customer deposits to net
loans to customers was up from 62.5 per cent at end-December
2015 to 63.4 per cent a year later. The Group’s ambition is to have
a ratio of customer deposits to net loans, for the banking group, of
minimum 60 per cent.
Risk and capital adequacy
The DNB Group quantifies risk by measuring economic capital.
Economic capital declined by NOK 2.7 billion from year-end 2015,
to NOK 73.0 billion at year-end 2016.
Economic capital for the DNB Group
31 Dec.
30 Sept.
30 June
31 Dec.
Amounts in NOK billion
2016
2016
2016
2015
Credit risk
54.4
54.8
55.8
55.5
Market risk
7.0
7.0
7.2
7.1
Market risk in life insurance
5.3
5.7
9.3
8.3
Insurance risk
1.7
1.7
1.7
2.0
11.5
11.5
11.5
11.2
Operational risk
Business risk
Gross economic capital
Diversification effect 1)
7.3
7.3
7.3
7.1
87.2
87.9
92.7
91.2
(14.2)
(14.7)
(15.9)
(15.5)
Net economic capital
73.0
73.3
76.8
75.7
Diversification effect in per cent of
gross economic capital 1)
16.3
16.7
17.1
17.0
1)
The diversification effect refers to the risk-mitigating effect achieved by
the Group by having operations which are affected by different types of
risk where unexpected losses are unlikely to occur at the same time.
Economic capital for credit declined by NOK 1.1 billion through
2016, reflecting a reduction in credit volumes in the large corporate
portfolio of approximately NOK 90 billion in terms of exposure at
default (EAD). There was continued sound and stable credit quality
in most portfolios, though some sectors faced significant challenges
in 2016. The reduction in oil and gas investments had the most
pronounced effect on oil service and offshore companies, and there
were several extensive restructurings in these sectors in 2016. DNB
devotes considerable resources and professional expertise to these
processes and expects this to continue into 2017.
The situation for traditional shipping companies has been
demanding, but far less dramatic than for oil-related industries.
Rates in the dry bulk market improved in 2016, but from a
historically low level. Rates in the tanker segment were strong in the
first half, but declined in the second half of the year, while rates in
the container segment were weak throughout the year. It might also
become necessary to restructure companies in these segments.
Economic capital for market risk in DNB Livsforsikring declined
by NOK 3.0 billion during the year, reflecting a lower equity
exposure, larger buffers and higher interest rates. The company
strengthened its solvency capital by NOK 6.2 billion in 2016. DNB
Livsforsikring’s solvency margin was 152 per cent at year-end 2016.
DNB’s market risk exposure in operations other than life insurance
was virtually unchanged during 2016.
The operational risk situation in 2016 was satisfactory, and
there was a low level of losses. Efforts to strengthen information
security in the Group have been intensified to meet the increasing
threats relating to the protection of confidential information and
cyberattacks. In general, IT operations became more stable during
2016, which was mainly attributable to the upgrading of the IT
infrastructure in connection with the move of the Group’s data
processing centres to a single location in 2015. In August, a
successful full-scale test of disaster recovery solutions for DNB’s
mainframe computer was conducted. The test confirmed that the
Group’s solution is robust and reliable.
Calculated according to transitional rules, risk-weighted assets
were reduced by NOK 78 billion from year-end 2015, to NOK 1 051
billion. The common equity Tier 1 capital ratio was 16.0 per cent,
while the capital adequacy ratio was 19.5 per cent.
New regulatory framework
Capital adequacy requirements for banks
The capital adequacy requirements for banks consist of two pillars.
Pillar 1 encompasses minimum requirements and buffer requirements determined by the political authorities. Expectations from
Finanstilsynet (the Financial Supervisory Authority of Norway) in the
form of Pillar 2 requirements come in addition to this. Pillar 2 is
intended to reflect institution-specific capital requirements related
to risk factors which are not covered, or are only partly covered, by
Pillar 1. The Pillar 2 requirement for DNB is set at 1.5 per cent. New
rules for the calculation of the counter-cyclical capital buffer entered
into force as of 1 October 2016. For DNB, this means that the
counter-cyclical buffer requirement will be the weighted average
of the buffer rates for the countries where the bank has credit
exposures. At year-end 2016, the common equity Tier 1 capital
requirement was 14.7 per cent under Pillar 1 and 2. This included
a counter-cyclical capital buffer of 1.5 per cent. The counter-cyclical
capital buffer requirement in Norway will increase by 0.5 percentage
points, to 2.0 per cent, as of 31 December 2017.
There is a need to have a margin over the total common equity
Tier 1 capital requirement to take into account expected fluctuations
in exchange rates and market prices. In the opinion of
Finanstilsynet, DNB should have a margin of approximately
1 percentage point, which means that the Group needed to have a
common equity Tier 1 capital ratio of approximately 15.7 per cent at
year-end 2016.
The Ministry of Finance has approved a regulatory change that
clarifies the regulations on the consolidation of capital requirements
for banks and insurance companies. This has implications for how
IRB banks that have ownership interests in insurance companies
(an IRB bank uses internal models to calculate and report credit
risk) should calculate the Basel I floor that is unique to Norway. The
regulatory change came into effect on 1 January 2017 and reduces
the DNB Group's common equity Tier 1 capital ratio by approximately 20 basis points.
As a supplement to the risk-weighted capital requirements and
as a measure to counter adjustments and gaps in the regulations,
a non-risk based capital requirement, leverage ratio, will also be
introduced. The Basel Committee has recommended and the
European Commission has proposed a leverage ratio requirement
of minimum 3 per cent as from 2018. In Norway, the Ministry of
Finance has set the minimum leverage ratio requirement at 3 per
cent as of 30 June 2017. All Norwegian banks must have a buffer
on top of the minimum requirement of at least 2 per cent.
Systemically important banks must have an additional buffer of
minimum 1 per cent. As a systemically important bank in Norway,
the total requirement for DNB will thus be 6 per cent. At year-end
2016, DNB had a leverage ratio of 7.3, well above the upcoming
requirement.
8 / DNB GROUP – FOURTH QUARTER REPORT 2016 (PRELIMINARY AND UNAUDITED)
New rules on deposit guarantees and crisis management
The implementation of the EU legislative acts for the winding-up
and restructuring of banks, BRRD (Bank Recovery and Resolution
Directive), and the revised Directive on Deposit Guarantee
Schemes (DGS) will require extensive changes in the Norwegian
crisis resolution system, including the rules on public administration
and the role of the Norwegian Banks' Guarantee Fund. The Banking
Law Commission has considered how the directives should be
implemented in Norwegian law. Among other things, it has been
proposed that the banks should pay annual levies to both a deposit
guarantee fund and a resolution fund. This will have practical
consequences for the current fund structure and the obligation to
pay levies. The Ministry circulated the draft legislation for public
consultation in the fourth quarter of 2016.
Norway has joined the EU financial supervisory system
Due to a stipulation in the Norwegian Constitution on limited access
to transfer powers to international organisations, it was not possible
to incorporate the EU regulations establishing the European
supervisory authorities into the EEA agreement until the autumn of
2016. The EFTA Surveillance Authority, ESA, has been granted
competence to make legally binding decisions addressed to
national supervisory authorities and individual institutions in
Norway, Liechtenstein and Iceland. Decisions will be based on
drafts prepared by the relevant EU supervisory authority. ESA and
the national supervisory authorities in the three EEA/EFTA states
shall participate, without voting rights, in the EU’s three European
supervisory authorities, EBA, ESMA and EIOPA. Also, the EU
supervisory authorities shall participate, without voting rights, in
ESA’s work in this field. The same applies to preparatory bodies.
The EU supervisory authorities will be granted competence to
issue recommendations, that is non-binding decisions, vis-à-vis
EEA/EFTA national authorities and enterprises. Parallel to this, a
process is underway to incorporate the remaining several hundred
legislative acts on financial services that have been accumulated in
the EEA Joint Committee into the EEA agreement and Norwegian
legislation.
Home mortgage lending regulation
The Ministry of Finance has adopted a new home mortgage
regulation effective as of 1 January 2017 as a measure against the
strong growth in housing prices and household debt, especially in
Oslo. The regulation requires that mortgage customers provide a
down payment of 15 per cent. Customers who want to buy a
second residential property in the municipality of Oslo must provide
a 40 per cent down payment. As previously applied, borrowers must
be able to withstand an interest rate increase of 5 percentage
points, and this requirement is supplemented by a new provision on
the customer’s loan-to-income ratio. Loans are not to be granted if
the customer's total debt exceeds five times gross annual income.
Interest-only loans (including home equity credit lines) must not
exceed 60 per cent of the property’s assessed value. Financial
institutions may grant loans that do not meet one or more of the
criteria in the regulation for up to 10 per cent of the value of total
approved loans, but only 8 per cent in the municipality of Oslo.
Report on Own Pension Account
At the request of the parties in the labour market, the government
has considered how all pension entitlements for individual
employees can be accumulated in one pension account that follows
the employee through his/her working life. This will ensure better
oversight and greater influence over the accumulation of pension
entitlements, make it easier to safeguard one’s own pension when
changing jobs and provide more cost-effective management of
previously earned pension entitlements. In addition, individuals can
themselves choose to save additional money in their pension
account. The report provides a good basis for making further
assessments, and it is up to the parties in the labour market to
agree on whether they would like to proceed with a solution that
includes an Own Pension Account.
Macroeconomic developments
Global GDP increased by approximately 3 per cent in 2016, about
the same as the year before. However, growth was unevenly
distributed. The emerging economies had considerably stronger
growth than the industrialised countries, with an economic growth
rate of approximately 1.5 per cent from 2015 to 2016. Eight years
after the financial crisis, the more economically developed
countries, MEDCs, are still characterised by spare capacity, low
inflation and historically low interest rates. This also affects the
political landscape. President Donald Trump has signalled a strong
fiscal stimulus package. This has increased expectations with
respect to both growth and inflation, and was an important driver of
the hike in long-term interest rates towards the end of 2016.
In the United States, the cyclical upturn appears to continue.
After a weak start to 2016, the economy showed signs of recovery.
Several factors are helping to keep up growth momentum.
Monetary policy remains expansionary while fiscal policy is
expected to become more expansionary. Higher oil prices are
making a positive contribution to the energy sector, counteracting
the weakening of households’ purchasing power. In addition, the
tightening effects of the strong US dollar are starting to abate.
Growth in the Chinese economy appears to be more stable than
expected. This is partly due to the authorities' expansionary policy
and partly to the higher commodity prices, which have helped
improve earnings in many industries. However, higher debt levels
and unprofitable investments are increasing the risk of a crisis at
some time in the future. In the short term, the greatest risk factors
include capital flight, which will probably be intensified by higher US
dollar interest rates and the authorities’ restrictive housing policy,
which may result in an unwanted reduction in housebuilding activity,
higher loan default rates and lower consumption growth.
The result of the EU referendum in the United Kingdom has so
far had fewer negative consequences than expected. The financial
turmoil was short-lived and domestic demand remained buoyant
well into the autumn of 2016. The British pound has weakened
more than expected, which is positive for the British export
economy. The downside is that the weaker currency also results
in higher inflation, which will weaken households’ real disposable
income.
GDP for Mainland Norway rose by approximately 0.7 per cent
from 2015 to 2016, slightly lower than the previous year. The fall in
oil investments was the most important factor behind the weak
growth levels and had the most pronounced effect on petroleumrelated industries. Employment levels in the mainland economy
were virtually unchanged from the year before, stimulated by
increased public demand, more construction workers and growth in
some tourism-based industries. In other industries, however, there
were few signs of employment growth in 2016. The weakening of
the Norwegian krone in preceding years has strengthened
Norwegian tourist companies, parts of the transportation sector and
the hotel and restaurant industry. The depreciation of the krone also
made a significant impact on inflation and reduced households’
purchasing power. Real wages probably declined by more than
1 per cent, the weakest trend since 1981. According to AKU (a
Norwegian labour force survey), the unemployment rate rose to 4.8
per cent, while the number of unemployed people registered with
the Norwegian Labour and Welfare Administration (NAV) decreased
slightly during the year. Zero growth in employment, however,
supports the view that the labour market weakened slightly in 2016.
In the housing market, prices rose significantly in the second half of
the year. For the year as a whole, price inflation was 8.3 per cent. In
Oslo, increases in housing prices were particularly strong, which
was a major reason why the Norwegian government tightened the
rules for home mortgages.
DNB GROUP – FOURTH QUARTER REPORT 2016 (PRELIMINARY AND UNAUDITED) / 9
Future prospects
Economic forecasts for 2017 indicate continued moderate growth
in the global economy. Growth is expected to pick up in the United
States, be marginally reduced in China and have a somewhat
steeper decline in the eurozone and the United Kingdom. In
Norway, activity levels in the mainland economy are expected
to increase somewhat, but hardly enough to cause any major
reduction in unemployment levels. Internationally, there is
significant risk related to factors such as global political changes,
increasing financial imbalances in China, economic and political
developments in the United States and the situation for some
European banks.
DNB presented its updated financial ambitions for 2017-2019 at
the Capital Markets Day in November. The principal target is still to
achieve a return on equity above 12 per cent towards 2019. Several
factors will contribute to reaching the return on equity target,
including strong emphasis on profitability through strict cost control
and more efficient use of capital.
The Group has set a target for its common equity Tier 1 capital
ratio of 16.0 per cent from year-end 2017, including the announced
change in the counter-cyclical buffer. With a CET1 ratio of 16.0 per
cent at end-December 2016, DNB reached the target one year
ahead of plan, and is well positioned for possible new requirements.
The Group aspires to have a cost/income ratio below 40 per
cent towards 2018 and a dividend payout ratio of more than 50 per
cent from 2017. A share buy-back programme in addition to a cash
dividend will be considered.
Volume-weighted spreads are anticipated to widen somewhat in
2017, while lending volumes are expected to be stable in 2017 and
2018. During this period, total loans are expected to increase for
personal customers and small and medium-sized enterprises, while
the Group will actively reduce its portfolio of loans to large corporates and international customers. In 2019, total lending volume is
expected to rise by 2 to 3 per cent. Adjusted for exchange rate
movements, risk-weighted assets are expected to be stable. DNB
aims to increase commission and fee income by approximately
3 per cent per year. Total impairment losses for the period 2016
to 2018 are estimated to be up to NOK 18 billion, with the highest
impairment losses during the first part of the period.
Long-term funding costs are expected to decrease somewhat
from 2016 to 2017.
The tax rate is expected to be 23 per cent in the period from
2017 to 2019.
10 / DNB GROUP – FOURTH QUARTER REPORT 2016 (PRELIMINARY AND UNAUDITED)
Oslo, 1 February 2017
The Board of Directors of DNB ASA
Anne Carine Tanum
(chairman)
Jarle Bergo
Tore Olaf Rimmereid
(vice-chairman)
Carl A. Løvvik
Jaan Ivar Semlitsch
Vigdis Mathisen
Berit Svendsen
Rune Bjerke
(group chief executive)
DNB GROUP – FOURTH QUARTER REPORT 2016 (PRELIMINARY AND UNAUDITED) / 11
Income statement
DNB Group
Amounts in NOK million
Note
Total interest income
Total interest expenses
Net interest income
Commission and fee income
Commission and fee expenses
Net gains on financial instruments at fair value
Net financial result, DNB Livsforsikring 1)
Net risk result, DNB Livsforsikring
Net insurance result, DNB Forsikring 1)
Profit from investments accounted for by the equity method
Net gains on investment properties
Other income
Net other operating income
Total income
Salaries and other personnel expenses
Other expenses
Depreciation and impairment of fixed and intangible assets
Total operating expenses
Pre-tax operating profit before impairment
Net gains on fixed and intangible assets
Impairment of loans and guarantees
Pre-tax operating profit
Tax expense 1)
Profit from operations held for sale, after taxes
Profit for the period
5
5
5
6
6
7
8
8
8
8
10
9
Portion attributable to shareholders
Portion attributable to additional Tier 1 capital holders
Profit for the period
4th quarter
2016
4th quarter
2015
Full year
2016
Full year
2015
13 273
(4 901)
8 372
2 814
(678)
1 689
(57)
290
181
(45)
(7)
44
4 230
12 602
(2 842)
(1 828)
(524)
(5 194)
7 409
(12)
(1 753)
5 644
(290)
26
5 380
13 934
(4 872)
9 062
2 916
(834)
2 164
(928)
247
132
(28)
122
35
3 825
12 888
(1 106)
(1 931)
(590)
(3 626)
9 262
(9)
(1 420)
7 833
(1 077)
28
6 784
52 424
(18 314)
34 110
11 452
(3 172)
6 513
(72)
736
648
1 189
(35)
795
18 053
52 163
(11 904)
(7 251)
(2 177)
(21 333)
30 830
(19)
(7 424)
23 387
(4 140)
4
19 251
57 532
(22 174)
35 358
11 963
(3 101)
8 683
(1 251)
861
534
(72)
269
762
18 648
54 006
(9 822)
(7 790)
(2 298)
(19 910)
34 096
45
(2 270)
31 871
(7 048)
(51)
24 772
5 143
238
5 380
6 658
126
6 784
18 656
595
19 251
24 398
374
24 772
3.16
3.14
4.11
4.09
11.46
11.46
14.98
15.01
Earnings/diluted earnings per share (NOK)
Earnings per share excluding operations held for sale (NOK)
1)
In consequence of the introduction of the Solvency II regulations on 1 January 2016, certain minor changes in the regulations on annual accounts for nonlife and life insurance companies were approved, effective as of 1 January 2016. Cf. Note 1 Basis for preparation.
Comprehensive income statement
DNB Group
Amounts in NOK million
Profit for the period
Actuarial gains and losses
Property revaluation
Items allocated to customers (life insurance)
Items that will not be reclassified to the income statement
Currency translation of foreign operations 1)
Currency translation reserve reclassified to the income statement
Hedging of net investment 2)
Investments according to the equity method 3)
Investments according to the equity method, reclassified
to the income statement 3)
Items that may subsequently be reclassified to the income statement
Other comprehensive income for the period (net of tax)
Comprehensive income for the period
1)
2)
3)
4th quarter
2016
4th quarter
2015
Full year
2016
Full year
2015
5 380
(23)
37
(37)
(23)
3 562
6 784
31
(282)
282
31
2 369
24 772
673
(204)
204
673
9 612
(2 415)
4
(1 578)
889
19 251
(183)
47
(47)
(183)
(6 476)
(43)
4 346
(25)
(6 203)
889
1 151
1 128
6 509
1 680
1 710
8 494
(855)
(3 052)
(3 236)
16 015
4 298
4 972
29 744
Currency translation effects related to the Baltics came to NOK 103 million in the fourth quarter of 2016.
Hedging of net investments in the Baltics represented a loss of NOK 61 million in the fourth quarter of 2016, net of tax.
DNB had indirect ownership interests in Visa Europe through its membership in Visa Norge. In connection with the valuation of the holdings in Visa Europe
as at 31 March 2016 an accumulated gain of NOK 855 million was recognised in other comprehensive income. Upon the completion of the acquisition of
Visa Europe by Visa Inc in the second quarter of 2016, this amount was reclassified to profit and a total gain of NOK 1 128 million was recognised as
"Profit from investments accounted for by the equity method" in the income statement.
12 / DNB GROUP – FOURTH QUARTER REPORT 2016 (PRELIMINARY AND UNAUDITED)
Balance sheet
DNB Group
Note
Amounts in NOK million
31 Dec.
2016
31 Dec.
2015
208 263
176 442
1 509 078
296 642
22 512
60 220
157 940
94 008
15 912
7 768
5 814
1 404
7 949
52 541
36 709
2 653 201
19 317
301 216
1 542 744
289 695
19 341
49 679
203 029
105 224
16 734
9 525
6 076
1 151
8 860
200
25 739
2 598 530
212 882
934 897
130 161
765 869
60 220
208 160
1 892
8 874
3 816
44 568
41 243
2 094
2 756
29 347
2 446 779
161 537
944 428
154 663
804 928
49 679
208 726
1 846
2 093
7 672
37 675
71
1 285
2 549
30 953
2 408 105
16 286
22 609
15 952
151 576
206 423
2 653 201
16 257
22 609
8 353
143 207
190 425
2 598 530
Assets
Cash and deposits with central banks
Due from credit institutions
Loans to customers
Commercial paper and bonds at fair value
Shareholdings
Financial assets, customers bearing the risk
Financial derivatives
Commercial paper and bonds, held to maturity
Investment properties
Investments accounted for by the equity method
Intangible assets
Deferred tax assets
Fixed assets
Assets held for sale
Other assets
Total assets
13, 14
11, 12, 13, 14
14, 15
14
14
14
13, 15
16
17
Liabilities and equity
Due to credit institutions
Deposits from customers
Financial derivatives
Debt securities issued
Insurance liabilities, customers bearing the risk
Liabilities to life insurance policyholders in DNB Livsforsikring 1)
Insurance liabilities, DNB Forsikring 1)
Payable taxes
Deferred taxes 1)
Other liabilities
Liabilities held for sale
Provisions
Pension commitments
Subordinated loan capital
Total liabilities
13, 14
13, 14
14
13, 14, 18
17
13, 14, 18
Share capital
Share premium
Additional Tier 1 capital
Other equity 1)
Total equity
Total liabilities and equity
Off-balance sheet transactions and contingencies
1)
19
In consequence of the introduction of the Solvency II regulations on 1 January 2016, certain minor changes in the regulations on annual accounts for nonlife and life insurance companies were approved, effective as of 1 January 2016. Cf. Note 1 Basis for preparation.
DNB GROUP – FOURTH QUARTER REPORT 2016 (PRELIMINARY AND UNAUDITED) / 13
Statement of changes in equity
DNB Group
Actuarial
gains and
losses
Currency
translation
2)
reserve
Net investment
hedge
2)
reserve
22 609
(3 247)
8 671
(5 645)
22 609
(3 247)
8 671
(5 645)
673
673
9 612
9 612
(6 203)
(6 203)
Additional
Tier 1
capital
Share
1)
capital
Share
premium
Balance sheet as at 31 Dec. 2014
Changes in accounting principles,
insurance liabilities 3)
Balance sheet as at 1 Jan. 2015
Profit for the period
Other comprehensive income (net of tax)
Comprehensive income for the period
Defined-benefit pension scheme
discontinued
Currency translation reserve
taken to income
Additional Tier 1 capital issued
Interest payments additional
Tier 1 capital
Dividends paid for 2014
(NOK 3.80 per share)
Net purchase of treasury shares
Balance sheet as at 31 Dec. 2015
restated
16 273
16 273
16 257
22 609
8 353
(525)
18 317
Balance sheet as at 31 Dec. 2015
Changes in accounting principles,
insurance liabilities 3)
Balance sheet as at 31 Dec. 2015
restated
Profit for the period
Other comprehensive income (net of tax)
Comprehensive income for the period
Additional Tier 1 capital issued
Interest payments additional
Tier 1 capital
Currency movements taken to income
Defined-benefit pension scheme
discontinued
AGDL provisions in Luxembourg
reclassified to equity
Dividends paid for 2015
(NOK 4.50 per share)
Net purchase of treasury shares
Balance sheet as at 31 Dec. 2016
16 257
22 609
8 353
(525)
18 317
Amounts in NOK million
1)
2)
374
374
2 049
Other
1)
equity
Total
1) 2)
equity
120 063
158 723
337
120 399
24 398
889
25 286
337
159 059
24 772
4 972
29 744
(2 049)
34
4
(31)
8 053
(75)
(75)
(6 189)
(157)
(6 189)
(173)
(11 848)
137 263
190 425
(11 848)
136 916
190 078
347
347
137 263
18 656
(880)
17 775
(43)
190 425
19 251
(3 236)
16 015
7 477
(16)
16 257
22 609
8 353
595
595
7 520
(525)
18 317
(11 848)
(183)
(183)
(6 519)
(6 519)
4 346
4 346
(505)
(11)
(505)
11
17
29
16 286
22 609
15 952
38
8 023
(692)
(17)
11 798
(7 502)
13
13
(7 330)
297
147 971
(7 330)
326
206 423
(345)
326
Of which treasury shares, held by DNB Markets for trading purposes:
Balance sheet as at 31 December 2015
Net purchase of treasury shares
Reversal of fair value adjustments
through the income statement
(31)
29
(313)
297
(9)
(9)
Balance sheet as at 31 December 2016
(2)
(26)
(28)
Of which OCI related to the Baltics:
Balance sheet as at 31 December 2015
1 465
(987)
478
Other comprehensive income
(449)
275
(174)
Balance sheet as at 31 December 2016
1 015
(712)
304
Currency translation reserve and net investment hedge reserve related to the Baltics totaled NOK 304 million as at 31 December 2016, of which NOK 280
million represented accumulated tax on the hedging instruments.
3)
In consequence of the introduction of the Solvency II regulations on 1 January 2016, certain minor changes in the regulations on annual accounts for nonlife and life insurance companies were approved, effective as of 1 January 2016. Among other things, the changes imply that the security reserve is no
longer included in the Group’s technical insurance reserves. Cf. Note 1 Basis for preparation.
14 / DNB GROUP – FOURTH QUARTER REPORT 2016 (PRELIMINARY AND UNAUDITED)
Cash flow statement
DNB Group
Amounts in NOK million
Full year
2016
Full year
2015
(41 244)
46 858
42 821
(3 656)
166 440
1 258
(1 661)
20 955
4 488
8 303
(20 032)
(2 918)
15 599
(1 512)
(14 745)
(5 583)
215 372
(50 866)
51 476
(37 827)
(7 391)
18 246
1 618
(1 359)
(2 479)
4 719
8 871
(19 934)
(2 575)
19 233
(14 415)
(14 820)
4 411
(43 092)
(1 540)
(1 512)
861
66
(2 124)
2 979
2 833
76
6
5 894
8 995 908
(9 000 786)
(16 016)
738
(3)
(923)
7 520
(516)
(7 330)
(21 408)
(272)
191 567
23 239
191 567
214 807
3 142 451
(3 145 857)
(15 129)
3 805
(4 604)
(1 029)
8 023
(75)
(6 189)
(18 604)
14 670
(41 132)
64 371
(41 132)
23 239
211 908
19 317
2 899
3 922
Operating activities
Net payments on loans to customers
Interest received from customers
Net receipts/payments on deposits from customers
Interest paid to customers
Net receipts on loans to credit institutions
Interest received from credit institutions
Interest paid to credit institutions
Net receipts/payments on the sale of financial assets for investment or trading
Interest received on bonds and commercial paper
Net receipts on commissions and fees
Payments to operations
Taxes paid
Receipts on premiums
Net receipts/payments on premium reserve transfers
Payments of insurance settlements
Other receipts/payments
Net cash flow from operating activities
Investing activities
Net receipts/payments on the acquisition of fixed assets
Net receipts, investment properties
Receipts on the sale of long-term investments in shares
Dividends received on long-term investments in shares
Net cash flow from investment activities
Financing activities
Receipts on issued bonds and commercial paper
Payments on redeemed bonds and commercial paper
Interest payments on issued bonds and commercial paper
Receipts on the raising of subordinated loan capital
Redemptions of subordinated loan capital
Interest payments on subordinated loan capital
Receipts on issued additional Tier 1 capital
Interest payments on additional Tier 1 capital
Dividend payments
Net cash flow from funding activities
Effects of exchange rate changes on cash and cash equivalents
Net cash flow
Cash as at 1 January
Net receipts/payments of cash
Cash at end of period *)
*)
Of which: Cash and deposits with central banks
Deposits with credit institutions with no agreed period of notice 1)
1)
Recorded under "Due from credit institutions" in the balance sheet.
DNB GROUP – FOURTH QUARTER REPORT 2016 (PRELIMINARY AND UNAUDITED) / 15
Note 1
Basis for preparation
The quarterly financial statements for the Group have been prepared in accordance with IAS 34 Interim Financial Reporting as issued
by the International Accounting Standards Board and as adopted by the European Union. When preparing the consolidated financial
statements, management makes estimates, judgments and assumptions that affect the application of the accounting principles and the
carrying amount of assets, liabilities, income and expenses. Estimates and assumptions are subject to continual evaluation and are based
on historical experience and other factors, including expectations of future events that are believed to be probable on the balance sheet
date. A description of the accounting policies, significant estimates and areas where judgment is applied by the Group, appear in note 1
Accounting principles in the annual report for 2015.
Changes in the regulations on annual accounts for insurance companies
In consequence of the introduction of the Solvency II regulations on 1 January 2016, certain minor changes in the regulations on annual
accounts for non-life and life insurance companies were approved, effective as of 1 January 2016. Among other things, the changes imply
that the security reserve is no longer included in the Group’s technical insurance reserves. The change has affected the income statement,
balance sheet and equity. Comparative figures for 2015 have been restated accordingly. The tables below show comparable figures for
2015 with implementation effect on 1 January 2015.
Income statement
Amounts in NOK million
DNB Group
Change
1st quarter 2nd quarter 3rd quarter
2015
2015
2015
Fourth quarter 2015
4th quarter
2015
Full year 2015
Reported
Effect
Restated
Reported
Net financial result, DNB Livsforsikring
1
13
5
(19)
(910)
(19)
(928)
(1 251)
Net insurance result, DNB Forsikring
4
14
4
(9)
141
(9)
132
521
13
534
(1)
(7)
(2)
7
(1 084)
7
(1 077)
(7 045)
(3)
(7 048)
4
20
7
(21)
6 804
(21)
6 784
24 762
10
24 772
Taxes
Profit for the period
Balance sheet
Liabilities to life insurance policyholders
in DNB Livsforsikring
Restated
(1 251)
DNB Group
31 December 2015
Amounts in NOK million
Effect
1 January 2015
Reported
Effect
Restated
Reported
Effect
Restated
208 949
(223)
208 726
216 799
(222)
216 577
Insurance liabilities, DNB Forsikring
2 085
(239)
1 846
1 964
(226)
1 738
Deferred taxes
7 556
116
7 672
6 018
112
6 130
Equity
DNB Group
31 December 2015
Amounts in NOK million
Total equity
1 January 2015
Reported
Effect
Restated
Reported
Effect
Restated
190 078
347
190 425
158 723
337
159 060
16 / DNB GROUP – FOURTH QUARTER REPORT 2016 (PRELIMINARY AND UNAUDITED)
Note 2
Segments
Financial governance in DNB is geared to the different customer segments. The follow-up of total customer relationships and segment
profitability are two important dimensions when making strategic priorities and deciding where to allocate the Group’s resources. Special
product areas are responsible for production and development for parts of the product range and for ensuring that the Group meets the
needs of the various customer segments. Reported figures for the different segments will reflect the Group’s total sales of products and
services to the relevant customer segments.
Personal customers
-
includes the Group’s total products and activities to private customers in all channels, both digital and
physical, with the exception of home mortgages recorded under Traditional pension products, where returns
accrue to the policyholders. DNB offers a wide range of products through Norway’s largest distribution
network, comprising branches, telephone banking (24/7), digital banking, real estate broking as well as
external channels (post offices and in-store postal and banking outlets).
Small and medium-sized
enterprises
-
is responsible for product sales and advisory services to small and medium-sized enterprises in Norway.
Customers in this segment range from small businesses and start-up companies to relatively large
corporate customers, and the product offerings are adapted to the customers’ different needs. Small and
medium-sized enterprises are served through the Group’s physical distribution network throughout Norway
as well as digital and telephone banking (24/7).
Large corporates and
international customers
-
includes large Norwegian and international corporate customers and all customers served by DNB’s
subsidiary banks in the Baltics and Poland. Operations are based on sound industry expertise and longterm customer relationships.
Trading
-
includes market making and other trading activities in fixed income, currencies and commodities (FICC) as
well as equities, including risk management of the risk inherent in customer transactions. Markets’ trading
activities support the customer activities.
Traditional pension
products
-
includes traditional defined-benefit pension products in DNB Livsforsikring and assets related to these
products. DNB no longer offers such products to new customers.
The income statement and balance sheet for the segments have been prepared on the basis of internal financial reporting for the functional
organisation of the DNB Group into segments, as reported to group management (chief operating decision maker) for an assessment of
current developments and the allocation of resources. Figures for segments are based on the group’s accounting principles and DNB’s
management model. Allocation of costs and capital between segments involves a number of assumptions, estimates and discretionary
distributions.
Capital allocated to the segments is calculated on the basis of the Group’s common equity Tier 1 capital and long-term capitalisation
ambition. There are special capital adequacy regulations for insurance operations, and in these companies, allocated capital corresponds to
recorded equity. For other group operations, the allocation of capital to all units is based on the Group’s adaptation to Basel III with capital
requirement related to credit risk, market risk and operational risk. The allocation of capital for credit risk is based on the Group’s internal
measurement of risk-adjusted capital requirements for credit. Capital requirements for market risk are allocated directly in accordance with
risk-weighted volume, and operational risk is allocated based on the respective units’ total income.
Income statement, fourth quarter
DNB Group
Amounts in NOK million
Personal
customers
4th quarter
2016
2015
Small and
medium-sized
enterprises
4th quarter
2016
2015
Net interest income
3 228
3 496
1 638
1 610
3 668
3 929
1
3
(163)
24
8 372
Net other operating income
1 145
1 120
556
449
1 519
1 358
817
796
280
(522)
(87)
624
4 230
3 825
Total income
4 374
4 616
2 194
2 059
5 187
5 287
818
799
280
(522)
(250)
648
12 602
12 888
(2 024)
(2 157)
(898)
(807)
(1 976)
(2 202)
(159)
(97)
(96)
(74)
(41)
1 711
(5 194)
(3 626)
2 350
2 459
1 296
1 252
3 211
3 086
659
702
184
(596)
(291)
2 359
7 409
9 262
0
(0)
(0)
(4)
5
(8)
(13)
(12)
(9)
129
15
(289)
(360)
(1 586)
(1 079)
(6)
3
(1 753)
(1 420)
40
35
7
(6)
(47)
(30)
Pre-tax operating profit
2 479
2 474
1 047
927
1 628
2 006
659
702
184
(596)
(352)
2 319
5 644
7 833
Tax expense
(620)
(668)
(262)
(250)
(439)
(582)
(165)
(183)
49
705
1 147
(100)
(290)
(1 077)
26
29
26
28
785
677
1 188
1 424
494
520
233
109
821
2 248
5 380
6 783
Operating expenses
Pre-tax operating profit before impairment
Net gains on fixed and intangible assets
Impairment of loans and guarantees 3)
Profit from repossessed operations
Profit from operations held for sale,
after taxes
Profit for the period
1)
2)
3)
0
(1)
1 859
1 805
Large corporates
and international
customers
4th quarter
2016
2015
Trading
4th quarter
2016
2015
Traditional
pension
products 1)
4th quarter
2016
2015
(0)
Other
operations/
eliminations 2)
4th quarter
2016
2015
DNB
Group
4th quarter
2016
2015
9 062
See the tables below for more information about Traditional pension products.
See the tables below for more information about Other operations/eliminations.
See note 10 Impairment of loans and guarantees for an analysis of the gross change in impairment for the Group.
DNB GROUP – FOURTH QUARTER REPORT 2016 (PRELIMINARY AND UNAUDITED) / 17
Note 2
Segments (continued)
Main average balance sheet items
DNB Group
Amounts in NOK billion
Personal
customers
4th quarter
2016
2015
Small and
medium-sized
enterprises
4th quarter
2016
2015
Large corporates
and international
customers
4th quarter
2016
2015
Trading
4th quarter
2016
2015
Traditional
pension
products
4th quarter
2016
2015
Loans to customers 1) 2)
718.2
695.7
231.9
220.3
531.1
Deposits from customers 1) 2)
399.4
391.1
185.7
172.8
367.0
579.3
24.4
28.3
32.5
403.5
54.5
203.7
Assets under management
78.0
75.2
77.0
64.1
180.9
222.7
Allocated capital 3)
40.2
33.8
24.7
21.0
86.3
70.9
7.2
7.3
13.0
202.8
200.3
19.9
18.2
Other
operations/
eliminations
4th quarter
2016
2015
(33.1)
2.6
1 505.1
1 539.3
(44.9)
(6.0)
961.7
1 165.2
22.1
15.2
560.8
577.4
Key figures
DNB Group
Per cent
Personal
customers
4th quarter
2016
2015
Small and
medium-sized
enterprises
4th quarter
2016
2015
Cost/income ratio 4)
46.3
46.7
40.9
39.2
38.1
41.6
Ratio of deposits to loans 2) 5)
55.6
56.2
80.1
78.5
69.1
69.6
Return on allocated capital, annualised 3)
18.4
21.2
12.6
12.8
5.5
8.0
1)
2)
3)
4)
5)
DNB
Group
4th quarter
2016
2015
Large corporates
and international
customers
4th quarter
2016
2015
Trading
4th quarter
2016
2015
Traditional
pension
products
4th quarter
2016
2015
19.5
34.3
27.2
12.1
28.4
4.7
Other
operations/
eliminations
4th quarter
2016
2015
(14.3)
2.4
DNB
Group
4th quarter
2016
2015
41.2
28.1
63.9
75.7
10.9
15.0
Loans to and deposits from customers in the Baltics are included under Large corporates and international customers in spite of being reclassified as
assets and liabilities held for sale in August 2016. The reclassification is reflected under Other operations/eliminations. Reclassified loans amounted to
NOK 46,5 billion and deposits to NOK 36.7 billion.
Loans to customers include accrued interest, impairment and value adjustments. Correspondingly, deposits from customers include accrued interest and
value adjustments. In November 2015, a portfolio of home mortgages amounting to approximately NOK 20 billion was sold from DNB Boligkreditt to DNB
Livsforsikring, and in November 2016, mortgages representing an additional NOK 5 billion were sold. In the fourth quarter of 2016, commercial mortgages
amounting to NOK 2.6 billion and 4.5 billion, respectively, were sold from DNB Næringskreditt and DNB Bank to DNB Livsforsikring.
Allocated capital for the segments is calculated based on the external capital adequacy requirement (Basel III) which must be met by the Group. The
capital allocated in 2016 corresponds to a common equity Tier 1 capital ratio of 17.2 per cent compared to 14.5 per cent in 2015. Recorded capital is used
for the Group.
Total operating expenses relative to total income.
Deposits from customers relative to loans to customers. Calculated on the basis of average balance sheet items.
Income statement, full year
Amounts in NOK million
Net interest income
DNB Group
Personal
customers
Full year
2016
2015
Small and
medium-sized
enterprises
Full year
2016
2015
Large corporates
and international
customers
Full year
2016
2015
Trading
Full year
2016
2015
Traditional
pension
products 1)
Full year
2016
2015
Other
operations/
eliminations
Full year
2016
2015
DNB
Group
Full year
2016
2015
13 269
13 697
6 359
6 131
14 301
15 198
28
89
153
243
34 110
35 358
4 920
4 895
1 969
1 729
6 143
6 083
2 976
1 503
1 214
622
831
3 817
18 053
18 648
Total income
18 189
18 593
8 327
7 860
20 444
21 280
3 004
1 592
1 214
622
984
4 059
52 163
54 006
Operating expenses
(8 698)
(8 877)
(3 356)
(3 078)
(7 856)
(8 053)
(548)
(505)
(435)
(477)
(438)
1 080
(21 333)
(19 910)
9 491
9 716
4 971
4 782
12 588
13 227
2 455
1 087
779
145
546
5 140
30 830
34 096
(0)
0
2
(2)
24
53
(44)
(7)
(19)
45
392
939
(1 082)
(1 068)
(6 734)
(2 108)
(0)
(33)
(7 424)
(2 270)
6
3
8
(67)
(14)
64
9 883
10 655
3 896
3 715
5 886
11 105
2 455
1 087
779
145
488
5 164
23 387
31 871
(2 471)
(2 877)
(974)
(1 003)
(1 589)
(3 221)
(614)
(283)
4
766
1 504
(432)
(4 140)
(7 048)
2
(53)
4
(51)
2 922
2 712
4 300
7 885
1 841
804
783
912
1 994
4 680
19 251
24 772
Net other operating income
Pre-tax operating profit before impairment
Net gains on fixed and intangible assets
Impairment of loans and guarantees 2)
Profit from repossessed operations
Pre-tax operating profit
Tax expense
Profit from operations held for sale,
after taxes
Profit for the period
1)
2)
(1)
2
7 411
7 780
3
See the tables below for more information about Traditional pension products.
See note 10 Impairment of loans and guarantees for an analysis of the gross change in impairment for the Group.
18 / DNB GROUP – FOURTH QUARTER REPORT 2016 (PRELIMINARY AND UNAUDITED)
Note 2
Segments (continued)
Traditional pension products
The risk profile of traditional pension products is different by nature from the risk profile of the Group’s bank-related products. Higher life
expectancy is one of several risk factors linked to defined-benefit pension products. In the tables below, a specification is given of pre-tax
operating profits, including the costs related to the increase in reserves to reflect higher life expectancy.
Specification of pre-tax operating profit, Traditional pension products
Amounts in NOK million
Recorded interest result
Risk result
Administration result
Upfront pricing of risk and guaranteed rate of return
Provisions for higher life expentancy, group pension 1)
Allocations to policyholders, products with guaranteed
rates of return
Return on corporate portfolio
Pre-tax operating profit - Traditional pension products
1)
4th quarter
2016
4th quarter
2015
Full year
2016
Full year
2015
(117)
179
76
56
(433)
1 854
166
99
137
(2 505)
1 185
448
327
288
(1 452)
2 163
599
291
535
(3 141)
307
116
184
(455)
107
(596)
(455)
439
779
(802)
500
145
Accumulated
balance
31 December 2016
Provisions for higher life expectancy, group pension:
Amounts in NOK million
Paid-up policies
8 792
Defined benefit
2 046
Total group pension *)
10 838
*) The total required increase in reserves for the portfolio as at 31 December 2016 was approximately NOK 11.4 billion.
Other operations/eliminations
Other operations/eliminations include IT and Operations, HR (Human Resources), Group Finance including Group Treasury, Risk
Management, Corporate Communications, the partially owned company Eksportfinans, investments in IT infrastructure and shareholderrelated costs. In addition, Other operations/eliminations include that part of the Group’s equity that is not allocated to the segments. Profits
from repossessed operations which are fully consolidated in the DNB Group are presented net under ”Profit from repossessed operations”
in the internal reporting of segments. The acquired companies and all intra-group eliminations are included in Other operations/eliminations.
Pre-tax operating profit
DNB Group
Amounts in NOK million
4th quarter
2016
4th quarter
2015
(294)
77
681
(713)
(45)
15
(47)
(115)
50
63
(2)
24
(40)
288
195
(4)
(5)
167
(30)
(101)
1 633
114
9
46
(5)
51
2 319
Unallocated interest income
Income from equity investments
Mark-to-market adjustments on financial instruments
Basis swaps
Profit from associated companies
Net gains on investment properties
Profit from repossessed operations
Ownership-related expenses (costs relating to shareholders, investor relations, strategic planning etc.)
Unallocated personnel expenses 1)
Unallocated IT and Operations expenses
IT restructuring
Reversal of provisions
Impairment of fixed assets and value adjustements on investment properties
Other
Pre-tax operating profit
1)
(47)
(352)
Of wich an unallocated non-recurring effect on pension expenses of NOK 1 778 million in 2015. See note 8 Operating expenses.
DNB GROUP – FOURTH QUARTER REPORT 2016 (PRELIMINARY AND UNAUDITED) / 19
Note 3
Capital adequacy
Capital adequacy is calculated and reported in accordance with the EU capital requirements regulations for banks and investment firms
(CRD IV/CRR). On 18 December 2015, the Ministry of Finance approved new regulations on consolidation etc. in cross-sectoral groups.
The changes became effective on 31 January 2016 and are adapted to the EU regulations, reflecting the entry into force of Solvency II on
1 January 2016. The regulatory consolidation deviates from consolidation in the accounts and comprises the parent company, subsidiaries
and associated companies within the financial sector, excluding insurance companies. Associated companies are consolidated pro rata.
Primary capital
Amounts in NOK million
Total equity excluding profit for the period
Effect from regulatory consolidation
Non-eligible capital, DNB Livsforsikring
Additional Tier 1 capital instruments included in total equity
Net accrued interest on additional Tier 1
capital instruments
Common equity Tier 1 capital instruments
Deductions
Pension funds above pension commitments
Goodwill
Deferred tax assets that are not due to
temporary differences
Other intangible assets
Dividends payable etc.
Significant investments in financial sector entities
Expected losses exceeding actual losses, IRB portfolios
Value adjustments due to the requirements for prudent
valuation (AVA)
Adjustments for unrealised losses/(gains) on debt
recorded at fair value
Adjustments for unrealised losses/(gains) arising from
the institution's own credit risk related to derivative
liabilities (DVA)
Minimum requirement reassurance allocation
Common equity Tier 1 capital
Additional Tier 1 capital instruments
Non-eligible Tier 1 capital, DNB Group 2)
Tier 1 capital
Perpetual subordinated loan capital
Term subordinated loan capital
Deduction of holdings of Tier 2 instruments in
DNB Livsforsikring and DNB Forsikring
Non-eligible Tier 2 capital, DNB Group 2)
Tier 2 capital
Total eligible capital
Risk-weighted volume, transitional rules
Minimum capital requirement, transitional rules
Common equity Tier 1 capital ratio, transitional rules (%)
Tier 1 capital ratio, transitional rules (%)
Capital ratio, transitional rules (%)
1)
2)
DNB Bank ASA
DNB Bank Group
DNB Group
31 Dec.
2016
31 Dec.
2015
31 Dec.
2016
31 Dec.
2015
31 Dec.
1)
2016
31 Dec.
2015
168 104
151 533
190 078
(181)
173 412
(541)
206 423
(5 795)
(15 574)
(8 053)
(15 574)
(8 053)
(15 574)
190 078
(541)
(403)
(8 053)
(284)
152 246
(219)
143 261
(284)
174 039
(219)
164 599
(284)
184 770
(219)
180 863
(2 900)
(38)
(3 012)
(2 951)
(38)
(3 029)
(4 656)
(38)
(4 763)
(224)
(699)
(195)
(663)
(482)
(946)
(5 084)
(640)
(1 075)
(5 000)
(482)
(946)
(9 284)
(640)
(1 241)
(7 330)
(6)
(1 383)
(153)
(2 309)
(153)
(2 309)
(479)
(671)
(786)
(1 055)
(786)
(1 055)
107
(15)
(90)
(412)
(90)
(412)
(580)
(785)
(159)
(150)
(159)
147 467
17 471
136 499
10 267
163 389
17 471
150 889
10 267
164 938
5 602
21 249
146 766
5 702
22 185
180 860
5 602
21 249
161 156
5 702
22 185
168 214
17 471
(176)
185 509
5 602
21 249
(150)
(17)
162 906
10 267
27 887
189 043
1 056 731
84 539
14.3
15.3
17.9
(5 750)
(1 440)
19 661
205 170
1 051 498
84 120
16.0
17.6
19.5
26 851
191 789
773 244
61 860
19.1
21.3
24.8
27 887
174 653
906 084
72 487
15.1
16.2
19.3
26 851
207 711
1 040 888
83 271
15.7
17.4
20.0
173 173
5 702
22 185
27 887
201 060
1 129 373
90 350
14.4
15.3
17.8
As from the first quarter of 2016, DNB Livsforsikring and DNB Forsikring are not included in the regulatory consolidation for the DNB Group. With effect
from the first quarter of 2016, deductions are also made for significant investments in financial sector entities if they each exceed 10 per cent of common
equity Tier 1 capital. The amounts that are not deducted are given a risk weight of 250 per cent. In addition, the holdings of Tier 2 instruments in DNB
Livsforsikring and DNB Forsikring are deducted from the Group’s Tier 2 capital.
Tier 1 and Tier 2 capital in DNB Bank ASA not included in consolidated own funds, in accordance with Articles 85–88 of the CRR.
20 / DNB GROUP – FOURTH QUARTER REPORT 2016 (PRELIMINARY AND UNAUDITED)
Note 3
Capital adequacy (continued)
Basel III
The majority of the credit portfolios are reported according to the IRB approach. However, one portfolio, banks and financial institutions
(DNB Bank), is still subject to final IRB approval from Finanstilsynet. The portfolio Large corporate clients rated by simulation models
(DNB Bank) was approved in December 2015.
Specification of risk-weighted volume and capital requirements
Amounts in NOK million
IRB approach
Corporate
Specialised lending (SL)
Retail - mortgages
Retail - other exposures
Securitisation
Total credit risk, IRB approach
Standardised approach
Central government
Institutions
Corporate
Retail - mortgages
Retail - other exposures
Equity positions
Securitisation
Other assets
Total credit risk, standardised approach
Total credit risk
Market risk
Position risk, debt instruments
Position risk, equity instruments
Currency risk
Commodity risk
Credit value adjustment risk (CVA)
Total market risk
Operational risk
Net insurance, after eliminations
Total risk-weighted volume and capital requirements
before transitional rules
Additional capital requirements according to
transitional rules 2)
Total risk-weighted volume and capital requirements
1)
2)
DNB Group
Nominal
exposure
31 Dec.
2016
EAD
31 Dec.
2016
Average
risk weights
in per cent
31 Dec.
2016
1 039 384
8 825
706 195
112 484
12 760
1 879 648
842 921
8 517
706 195
92 484
12 760
1 662 878
48.4
52.3
22.1
25.7
91.8
36.3
407 740
4 456
155 814
23 759
11 718
603 487
32 619
356
12 465
1 901
937
48 279
33 421
468
12 241
1 965
1 201
49 295
55 426
147 549
160 608
51 665
122 926
19 225
1 760
15 210
574 370
2 454 018
69 760
99 864
127 538
49 631
48 737
19 224
1 160
15 210
431 124
2 094 002
0.1
24.9
85.9
45.5
75.4
233.1
44.6
69.7
57.9
40.7
84
24 858
109 582
22 559
36 742
44 804
518
10 594
249 741
853 228
7
1 989
8 767
1 805
2 939
3 584
41
848
19 979
68 258
33
2 230
9 657
1 764
2 642
276
60
535
17 195
66 490
14 615
310
1 169
25
1 141
36
72
6 131
21 128
83 370
6
490
1 690
6 670
3
513
1 693
6 670
6 464
957 726
76 618
81 317
93 772
1 051 498
7 502
84 120
9 033
90 350
1)
Riskweighted
volume
31 Dec.
2016
Capital
requirement
31 Dec.
2016
Capital
requirement
31 Dec.
2015
EAD, exposure at default.
Due to transitional rules, the minimum capital adequacy requirements cannot be reduced below 80 per cent of the corresponding figure calculated
according to the Basel I regulations.
DNB GROUP – FOURTH QUARTER REPORT 2016 (PRELIMINARY AND UNAUDITED) / 21
Note 4
Liquidity risk
Liquidity risk is the risk that the DNB Group will be unable to meet its payment obligations. Overall liquidity management in the Group
implies that DNB Bank ASA is responsible for funding domestic and international group entities. Liquidity risk is managed and measured by
means of various measurement techniques.
The Board of Directors has approved internal limits which restrict the short-term maturity of liabilities within different time frames. The
various maturities are subject to stress testing based on a bank-specific crisis, a systemic crisis and a combination thereof, and a
contingency plan has been established to handle market events. In addition, limits have been set for structural liquidity risk, which implies
that lending to customers should largely be financed through customer deposits, subordinated capital and long-term funding. Ordinary
senior bond debt and covered bonds are the major sources of long-term funding. For the purpose of liquidity management, the measure
ratio of deposits to net loans is more relevant at the banking group level than at DNB Group level, due to the fact that some loans at the
DNB Group level are investments on behalf of insurance clients. The banking group's ratio of deposits to net loans was 63.4 per cent at
end-December 2016, up from 62.5 per cent a year earlier. The ratio of deposits to net loans in DNB Bank ASA was 133.4 per cent at endDecember 2016.
The short-term funding markets were generally sound for banks with high credit ratings in the fourth quarter of 2016. New regulations for US
money market funds came into force on 14 October, which led to a significant reduction in demand from this investor group. The reduced
demand was to some extent replaced by demand from other types of investors. DNB had ample access to short-term funding throughout
the quarter.
The level of activity in the long-term funding markets varied during the fourth quarter. The activity level declined prior to the US presidential
election, but increased markedly afterwards. In December, uncertainty related to a potential reduction in the ECB’s asset purchase
programme (so called “tapering”) resulted in wider spreads, in particular on covered bonds. The activity level was once again down towards
the end of December, which is normal for that time of the year. The short-term liquidity requirement, Liquidity Coverage Ratio (LCR),
remained stable at above 100 per cent throughout the quarter. At end-December, the total LCR was 138 per cent, with an LCR of 562 per
cent for EUR, 190 per cent for USD and 59 per cent for NOK.
The average remaining term to maturity for the portfolio of senior bond debt and covered bonds was 3.9 years at end-December 2016, up
from 3.8 a year earlier. The DNB Group aims to maintain a sound and stable maturity structure for funding over the next five years.
Note 5
Net interest income
DNB Group
4th quarter
2016
4th quarter
2015
Full year
2016
Full year
2015
Interest on amounts due from credit institutions
Interest on loans to customers
Interest on impaired loans and guarantees
Interest on commercial paper and bonds
Front-end fees etc.
Other interest income
Total interest income
432
10 984
317
1 185
81
274
13 273
430
11 660
203
1 118
96
427
13 934
1 340
44 229
911
4 626
294
1 024
52 424
1 608
48 728
619
4 655
337
1 584
57 532
Interest on amounts due to credit institutions
Interest on deposits from customers
Interest on debt securities issued
Interest on subordinated loan capital
Guarantee fund levy 1)
Other interest expenses 2)
Total interest expenses
Net interest income
(762)
(1 665)
(2 933)
(131)
(200)
791
(4 901)
8 372
(369)
(1 821)
(3 238)
(140)
(202)
898
(4 872)
9 062
(1 705)
(6 645)
(12 385)
(532)
(768)
3 720
(18 314)
34 110
(1 365)
(9 394)
(12 809)
(569)
(845)
2 809
(22 174)
35 358
Amounts in NOK million
1)
2)
The amount recorded in the quarter represents a proportional share of the estimated annual levy.
Other interest expenses include interest rate adjustments resulting from interest swaps.
22 / DNB GROUP – FOURTH QUARTER REPORT 2016 (PRELIMINARY AND UNAUDITED)
Note 6
Net commission and fee income
DNB Group
4th quarter
2016
4th quarter
2015
Full year
2016
Full year
2015
Money transfers
Asset management services
Custodial services
Securities broking
Corporate finance
Interbank fees
Credit broking
Sale of insurance products
Real estate broking
Other commissions and fees
Total commission and fee income
867
174
78
200
338
5
108
576
260
207
2 814
911
393
80
142
123
7
135
647
270
209
2 916
3 725
1 267
315
616
767
23
491
2 418
1 121
708
11 452
3 595
1 399
336
482
609
29
781
2 661
1 201
870
11 963
Money transfers
Asset management services
Custodial services
Securities broking
Corporate finance
Interbank fees
Credit broking
Sale of insurance products
Other commissions and fees
Total commission and fee expenses
Net commission and fee income
(455)
106
(40)
(40)
(19)
(14)
(2)
(46)
(167)
(678)
2 136
(459)
(81)
(43)
(31)
(15)
(15)
(9)
(52)
(128)
(834)
2 082
(1 795)
(104)
(172)
(177)
(73)
(57)
(26)
(202)
(567)
(3 172)
8 280
(1 670)
(282)
(174)
(119)
(55)
(61)
(27)
(179)
(534)
(3 101)
8 862
4th quarter
2016
4th quarter
2015
Full year
2016
Full year
2015
33
(1 962)
74
(713)
4 256
1 689
20
(1 252)
384
(4)
3 015
2 164
140
(1 810)
356
(542)
8 368
6 513
158
(2 593)
(35)
2 685
8 467
8 683
Amounts in NOK million
Note 7
Net gains on financial instruments at fair value
DNB Group
Amounts in NOK million
Dividends
Net gains on commercial paper and bonds
Net gains on shareholdings and equity-related derivatives
Net unrealised gains on basis swaps
Net gains on other financial instruments
Net gains on financial instruments at fair value
DNB GROUP – FOURTH QUARTER REPORT 2016 (PRELIMINARY AND UNAUDITED) / 23
Note 8
Operating expenses
DNB Group
4th quarter
2016
4th quarter
2015
Full year
2016
Full year
2015
Salaries
Employer's national insurance contributions
Pension expenses 1)
Restructuring expenses
Other personnel expenses
Total salaries and other personnel expenses
(2 004)
(379)
(81)
(203)
(174)
(2 842)
(2 070)
(312)
1 639
(142)
(220)
(1 106)
(8 190)
(1 301)
(1 035)
(720)
(658)
(11 904)
(8 269)
(1 220)
799
(390)
(742)
(9 822)
Fees 2)
IT expenses 2)
Postage and telecommunications
Office supplies
Marketing and public relations
Travel expenses
Reimbursement to Norway Post for transactions executed
Training expenses
Operating expenses on properties and premises
Operating expenses on machinery, vehicles and office equipment
Other operating expenses
Total other expenses
(515)
(417)
(59)
(21)
(215)
(85)
(48)
(23)
(291)
(23)
(132)
(1 828)
(361)
(489)
(65)
(24)
(203)
(99)
(43)
(24)
(301)
(25)
(296)
(1 931)
(1 631)
(2 107)
(238)
(76)
(815)
(237)
(198)
(62)
(1 191)
(93)
(604)
(7 251)
(1 545)
(2 418)
(287)
(89)
(859)
(285)
(174)
(75)
(1 114)
(101)
(844)
(7 790)
Depreciation and impairment of fixed and intangible assets
Total depreciation and impairment of fixed and intangible assets
Total operating expenses
(524)
(524)
(5 194)
(590)
(590)
(3 626)
(2 177)
(2 177)
(21 333)
(2 298)
(2 298)
(19 910)
Amounts in NOK million
1)
2)
In the fourth quarter of 2015 DNB decided to change the Group’s pension scheme from a defined-benefit to a defined contribution scheme with effect from
31 December 2015. The change included the majority of its employees in Norway who were members of the Group’s closed defined-benefit scheme. The
change resulted in a one-time effect of NOK 1 969 million which reduced pension expenses in 2015.
Fees also include system development fees and must be viewed relative to IT expenses.
Note 9
Taxes
Balancing tax charges against pre-tax operating profit
DNB Group
Full year
2016
Full year
2015
Pre-tax operating profit
23 387
31 858
Estimated tax expense - nominal tax rate - 25 per cent (27 per cent in 2015)
Tax effect of different tax rates in other countries
Tax effect of debt interest distribution with international branches
Tax effect of tax-exempt income and non-deductible expenses
Tax effect of tax losses carried forward not recognised in the balance sheet 1)
Tax effect of changed tax rate from 27 to 25 per cent for deferred taxes recognised in the balance sheet
Excess tax provision previous year
Total tax expense
Effective tax rate
(5 847)
7
357
1 027
123
18
175
(4 140)
18%
(8 602)
(166)
162
1 061
32
549
(81)
(7 045)
22%
Amounts in NOK million
1)
Deferred taxes for tax-deductible differences (mainly losses carried forward) in subsidiaries are recognised in the balance sheet to the extent that it is
probable that the Group can utilise the tax positions in the future.
24 / DNB GROUP – FOURTH QUARTER REPORT 2016 (PRELIMINARY AND UNAUDITED)
Note 10
Impairment of loans and guarantees
DNB Group
4th quarter
2016
4th quarter
2015
Full year
2016
Full year
2015
Write-offs
New/increased individual impairment
Total new/increased individual impairment
Reassessed individual impairment previous years
Recoveries on loans and guarantees previously written off
Net individual impairment
Change in collective impairment of loans
(455)
(1 519)
(1 974)
177
217
(1 580)
(172)
(748)
(672)
(1 420)
217
200
(1 002)
(418)
(1 359)
(5 910)
(7 269)
990
999
(5 280)
(2 144)
(1 446)
(3 288)
(4 735)
978
1 742
(2 015)
(255)
Impairment of loans and guarantees 1)
(1 753)
(1 420)
(7 424)
(2 270)
849
666
2 803
3 749
(105)
0
(344)
(36)
Amounts in NOK million
Write-offs covered by individual impairment made in previous years
1) Of which individual impairment of guarantees
Note 11
Loans to customers
DNB Group
Amounts in NOK million
31 Dec.
2016
31 Dec.
2015
1 384 022
(8 566)
1 375 456
1 877
(494)
(4 488)
1 372 351
1 405 735
(8 484)
1 397 251
2 349
(656)
(2 527)
1 396 417
135 370
193
1 164
136 727
1 509 078
144 215
229
1 883
146 327
1 542 744
29 466
32 384
Loans at amortised cost
Loans to customers, nominal amount
- Individual impairment
Loans to customers, after individual impairment
+ Accrued interest and amortisation
- Individual impairment of accrued interest and amortisation
- Collective impairment
Loans to customers, at amortised cost
Loans at fair value
Loans to customers, nominal amount
+ Accrued interest
+ Adjustment to fair value
Loans to customers, at fair value
Loans to customers *) 1)
*) Of which repo trading volumes
1)
Loans to customers in the Baltics were reclassified as assets held for sale in August 2016 and amounted to NOK 45 007 million at end-December 2016.
DNB GROUP – FOURTH QUARTER REPORT 2016 (PRELIMINARY AND UNAUDITED) / 25
Note 12
Net impaired loans and guarantees for principal customer groups 1) 2)
DNB Group
Amounts in NOK million
Private individuals
Transportation by sea and pipelines and vessel construction
Real estate
Manufacturing
Services
Trade
Oil and gas
Transportation and communication
Building and construction
Power and water supply
Seafood
Hotels and restaurants
Agriculture and forestry
Central and local government
Other sectors
Total customers
Credit institutions
Total net impaired loans and guarantees
Non-performing loans and guarantees not subject to impairment
Total net non-performing and doubtful loans and guarantees 2)
1)
2)
31 Dec.
2016
31 Dec.
2015
2 290
2 748
1 826
3 986
797
790
3 625
3 905
749
386
44
61
107
0
19
21 331
2 661
2 045
2 289
1 530
359
476
1 099
470
317
5
118
110
7
34
11 519
21 331
4 322
25 654
11 519
2 463
13 982
Includes loans and guarantees subject to individual impairment and total non-performing loans and guarantees not subject to impairment. The breakdown
into principal customer groups corresponds to the EU's standard industrial classification, NACE Rev.2.
Includes volumes in the Baltics, reclassified as assets held for sale in August 2016, of which net non-performing and net doubtful loans and guarantees
totalled NOK 2 256 million at end-December.
Note 13
Fair value of financial instruments at amortised cost
DNB Group
31 December 2016
Carrying
Fair
amount
value
Amounts in NOK million
Cash and deposits with central banks
Due from credit institutions
Loans to customers
Commercial paper and bonds, held to maturity
Total financial assets
Due to credit institutions
Deposits from customers
Securities issued 1)
Subordinated loan capital 1)
Total financial liabilities
1)
4 977
15 569
1 372 351
94 008
1 486 904
33 639
880 088
526 863
28 093
1 468 684
Includes hedged liabilities.
26 / DNB GROUP – FOURTH QUARTER REPORT 2016 (PRELIMINARY AND UNAUDITED)
4 977
15 569
1 376 269
102 411
1 499 226
33 639
880 088
533 874
28 065
1 475 666
31 December 2015
Carrying
Fair
amount
value
5 663
18 361
1 396 417
105 224
1 525 664
30 005
900 192
558 388
29 712
1 518 298
5 663
18 361
1 388 898
114 877
1 527 799
30 005
900 192
562 620
29 711
1 522 530
Note 14
Financial instruments at fair value
DNB Group
Amounts in NOK million
Valuation
based on
quoted prices
in an active
market
Level 1
Valuation
based on
observable
market data
Level 2
Valuation
based on
other than
observable
market data
Level 3
Total
Assets as at 31 December 2016
Deposits with central banks
Due from credit institutions
Loans to customers
Commercial paper and bonds at fair value
Shareholdings
Financial assets, customers bearing the risk
Financial derivatives
0
203 286
160 873
42 974
240 963
11 633
60 220
156 621
0
516
179 243
54 809
239 006
1 254
129 098
0
55 303
5 756
93 753
375
5 122
1 319
203 286
160 873
136 727
296 642
22 512
60 220
157 940
Liabilities as at 31 December 2016
Due to credit institutions
Deposits from customers
Debt securities issued
Subordinated loan capital
Financial derivatives
Other financial liabilities 1)
1 062
179 243
54 809
239 006
1 254
130 161
516
DNB Group
Amounts in NOK million
Valuation
based on
quoted prices
in an active
market
Level 1
Valuation
based on
observable
market data
Level 2
Valuation
based on
other than
observable
market data
Level 3
Total
Assets as at 31 December 2015
Deposits with central banks
Due from credit institutions
Loans to customers
Commercial paper and bonds at fair value
Shareholdings
Financial assets, customers bearing the risk
Financial derivatives
2
13 654
282 855
37 640
246 273
5 080
49 679
201 522
0
5 285
131 532
44 236
246 540
1 241
153 519
75
42 689
7 964
108 687
734
6 297
1 504
13 654
282 855
146 327
289 695
19 341
49 679
203 029
Liabilities as at 31 December 2015
Due to credit institutions
Deposits from customers
Debt securities issued
Subordinated loan capital
Financial derivatives
Other financial liabilities 1)
1)
1 144
131 532
44 236
246 540
1 241
154 663
5 359
Short positions, trading activities.
Financial assets and liabilities in the Baltics were reclassified to assets and liabilities held for sale in August 2016 and are not included in
the table above.
For a further description of the instruments and valuation techniques, see the annual report for 2015.
DNB GROUP – FOURTH QUARTER REPORT 2016 (PRELIMINARY AND UNAUDITED) / 27
Note 14
Financial instruments at fair value (continued)
Financial instruments at fair value, level 3
DNB Group
Loans to
customers
Amounts in NOK million
Carrying amount as at 31 December 2015
Net gains recognised in the income statement
Additions/purchases
Sales
Settled
Transferred from level 1 or level 2
Transferred to level 1 or level 2
Other 1)
Carrying amount as at 31 December 2016
1)
108 687
(525)
13 669
(27 975)
(103)
93 753
Financial assets
Commercial
paper and
Sharebonds
holdings
734
(97)
308
(657)
0
698
(576)
(35)
375
6 297
5
396
(1 539)
(36)
5 122
Financial
liabilities
Financial
derivatives
Financial
derivatives
1 504
(201)
802
1 144
(122)
797
(772)
(751)
(14)
1 319
(6)
1 062
Includes assets and liabilities in the Baltics reclassified as assets and liabilities held for sale in August 2016.
Breakdown of fair value, level 3
DNB Group
31 December 2016
Commercial
Loans to
paper and
customers
bonds
Amounts in NOK million
Principal amount/purchase price
Fair value adjustment 1)
Accrued interest
Carrying amount
1)
92 417
1 163
173
93 753
Shareholdings
412
(37)
4 377
746
375
5 122
Changes in the fair value of customer loans mainly result from changes in swap rates. A corresponding negative adjustment is made in the fair value of
financial instruments used for financial hedging.
Breakdown of shareholdings, level 3
Amounts in NOK million
Carrying amount as at 31 Dec. 2016
DNB Group
Property
funds
Hedgefunds
Unquoted
equities
Private
Equity (PE)
funds
440
845
1 037
2 776
Sensitivity analysis, level 3
Amounts in NOK million
Loans to customers
Commercial paper and bonds
Shareholdings
Financial derivatives, net
Other
Total
24
5 122
DNB Group
Carrying amount
31 Dec. 2016
93 753
375
5 122
257
Effect of reasonably
possible alternative
assumptions
(208)
(1)
In order to show the sensitivity of the loan portfolio, the discount rate on fixed-rate loans and the margin requirement on margin-based loans
have been increased by 10 basis points.
Level 3 bonds mainly represent investments in Norwegian industries and power companies. A 10 basis point increase in the discount rate
has had insignificant effects.
Level 3 equities represent a total of NOK 4 107 million in private equity investments, property funds, hedge funds and unquoted equities
in DNB Livsforsikring. The fair values of the funds are largely based on reported values from the fund managers. For private equity and
property funds, the fund managers use cash flow-based models or multiples when determining fair values. The Group does not have full
access to information about all elements in these valuations and thus has no basis for determining alternative values for alternative
assumptions. The use of alternative values will have a limited effect on the Group’s profits, as the investments are included in DNB
Livsforsikring’s common portfolio.
28 / DNB GROUP – FOURTH QUARTER REPORT 2016 (PRELIMINARY AND UNAUDITED)
Note 15
Commercial paper and bonds, held to maturity
DNB Group
Amounts in NOK million
31 Dec.
2016
31 Dec.
2015
International bond portfolio
DNB Livsforsikring AS
Other units 1)
Commercial paper and bonds, held to maturity
12 760
82 664
(1 416)
94 008
19 162
87 599
(1 537)
105 224
1)
Including eliminations of DNB Livsforsikring's investments in bonds issued by DNB Boligkreditt.
As part of ongoing liquidity management, DNB Bank has invested in a portfolio of securities. The portfolio can be used to regulate the
liquidity requirement and as a basis for furnishing collateral for operations in various countries. Among other things, the securities serve as
collateral for short and long-term borrowing in a number of central banks and as a basis for liquidity buffers to meet regulatory requirements.
With effect from 1 July 2008, the international bond portfolio was reclassified from the category "fair value through profit or loss" to "held-tomaturity investments". In the period following the reclassification some additional investments were classified as held-to-maturity. Portfolios
in this category are recorded at amortised cost and written down if there is objective evidence of a decrease in value.
Effects of the reclassifications of the international bond portfolio
By measuring the portfolio at amortised cost, the value of the portfolio as at 31 December 2016 was NOK 0.3 billion higher than if the
previous valuation principle had been retained. On the reclassification date, the carrying amount of the portfolio was NOK 88.0 billion,
compared with NOK 10.4 billion at end-December 2016. The average term to maturity of the portfolio was 5.2 years, and the change in
value resulting from a credit spread adjustment of one basis point was NOK 5.8 million at end-December 2016.
Effects on profits of the reclassification
DNB Group
Amounts in NOK million
Recorded amortisation effect
Net gain, if valued at fair value
Effects of reclassification on profits
4th quarter
2016
4th quarter
2015
Full year
2016
Full year
2015
19
65
(46)
9
5
4
84
448
(364)
95
(170)
265
Effects on the balance sheet of the reclassification
Amounts in NOK million
Recorded unrealised losses
Unrealised losses, if valued at fair value
Effects of reclassification on the balance sheet
DNB Group
31 Dec.
2016
31 Dec.
2015
318
665
347
402
1 113
711
Development in the portfolio after the reclassification
DNB Group
Amounts in NOK million
31 Dec.
2016
31 Dec.
2015
Reclassified portfolio, carrying amount
Reclassified portfolio, if valued at fair value
Effects of reclassification on the balance sheet
10 414
10 067
347
14 686
13 975
711
DNB GROUP – FOURTH QUARTER REPORT 2016 (PRELIMINARY AND UNAUDITED) / 29
Note 16
Investment properties
DNB Group
Amounts in NOK million
31 Dec.
2016
31 Dec.
2015
DNB Livsforsikring
Properties for own use
Other investment properties 1)
Total investment properties
15 565
(827)
1 175
15 912
15 195
(794)
2 333
16 734
1)
Other investment properties are mainly related to acquired companies.
Fair value
Investment properties in DNB Livsforsikring are part of the common portfolio and are owned with the intention to achieve long-term returns
for policyholders. The property portfolio is recorded at fair value on the balance sheet date. Fair value is defined as the price that would be
received to sell an asset in an orderly transaction between market participants (“exit price”).The Norwegian properties are valued by using
an internal valuation model. As a supplement, external appraisals are obtained for a representative selection of properties in the portfolio
at regular intervals throughout the year. During the fourth quarter of 2016, external appraisals were obtained for a total of nine properties,
representing 32 per cent of portfolio value. The purpose of the external appraisals is to benchmark the internal valuations against independent references. Internal calculations and the values recorded in the balance sheet are 1.4 per cent lower than average external appraisals.
The Swedish properties in the portfolio and partially owned properties are valued based on external appraisals.
Internal valuation model
In the internal model, fair value is calculated as the present value of future cash flows during and after the contract period. The required rate
of return stipulated in the model reflects market risk. A required rate of return of 7.6 per cent has principally been used. This is a reduction
from 8.0 per cent in the third quarter in response to the current market situation.
Value development and sensitivity
The value of investment properties in DNB Livsforsikring was adjusted upwards by NOK 375 million during the fourth quarter of 2016.
Valuations are particularly sensitive to changes in required rates of return and assumptions regarding future income flows. Other things
equal, a 0.25 percentage point reduction in the required rate of return will change the value of the property portfolio by approximately 4.4
per cent or NOK 550 million. Correspondingly, a 5 per cent change in future market rents will change the value of the property portfolio by
1.2 per cent or NOK 157 million.
Changes in the value of investment properties
Amounts in NOK million
DNB Group
Investment
property
Carrying amount as at 31 December 2014
Additions, purchases of new properties
Additions, capitalised investments
Additions, acquired companies
Net gains
Disposals 1)
Exchange rate movements
Recorded value as at 31 December 2015
30 404
156
349
454
2 417
(17 477)
432
16 734
Carrying amount as at 31 December 2015
Additions, purchases of new properties
Additions, capitalised investments
Additions, acquired companies
Net gains 2)
Disposals 3)
Exchange rate movements
Carrying amount as at 31 December 2016
16 734
84
263
1 259
510
(2 577)
(361)
15 912
1)
2)
3)
Includes NOK 2 638 million in investment properties in DNB Scandinavian Property Fund. The company was no longer consolidated from the third quarter
of 2015, but presented as an associated company.
Of which NOK 35 million represented a net loss on investment properties which are not owned by DNB Livsforsikring.
Includes NOK 622 million in investment properties in the Baltics, reclassified as assets held for sale in August 2016.
30 / DNB GROUP – FOURTH QUARTER REPORT 2016 (PRELIMINARY AND UNAUDITED)
Note 17
Assets and liabilities held for sale
On 25 August 2016 DNB and Nordea announced an agreement to combine their operations in Estonia, Latvia and Lithuania. The
transaction is conditional upon regulatory approvals, and is expected to close in the second quarter of 2017. Nordea and DNB will have
equal voting rights in the combined bank, while having different economic ownership levels that reflect the relative equity value of their
contribution to the combined bank at the time of closing.
Once the transaction has been completed DNB Bank ASA will no longer have full control of its subsidiaries, but will be involved in the
financial and operating policy decisions of the new company established together with Nordea. At end-December 2016 all assets and
related liabilities were presented as held for sale, while there were no changes in the presentation in the income statement. The capital
adequacy reporting was not affected. No impairment loss has been recognised in the income statement following the reclassification. The
subsidiaries are part of DNB’s Large corporates and international customers segment. Following the completion of the transaction, DNB’s
ownership will be consolidated on one line in the financial statement according to the equity method.
The table below shows consolidated balance sheet amounts reclassified as assets and liabilities held for sale at end-December 2016.
DNB Baltics
Amounts in NOK million
31 Dec.
2016
Assets
Cash and deposits with central banks
Due from credit institutions
Loans to customers
Commercial paper and bonds at fair value
Shareholdings
Financial derivatives
Investment properties
Intangible assets
Deferred tax assets
Fixed assets
Other assets
Total assets
3 645
229
45 007
1 713
47
72
607
78
124
406
375
52 303
Liabilities
Due to credit institutions
Deposits from customers
Financial derivatives
Payable taxes
Other liabilities
Provisions
Total liabilities
3 834
36 464
402
21
439
4
41 165
DNB GROUP – FOURTH QUARTER REPORT 2016 (PRELIMINARY AND UNAUDITED) / 31
Note 18
Debt securities issued and subordinated loan capital
As an element in liquidity management, the DNB Group issues and redeems own securities.
Debt securities issued
Amounts in NOK million
Commercial paper issued, nominal amount
Bond debt, nominal amount 1)
Adjustments
Total debt securities issued
DNB Group
Balance
sheet
31 Dec.
2016
153 415
579 622
32 832
765 869
Matured/
redeemed
2016
Exchange
rate
movements
2016
8 917 217 (8 920 456)
78 691
(80 330)
(3 333)
(24 918)
8 995 908 (9 000 786)
(28 251)
Issued
2015
Matured/
redeemed
2015
Exchange
rate
movements
2015
3 057 350
85 108
3 092 739
53 118
(11 338)
13 539
3 142 458
3 145 857
2 200
Issued
2016
Other
adjustments
2016
Balance
sheet
31 Dec.
2015
(5 930)
(5 930)
159 988
606 179
38 761
804 928
Debt securities issued
Amounts in NOK million
Commercial paper issued, nominal amount
Bond debt, nominal amount 1)
Adjustments
Total debt securities issued
DNB Group
Balance
sheet
31 Dec.
2015
159 988
606 179
38 761
804 928
Other
adjustments
2015
Balance
sheet
31 Dec.
2014
(5 899)
(5 899)
206 715
560 650
44 660
812 025
Subordinated loan capital and perpetual subordinated loan capital securities
Amounts in NOK million
Term subordinated loan capital, nominal amount
Perpetual subordinated loan capital, nominal amount
Perpetual subordinated loan capital securities,
nominal amount
Adjustments
Total subordinated loan capital and perpetual
subordinated loan capital securities
Balance
sheet
31 Dec.
2016
19 415
5 602
DNB Group
Issued
2016
Matured/
redeemed
2016
738
(3)
3 732
599
29 347
Exchange
rate
movements
2016
Other
adjustments
2016
(1 158)
(100)
19 838
5 702
(829)
738
(3)
(2 087)
Issued
2015
Matured/
redeemed
2015
Exchange
rate
movements
2015
3 805
4 604
(254)
4 561
853
(254)
30 953
Subordinated loan capital and perpetual subordinated loan capital securities
Amounts in NOK million
Term subordinated loan capital, nominal amount
Perpetual subordinated loan capital, nominal amount
Perpetual subordinated loan capital securities,
nominal amount
Adjustments
Total subordinated loan capital and perpetual
subordinated loan capital securities
1)
Balance
sheet
31 Dec.
2015
19 838
5 702
4 561
853
30 953
DNB Group
Other
adjustments
2015
1 314
909
4 604
2 756
Balance
sheet
31 Dec.
2014
19 322
4 792
533
3 805
Balance
sheet
31 Dec.
2015
(323)
4 028
1 176
(323)
29 319
Minus own bonds. The total nominal amount of outstanding covered bonds in DNB Boligkreditt was NOK 415.8 billion as at 31 December 2016. The
market value of the cover pool represented NOK 599.6 billion.
32 / DNB GROUP – FOURTH QUARTER REPORT 2016 (PRELIMINARY AND UNAUDITED)
Note 19
Off-balance sheet transactions and contingencies
Off-balance sheet transactions and additional information
Amounts in NOK million
Performance guarantees
Payment guarantees
Loan guarantees
Guarantees for taxes etc.
Other guarantee commitments
Total guarantee commitments
Support agreements
Total guarantee commitments etc. *)
Unutilised credit lines and loan offers
Documentary credit commitments
Other commitments
Total commitments
Total guarantee and off-balance commitments
DNB Group
31 Dec.
2016
31 Dec.
2015
30 824
34 411
17 898
6 557
2 713
92 403
6 106
98 509
606 055
3 948
1 397
611 399
709 908
33 665
37 544
16 629
7 271
3 258
98 366
11 827
110 194
598 132
4 790
51
602 973
713 167
326
311
Pledged securities
*)
Of which counter-guaranteed by financial institutions
Contingencies
Due to its extensive operations in Norway and abroad, the DNB Group will regularly be party to a number of legal actions. None of the
current disputes are expected to have any material impact on the Group's financial position.
The DNB Group is subject to a number of complaints and disputes relating to structured products and other investment products.
On 21 June 2016, the Norwegian Consumer Council instituted legal proceedings before the Oslo District Court against DNB Asset
Management AS, a wholly-owned subsidiary of DNB ASA offering asset management services. The Norwegian Consumer Council has
instituted a class action to pursue compensation of up to NOK 690 million on behalf of current and former investors in a fund managed by
DNB Asset Management AS, as well as two funds merged into that fund. The lawsuit alleges that the funds were charging high fees for
active management, but were actually tracking an index. On 6 January 2017, Oslo District Court decided that the Norwegian Consumer
Council is allowed to bring before the court a class action against DNB Asset Management AS. DNB Asset Management AS rejects the
allegations, and no provisions have been made in the accounts.
DNB GROUP – FOURTH QUARTER REPORT 2016 (PRELIMINARY AND UNAUDITED) / 33
DNB ASA
Income statement
Amounts in NOK million
Total interest income
Total interest expenses
Net interest income
Commissions and fees payable
Other income 1)
Net other operating income
Total income
Salaries and other personnel expenses
Other expenses
Total operating expenses
Pre-tax operating profit
Tax expense
Profit for the period
Earnings/diluted earnings per share (NOK)
Earnings per share excluding operations held for sale (NOK)
DNB ASA
4th quarter
2016
4th quarter
2015
Full year
2016
Full year
2015
11
(99)
(87)
(1)
11 013
11 012
10 924
(1)
(114)
(115)
10 810
(84)
10 725
12
(61)
(50)
(1)
8 283
8 282
8 232
(1)
(100)
(101)
8 131
(1 900)
6 231
43
(312)
(268)
(7)
11 213
11 205
10 937
(4)
(461)
(465)
10 472
10 472
108
(246)
(138)
(5)
8 282
8 276
8 139
(6)
(402)
(408)
7 731
(1 815)
5 916
6.58
6.58
3.83
3.83
6.43
6.43
3.63
3.63
Balance sheet
DNB ASA
31 Dec.
2016
31 Dec.
2015
6 824
74 270
11 013
92 107
6 160
68 980
8 369
83 510
Short-term amounts due to DNB Bank ASA
Due to other group companies
Other liabilities and provisions
Long-term amounts due to DNB Bank ASA
Total liabilities
8
5 290
9 285
16 342
30 925
6
1 500
8 740
13 269
23 516
Share capital
Share premium
Other equity
Total equity
Total liabilities and equity
16 288
22 556
22 337
61 181
92 107
16 288
22 556
21 149
59 994
83 510
Amounts in NOK million
Assets
Due from DNB Bank ASA
Investments in group companies
Receivables due from group companies 1)
Total assets
Liabilities and equity
1)
Of which group contributions from DNB Bank ASA represented NOK 9 318 million in 2016 and NOK 6 849 in 2015. The group contribution from DNB
Livsforsikring AS represented NOK 1 090 million in 2016 and NOK 1 095 million in 2015. Group contribution from DNB Forsikring AS represented NOK 450
million in 2016 and NOK 150 million in 2015. The group contribution from DNB Asset Management Holding AS represented NOK 355 million in 2016 and
NOK 275 million in 2015.
Statement of changes in equity
DNB ASA
Share
capital
Share
premium
Other
equity
Total
equity
Balance sheet as at 31 December 2014
Profit for the period
Dividens for 2015 (NOK 4.50 pr. share)
Balance sheet as at 31 December 2015
16 288
22 556
16 288
22 556
22 563
5 916
(7 330)
21 149
61 408
5 916
(7 330)
59 994
Balance sheet as at 31 December 2015
Profit for the period
Dividends for 2016 (NOK 5.70 proposed pr share)
Balance sheet as at 31 December 2016
16 288
22 556
16 288
22 556
21 149
10 472
(9 284)
22 337
59 994
10 472
(9 284)
61 181
Amounts in NOK million
Basis for preparation
DNB ASA has prepared the financial statements according to the Norwegian Ministry of Finance's regulations on annual accounts, Section
1-6, on the use of IFRS. A description of the accounting principles applied by the company when preparing the financial statements appear
in note 1 Accounting principles in the annual report for 2015.
34 / DNB GROUP – FOURTH QUARTER REPORT 2016 (PRELIMINARY AND UNAUDITED)
Key figures
DNB Group
4th quarter
2016
4th quarter
2015
Full year
2016
Full year
2015
Average spread for ordinary lending to customers (%) 1) 2)
Average spread for deposits from customers (%) 1) 2)
1.29
1.96
0.25
1.32
2.11
0.12
1.32
2.04
0.21
1.33
2.17
0.01
Rate of return/profitability
4. Net other operating income, per cent of total income
5. Cost/income ratio (%)
6. Return on equity, annualised (%)
7. RAROC, annualised (%)
8. Average equity including allocated dividend (NOK million)
9. Return on average risk-weighted volume, annualised (%)
33.6
41.2
10.9
10.9
187 027
1.95
29.8
28.1
15.0
11.6
176 846
2.31
34.6
40.9
10.1
11.1
184 056
1.75
34.5
36.9
14.5
11.2
168 509
2.14
Financial strength at end of period
10. Common equity Tier 1 capital ratio, transitional rules (%) 3)
11. Tier 1 capital ratio, transitional rules (%) 3)
12. Capital ratio, transitional rules (%) 3)
13. Common equity Tier 1 capital (NOK million) 3)
14. Risk-weighted volume, transitional rules (NOK million)
16.0
17.6
19.5
168 214
1 051 498
14.4
15.3
17.8
162 906
1 129 373
16.0
17.6
19.5
168 214
1 051 498
14.4
15.3
17.8
162 906
1 129 373
(0.41)
(0.26)
(0.34)
(0.13)
(0.45)
(0.37)
(0.48)
(0.15)
1.49
0.76
1.49
0.76
25 654
13 982
25 654
13 982
62.0
61.2
62.0
61.2
548
2 931
2 726
1 519
563
2 901
3 053
1 507
548
2 931
2 841
1 519
563
2 901
2 946
1 507
11 007
11 380
11 007
11 380
1 628 799
1 628 799
3.16
3.14
1 628 799
1 628 799
4.11
4.09
28.1
1.9
116.94
128.40
10.17
1.10
209.1
111.57
109.80
6.69
0.98
178.8
1 628 799
1 628 799
11.46
11.46
5.70
22.2
4.44
116.94
128.40
11.20
1.10
209.1
1 628 799
1 628 799
14.98
15.01
4.50
1.9
4.10
111.57
109.80
7.33
0.98
178.8
Interest rate analysis
1. Combined weighted total average spread for lending and
deposits - customer segments (%) 1) 2)
2.
3.
Loan portfolio and impairment
15. Individual impairment relative to average net loans to
customers, annualised (%) 1)
16. Impairment relative to average net loans to customers,
annualised (%) 1)
17. Net non-performing and net doubtful loans and guarantees,
per cent of net loans 1)
18. Net non-performing and net doubtful loans and guarantees at
end of period (NOK million) 1)
Liquidity
19. Ratio of customer deposits to net loans to customers at end
of period (%)
Total assets owned or managed by DNB
20. Customer assets under management at end of period (NOK billion)
21. Total combined assets at end of period (NOK billion)
22. Average total assets (NOK billion)
23. Customer savings at end of period (NOK billion) 1)
Staff
24. Number of full-time positions at end of period
The DNB share
25. Number of shares at end of period (1 000)
26. Average number of shares (1 000)
27. Earnings per share (NOK)
28. Earnings per share excl. operations held for sale (NOK)
29. Dividend per share (NOK) 4)
30. Total shareholders' return (%)
31. Dividend yield (%)
32. Equity per share incl. allocated dividend at end of period (NOK)
33. Share price at end of period (NOK)
34. Price/earnings ratio
35. Price/book value
36. Market capitalisation (NOK billion)
1)
2)
3)
4)
Includes assets and liabilities in the Baltics, reclassified as held for sale in August 2016.
As from the first quarter of 2016, interest rate spreads are based on customer segments. Figures for previous periods have been restated accordingly.
Including 50 per cent of profit for the period, except for the full year figures.
Proposed dividend for 2016.
For definitions of selected key figures, see next page.
DNB GROUP – FOURTH QUARTER REPORT 2016 (PRELIMINARY AND UNAUDITED) / 35
Key figures (continued)
Definitions
1, 2, 3
Based on customer segments and nominal values and excluding impaired loans. Measured against the 3-month money market rate.
5
Total operating expenses relative to total income.
6
Return on equity represents the shareholders’ share of profit for the period relative to average equity excluding additional Tier 1 capital.
7
RAROC (Risk-Adjusted Return On Capital) is defined as risk-adjusted profits (shareholders’ share) relative to average equity excluding additional Tier
1 capital. Risk-adjusted profits indicate the level of profits in a normalised situation. Among other things, recorded impairment losses on loans are
replaced by normalised losses.
8
Average equity is estimated on the basis of recorded equity including allocated dividend, but excluding additional Tier 1 capital. Thus this amount
corresponds to the shareholders’ share of equity.
9
The shareholders’ share of profit for the period relative to average risk-weighted volume.
20
Total assets under management for external clients in DNB Asset Management, DNB Livsforsikring and DNB Forsikring.
21
Total assets and customer assets under management.
23
Total deposits from customers, assets under management and equity-linked bonds.
25
The Annual General Meeting on 26 April 2016 authorised the Board of Directors of DNB ASA to acquire own shares for a total face value of up to
NOK 325 759 772, corresponding to 2 per cent of share capital. The shares shall be purchased in a regulated market. Each share may be purchased
at a price between NOK 10 and NOK 200 per share. The authorisation is valid for a period of 12 months from 26 April 2016. Acquired shares shall be
redeemed in accordance with regulations on the reduction of capital. An agreement has been signed with Norwegian Government/Ministry of Trade,
Industry and Fisheries for the redemption of a proportional share of government holdings to ensure that the government's percentage ownership does
not change as a result of the redemption of repurchased shares.
27
The shareholders’ share of profits relative to the average number of shares excluding any holdings of own shares.
28
The shareholders’ share of profits excluding profits from operations held for sale. Holdings of own shares are not included in calculations of the
number of shares.
30
Closing price at end of period less closing price at beginning of period, including dividends reinvested in DNB shares on the dividend payment date,
relative to closing price at beginning of period.
32
The shareholders’ share of equity, excluding additional Tier 1 capital, at end of period relative to the number of shares.
34
Closing price at end of period relative to annualised earnings per share.
35
Share price at end of period relative to equity per share.
36
Number of shares multiplied by the closing share price at end of period.
36 / DNB GROUP – FOURTH QUARTER REPORT 2016 (PRELIMINARY AND UNAUDITED)
Profit and balance sheet trends
Income statement
DNB Group
Amounts in NOK million
Total interest income
Total interest expenses
Net interest income
Commission and fee income
Commission and fee expenses
Net gains on financial instruments at fair value
Net financial result, DNB Livsforsikring
Net risk result, DNB Livsforsikring
Net insurance result, DNB Forsikring
Profit from investments accounted for by the equity method
Net gains on investment properties
Other income
Net other operating income
Total income
Salaries and other personnel expenses
Other expenses
Depreciation and impairment of fixed and intangible assets
Total operating expenses
Pre-tax operating profit before impairment
Net gains on fixed and intangible assets
Impairment of loans and guarantees
Pre-tax operating profit
Tax expense
Profit from operations held for sale, after taxes
Profit for the period
Portion attributable to shareholders
Portion attributable to additional Tier 1 capital holders
Profit for the period
Earnings/diluted earnings per share (NOK)
4th quarter
2016
3rd quarter
2016
2nd quarter
2016
1st quarter
2016
4th quarter
2015
13 273
(4 901)
8 372
2 814
(678)
1 689
(57)
290
181
(45)
(7)
44
4 230
12 602
(2 842)
(1 828)
(524)
(5 194)
7 409
(12)
(1 753)
5 644
(290)
26
5 380
12 976
(4 495)
8 481
2 851
(835)
1 411
45
109
148
(0)
(5)
205
3 929
12 409
(2 874)
(1 694)
(475)
(5 043)
7 366
20
(2 176)
5 209
(1 130)
1
4 080
12 880
(4 336)
8 544
2 992
(856)
1 029
(68)
234
204
1 148
(18)
287
4 952
13 496
(2 911)
(1 965)
(510)
(5 385)
8 111
(20)
(2 321)
5 770
(1 190)
(10)
4 569
13 295
(4 582)
8 713
2 794
(803)
2 384
9
103
115
86
(5)
259
4 942
13 655
(3 277)
(1 765)
(668)
(5 711)
7 945
(6)
(1 174)
6 764
(1 529)
(13)
5 222
13 934
(4 872)
9 062
2 916
(834)
2 164
(928)
247
132
(28)
122
35
3 825
12 888
(1 106)
(1 931)
(590)
(3 626)
9 262
(9)
(1 420)
7 833
(1 077)
28
6 784
5 143
238
5 380
3 952
128
4 080
4 454
115
4 569
5 107
115
5 222
6 658
126
6 784
3.16
2.43
2.74
3.41
4.11
Comprehensive income statement
DNB Group
Amounts in NOK million
Profit for the period
Actuarial gains and losses
Property revaluation
Items allocated to customers (life insurance)
Items that will not be reclassified to the income statement
Currency translation of foreign operations 1)
Currency translation reserve reclassified to the income statement
Hedging of net investment 2)
Investments according to the equity method 3)
Investments according to the equity method, reclassified
to the income statement 3)
Items that may subsequently be reclassified to the income statement
Other comprehensive income for the period (net of tax)
Comprehensive income for the period
1)
2)
3)
4th quarter
2016
3rd quarter
2016
2nd quarter
2016
1st quarter
2016
4th quarter
2015
5 380
(23)
37
(37)
(23)
3 562
4 080
(122)
7
(7)
(122)
(4 321)
4 569
5 222
(39)
2
(2)
(39)
(4 376)
6 784
31
(282)
282
31
2 369
(2 415)
4
2 950
4
2 968
(33)
(1 578)
889
1 151
1 128
6 509
(1 367)
(1 489)
2 591
(1 442)
(1 480)
3 742
1 680
1 710
8 494
1
(1)
(1 340)
(43)
843
(855)
(1 395)
(1 395)
3 173
Currency translation effects related to the Baltics came to NOK 103 million in the fourth quarter of 2016.
Hedging of net investments in the Baltics reoresented a loss of NOK 61 million in the fourth quarter of 2016, net of tax.
DNB had indirect ownership interests in Visa Europe through its membership in Visa Norge. In connection with the valuation of the holdings in Visa Europe
as at 31 March 2016 an accumulated gain of NOK 855 million was recognised in other comprehensive income. Upon the completion of the acquisition of
Visa Europe by Visa Inc in the second quarter of 2016, this amount was reclassified to profit and a total gain of NOK 1 128 million was recognised as
"Profit from investments accounted for by the equity method" in the income statement.
DNB GROUP – FOURTH QUARTER REPORT 2016 (PRELIMINARY AND UNAUDITED) / 37
Profit and balance sheet trends (continued)
Balance sheet
DNB Group
31 Dec.
2016
30 Sept.
2016
30 June
2016
31 March
2016
31 Dec.
2015
208 263
176 442
1 509 078
296 642
22 512
60 220
157 940
94 008
15 912
7 768
5 814
1 404
7 949
52 541
36 709
2 653 201
175 212
192 931
1 484 756
302 291
21 205
56 417
187 023
95 963
15 493
7 901
5 759
943
7 898
52 482
45 210
2 651 484
154 438
214 902
1 542 285
300 706
25 626
52 893
198 953
99 489
16 419
7 869
5 903
1 061
8 565
180
35 867
2 665 157
166 587
180 065
1 534 902
286 273
27 578
50 967
215 743
100 516
15 416
9 715
5 963
1 100
8 717
204
35 338
2 639 081
19 317
301 216
1 542 744
289 695
19 341
49 679
203 029
105 224
16 734
9 525
6 076
1 151
8 860
200
25 739
2 598 530
Due to credit institutions
Deposits from customers
Financial derivatives
Debt securities issued
Insurance liabilities, customers bearing the risk
Liabilities to life insurance policyholders in DNB Livsforsikring
Insurance liabilities, DNB Forsikring
Payable taxes
Deferred taxes
Other liabilities
Liabilities held for sale
Provisions
Pension commitments
Subordinated loan capital
Total liabilities
212 882
934 897
130 161
765 869
60 220
208 160
1 892
8 874
3 816
44 568
41 243
2 094
2 756
29 347
2 446 779
192 979
917 952
155 491
784 953
56 417
210 425
2 057
7 093
7 860
49 806
39 547
1 762
3 003
28 202
2 457 549
189 824
961 138
156 121
811 523
52 893
210 027
2 108
5 080
7 950
43 174
59
1 725
2 757
29 498
2 473 878
160 778
927 559
173 398
829 997
50 967
210 230
2 125
4 186
7 780
44 009
56
1 570
2 684
29 826
2 445 165
161 537
944 428
154 663
804 928
49 679
208 726
1 846
2 093
7 672
37 675
71
1 285
2 549
30 953
2 408 105
Share capital
Share premium
Additional Tier 1 capital
Other equity
Total equity
Total liabilities and equity
16 286
22 609
15 952
151 576
206 423
2 653 201
16 288
22 609
9 641
145 397
193 935
2 651 484
16 282
22 609
9 559
142 829
191 279
2 665 157
16 268
22 609
8 067
146 972
193 916
2 639 081
16 257
22 609
8 353
143 207
190 425
2 598 530
Amounts in NOK million
Assets
Cash and deposits with central banks
Due from credit institutions
Loans to customers
Commercial paper and bonds at fair value
Shareholdings
Financial assets, customers bearing the risk
Financial derivatives
Commercial paper and bonds, held to maturity
Investment properties
Investments accounted for by the equity method
Intangible assets
Deferred tax assets
Fixed assets
Assets held for sale
Other assets
Total assets
Liabilities and equity
38 / DNB GROUP – FOURTH QUARTER REPORT 2016 (PRELIMINARY AND UNAUDITED)
Information about the DNB Group
Head office DNB ASA
Mailing address
Visiting address
Telephone
Internet
Organisation number
P.O.Box 1600 Sentrum, NO-0021 Oslo
Dronning Eufemias gate 30, Oslo
+47 915 04800
dnb.no
Register of Business Enterprises NO 981 276 957 MVA
Board of Directors in DNB ASA
Anne Carine Tanum, chairman
Tore Olaf Rimmereid, vice-chairman
Jarle Bergo
Carl A. Løvvik
Vigdis Mathisen
Jaan Ivar Semlitsch
Berit Svendsen
Group management
Rune Bjerke
Bjørn Erik Næss
Kjerstin Braathen
Trond Bentestuen
Benedicte Schilbred Fasmer
Harald Serck-Hanssen
Ottar Ertzeid
Tom Rathke
Rune Garborg
Liv Fiksdahl
Solveig Hellebust
Terje Turnes
Thomas Midteide
Kari Olrud Moen
Group chief executive
Chief financial officer (until 1 March)
Chief financial officer (from 1 March)
Group executive vice president Personal Banking Norway
Group executive vice president Corporate Banking Norway
Group executive vice president Large Corporates and International
Group executive vice president DNB Markets
Group executive vice president Wealth Management
Group executive vice president Vipps and Payments
Group executive vice president IT and Operations
Group executive vice president HR
Group executive vice president Risk Management
Group executive vice president Corporate Communications
Group executive vice president Group projects
Investor Relations
Bjørn Erik Næss, chief financial officer (until 1 March)
Kjerstin Braathen, chief financial officer (from 1 March)
Rune Helland, head of Investor Relations
Amra Koluder, SVP Investor Relations
Thor Tellefsen, Long Term Funding
tel. +47 4150 5201
tel. +47 9056 6848
tel. +47 2326 8400
tel. +47 2326 8404
tel. +47 2326 8404
[email protected]
[email protected]
[email protected]
[email protected]
[email protected]
Financial calendar
Annual report 2016
Annual general meeting 2017
Ex-dividend date 2017
Distribution of dividends 2017
Q1 2017
Q2 2017
Q3 2017
Capital markets day 2017
9 March 2017
25 April 2017
26 April 2017
as of 5 May 2017
28 April 2017
12 July 2017
26 October 2017
21 November 2017
Other sources of information
Annual and quarterly reports
Separate annual and quarterly reports are prepared for the DNB Bank Group, DNB Boligkreditt, DNB Næringskreditt and DNB
Livsforsikring. The reports and the Fact Book are available on dnb.no. Annual and quarterly reports can be ordered by sending
an e-mail to Investor Relations.
The quarterly report has been produced by Group Financial Reporting in DNB.
Cover design: REDINK
Photo: iStock
DNB GROUP – FOURTH QUARTER REPORT 2016 (PRELIMINARY AND UNAUDITED) / 39
Here for you. Every day.
When it matters the most.
DNB
Mailing address:
P.O.Box 1600 Sentrum
N-0021 Oslo
Visiting address:
Dronning Eufemias gate 30
Bjørvika, Oslo
dnb.no


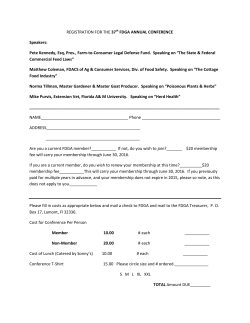
© Copyright 2026