
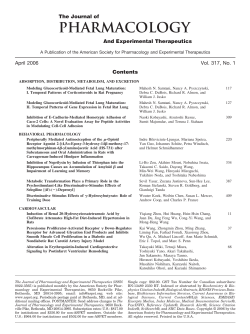
Interleukin-2 Receptor Subunit Expression and
From www.bloodjournal.org by guest on January 12, 2015. For personal use only.
CORRESPONDENCE
chromosomal translocation t(4;14)(p16.3;q32) in multiple myeloma
involves the fibroblast growth-factor receptor 3 gene. Blood 10:4062, 1997
9. Tavormina PL, Shiang R, Thompson LM, Zhu YZ, Wilkin DJ,
Lachman RS, Wilcox WR, Rimoin DL, Cohn DH, Wasmuth JJ:
Thanatophoric dysplasia (types I and II) caused by distinct mutations in
fibroblast growth factor receptor 3. Nat Genet 9:321, 1995
10. Caligaris-Cappio F, Bergui L, Gregoretti MG, Gaidano G,
Gaboli M, Schena M, Zallone AZ, Marchisio PC: Role of bone marrow
stromal cells in the growth of human multiple myeloma. Blood 77:2688,
1991
11. Allouche M: Basic fibroblast growth factor and hematopoiesis.
Leukemia 9:937, 1995
12. Keegan K, Johnson DE, Williams LT, Hayman MJ: Isolation of
2989
an additional member of the fibroblast growth factor receptor family,
FGFR-3. Proc Natl Acad Sci USA 88:1095, 1991
13. Perez-Castro AV, Wilson J, Altherr MR: Genomic organization
of the human fibroblast growth factor receptor 3 (FGFR3) gene and
comparative sequence analysis with the mouse fgfr3 gene. Genomics
41:10, 1997
14. Shiang R, Thompson LM, Zhu YZ, Church DM, Fielder TJ,
Bocian M, Winckur ST, Wasmuth JJ: Mutations in the transmembrane
domain of FGFR3 cause the most common genetic form of dwarfism,
achondroplasia. Cell 78:335, 1994
15. Rousseau F, Saugier P, Le Merrer M, Munnich A, Delezoide A-L,
Maroteaux P, Bonaventure J, Narcy F, Sanak M: Stop codon FGFR3
mutations in thanatophoric dwarfism type 1. Nat Genet 10:11, 1995
Interleukin-2 Receptor Subunit Expression and Function on Human Peripheral T
Cells Is Not Dependent on the Anticoagulant
To the Editor:
In a recent report, David et al1 addressed the ongoing controversy on
expression levels of interleukin-2 receptor (IL-2R) a, b, and g chains on
various mononuclear cells from the peripheral blood. Using freshly
isolated peripheral blood mononuclear cells (PBMCs) from (sodium)
heparinized blood and fluorescein isothiocyanate (FITC)-labeled commercial monoclonal antibodies, they showed that all three IL-2R chains
usually are hardly detectable on either CD4 or CD8 T cells from healthy
donors and from hemochromatosis patients. These results are in contrast
with the much higher levels of IL-2R subunits on T cells observed by
several investigators, including ourselves.2-9 David et al1 tentatively
explain the discrepancy by invoking effects of anticoagulant and of
storage. Indeed, if Ca21 chelators were used instead of heparin, the
levels of all three IL-2R chains on T cells apparently increased, and
overnight storage of heparinized blood also seemed to upregulate IL-2R
subunit expression.
These observations are very important, because they not only seem to
settle a long-standing controversy on IL-2R expression, but they also
imply that the use of Ca21 chelators as anticoagulant instead of heparin
could dramatically influence the sensitivity of the T cells to IL-2.
Because IL-2 and other common g-chain triggering cytokines are
central to almost any T-cell function, EDTA or citrate anticoagulants
should be avoided if subsequent functional testing is envisioned. A lot of
immunological research is based on buffy coats, which routinely are
anticoagulated with citrate. In our own studies of T-cell function during
human immunodeficiency virus (HIV) infection, we have systematically used EDTA blood as starting material, because it is readily
available and because we did not find a functional difference between
lymphocytes derived from blood anticoagulated with heparin, citrate, or
EDTA in preliminary experiments. In view of the findings of David et
al,1 we felt obliged to carefully control the effect of Ca21 chelators on
IL-2R expression and function and we did not observe any significant
influence of the anticoagulant.
In three separate experiments, blood from five healthy control
subjects (all lab personnel) was drawn at 10 AM in three different tubes
from Sarstedt containing either sodium heparin (final concentration, 0.3
mg/mL), potassium-EDTA (final concentration, 1.6 mg/mL), or sodiumcitrate (final concentration, 10.6 mmol/L). The largest part of each tube
was immediately processed for mononuclear cell (PBMC) separation,
using Histopaque 1077 (Sigma, Bornem, Belgium), whereas the rest
was kept at room temperature. At 2 PM, 50 µL of whole blood and 50 µL
of PBMCs (containing 200,000 cells), derived from each of the three
anticoagulant tubes, were incubated for 20 minutes at 4°C with 0.1 µg of
the nonconjugated reference monoclonals anti-Tac (IL-2Ra–specific;
obtained from Dr Thomas Waldman, National Institutes of Health,
Bethesda, MD) and with 2R-B (IL-2Rb–specific; from Dr Takashi
Uchiyama, Institute for Virus Research, Kyoto University, Kyoto,
Japan). As an isotypic (IgG1) control, we used purified 56D3 directed
against an irrelevant parasitic antigen (provided by Dr J. Brandt,
Institute of Tropical Medicine, Antwerpen, Belgium). After washing
with phosphate-buffered saline (PBS), containing 0.5% bovine serum
albumin, 1 µL of FITC-labeled F(ab8) 2 goat antimouse IgG (Tago,
Burlingame, CA) was added for another 20 minutes. After washing
again, the remaining binding sites on the FITC-conjugate were blocked
with 5 µL of mouse serum. Next, 5 µL of phycoerythrin (PE)-labeled
anti-CD4 and 5 µL of peridinin-chlorophyll A protein (PercP)-labeled
anti-CD3 (both from Becton Dickinson, Erembodegem, Belgium) were
added for the last 20 minutes. The tubes with whole blood were then
subjected to the Becton Dickinson lysing solution. All preparations
were washed once and fixed with 1% paraformaldehyde. The samples
were analyzed on a FACScan (Becton Dickinson) using the LYSYS I
software.
Based on the scatter and the CD3/CD4 expression, the CD41 and
CD42 T lymphocytes were gated separately and the distribution of the
first fluorescence was represented in a histogram for each subset. An
example of this analysis is shown in Fig 1. It is evident that, within both
the CD41 and CD42 T-cell populations, the expression profile of
IL-2Ra is rather broad and tends to be bimodal (a negative and a
positive subpopulation), whereas the curve of IL-2Rb is unimodal and
shows a shift to the right, which is most evident in the CD42 subset. We
chose to express the results for both chains as percentage of positive
cells, after establishing a narrow threshold at a relative fluorescence
intensity of 10, based on the background of the control monoclonal. A
summary of the results is shown in Table 1. No significant difference
was observed in the level of IL-2R a and b chains on CD41 or CD42 T
cells, according to the anticoagulant used and regardless of whether the
cells were stained in the context of whole blood or PBMCs. Comparing
the mean fluorescence intensity of all gated cells (instead of the
percentage of positive cells) showed similar results and confirmed that
the low level of IL-2Rb expression on CD41 T cells significantly
differed from background (data not shown).
We next wanted to know whether the anticoagulant influences the
sensitivity to IL-2. To this end, we cultured the three preparations of
PBMCs at a final concentration of 106/mL in RPMI, supplemented with
antibiotics (GIBCO, Paisley, UK) and 10% bovine calf serum (Hyclone,
From www.bloodjournal.org by guest on January 12, 2015. For personal use only.
2990
CORRESPONDENCE
Fig 1. Representative binding profiles of a control
MoAb, the anti–IL-2Ra MoAb anti-Tac, and the anti–
IL-2Rb MoAb 2RB on CD41 and CD42 T cells, assessed in three-color flow cytometry.
Logan, UT), in the presence or absence of 100 U/mL IL-2 (BoehringerMannheim, Brussels, Belgium) at 37°C in a 5% CO2 atmosphere. After
an overnight incubation, the cells were stained with a combination of
either FITC-labeled IgG1 or anti-CD69-FITC and anti-CD4-PE plus
anti-CD3-PercP (all from Becton Dickinson). As shown in Table 2, the
specific expression of CD69 on CD41 and CD42 T cells is similarly
upregulated by IL-2, irrespective of the original anticoagulant. The only
(nonsignificant) difference was a lower IL-2–induced CD69 on CD42 T
cells from EDTA blood, as compared with heparinized or citrated blood.
The latter observation certainly does not plead for a higher sensitivity of
Table 1. Effect of Anticoagulant on T-Cell Expression of IL-2R a and b Chains
CD41 T Cells
K-EDTA
Whole blood
PBMCs
Na-heparin
Whole blood
PBMCs
Na-citrate
Whole blood
PBMCs
CD42 T Cells
Control IgG1
Anti–IL-2R a
Anti–IL-2R b
Control IgG1
Anti–IL-2R a
Anti–IL-2R b
0.3 6 0.2
0.7 6 0.3
49.6 6 8.2
49.2 6 3.5
2.3 6 1.3
3.3 6 0.8
0.7 6 0.6
1.4 6 1.2
14.5 6 5.1
15.5 6 5.6
28.4 6 13.4
30.8 6 10.2
3.4 6 6.6
1.0 6 0.6
49.7 6 6.3
48.4 6 5.7
2.7 6 1.0
3.3 6 0.4
2.8 6 4.9
1.3 6 0.6
15.9 6 5.3
14.5 6 3.6
32.2 6 14.5
30.7 6 11.9
0.3 6 0.3
0.9 6 0.5
49.6 6 7.9
49.7 6 6.5
2.6 6 1.0
2.6 6 0.7
0.9 6 0.8
1.4 6 0.7
16.2 6 6.1
15.3 6 4.5
31.1 6 12.6
26.0 6 8.6
Values are the percentage of cells within the indicated subset showing a relative fluorescence intensity of greater than 10 after incubation with
the indicated monoclonal (mean 6 SD).
From www.bloodjournal.org by guest on January 12, 2015. For personal use only.
CORRESPONDENCE
2991
Table 2. Effect of Anticoagulant on T-Cell Sensitivity to IL-2
% CD69 Expression After 1 Day of Culture
On CD41 T Cells
Culture
Condition
Medium
Only
IL-2
(100 U/mL)
On CD42 T Cells
Medium
Only
IL-2
(100 U/mL)
PBMC isolated from
K-EDTA blood
3.3 6 1.5 9.5 6 5.7 10.7 6 2.4 28.6 6 6.4
Na-heparin blood 2.1 6 0.6 9.8 6 19.0 9.4 6 3.2 40.7 6 18.6
Na-citrate blood
3.3 6 1.6 10.0 6 13.9 9.4 6 1.8 37.6 6 14.7
Values are the percentage of cells within the indicated subset
showing specific binding to anti-CD69-FITC (mean 6 SD).
T cells from EDTA blood, which is to be expected if the latter
anticoagulant was able to upregulate IL-2R expression, as suggested by
David et al.1
To make absolutely sure that the storage of 4 hours we used in our
standard procedure did not influence the results, we performed two
additional experiments in which either whole blood anticoagulated with
heparin, EDTA, or citrate or the isolated PBMCs were stained for
IL-2Ra or CD69 either immediately or after 4 hours of incubation at
room temperature. Again, no differences in CD25 or CD69 expression
were observed, regardless of whether completely fresh cells or cells
after 4 hours were used, thus excluding spurious activation upon
short-term storage of blood or PBMCs.
In summary, our well-controlled flow cytometric measurements,
using a sensitive indirect labeling technique and reference anti-a and
anti-b monoclonal antibodies, confirm our own and other investigators’
previous findings that both IL-2R a and b chains are expressed to a
significant extent on both resting CD41 and CD42 T cells.2-9 We further
confirmed that the a chain is predominantly present on CD4 T cells,
whereas the b chain is more prominently expressed on the CD42 subset,
largely corresponding to the CD81 T cells. Moreover, our present data
clearly show that the level of IL-2R chain expression is not influenced
by the use of a Ca21-chelating anticoagulant and is similar in the context
of fresh whole blood and freshly isolated PBMCs. We did not
investigate the effect of prolonged storage, because, in our experience,
such a treatment results in a variable degree of viability loss, which
might induce artifacts. However, short-term storage for 4 hours had no
influence on either IL-2Ra or CD69. Our culture experiments with
added IL-2 further indicated that the IL-2R function, as measured by
upregulation of CD69 on T cells, is also not significantly influenced by
the anticoagulant.
In our previous studies, we showed that the CD69 upregulation by
IL-2 on CD4 T cells could be blocked by a combination of anti–IL-2R a
and b monoclonals, pointing to an implication of the high-affinity
receptor. In CD8 T cells, nearly complete blocking could be obtained by
anti-b monoclonals alone at high IL-2 concentrations, whereas, at lower
concentration, a synergistic effect of anti-a and anti-b monoclonals was
obvious.2 Thus, the expression of both a and b chains was shown to be
of functional relevance in both T-cell subsets. In a separate report, we
recently demonstrated IL-2R g chain expression on at least 60% of both
CD4 and CD8 T cells from healthy donors and HIV-infected subjects.10
An incomplete screening of the literature found that at least two other
independent groups of investigators who stained PBMCs isolated from
heparinized blood with the same reference anti-Tac monoclonal but a
different anti-b (Mik1-b) showed expression levels of IL-2R chains on
peripheral T cells very similar to those we observed.5,6 However, other
investigators, also starting from heparinized blood but using different
monoclonals and/or different staining procedures, reported lower or
even no measurable expression of the IL-2R subunits, indeed.11-13 The
seemingly low expression of IL-2R chains observed by some investiga-
tors thus might relate to technical factors, including the affinity of the
antibodies used or the sensitivity of the cytofluorometer rather than to
the kind of anticoagulant.
In conclusion, we feel that the use of sensitive staining procedures is
crucial to correctly assess IL-2R expression on resting T cells.
Moreover, we are convinced that the anticoagulant does not influence
IL-2R expression or function in peripheral blood T cells.
ACKNOWLEDGMENT
Supported by Grants No. 3.0307.95 and 3.0226.96 of the ‘‘Fonds
voor Wetenschappelijk Onderzoek Vlaanderen’’ (Fund for Scientific
Research of Flanders).
Guido L. Vanham
Godelieve Penne
Chris Vereecken
Johan Vingerhoets
Luc Kestens
Laboratory of Immunology
Department of Microbiology
Institute of Tropical Medicine
Antwerpen, Belgium
REFERENCES
1. David D, Bani L, Moreau J-L, Demaison C, Sun K, Salvucci O,
Nakarai T, de Montalembert M, Chouaib S, Joussemet M, Ritz J, The`ze
J: Further analysis of interleukin-2 receptor subunit expression on the
different human peripheral blood mononuclear cell subsets. Blood
91:165, 1998
2. Vanham G, Kestens L, Vingerhoets J, Penne G, Colebunders R,
Vandebruaene M, Goeman J, Ceuppens JL, Sugamura K, Gigase P: The
interleukin-2 receptor expression and function on peripheral blood
lymphocytes from HIV-infected and control persons. Clin Immunol
Immunopathol 71:60, 1994
3. Zola H, Mantzioris BX, Webster J, Kette FE: Circulating human T
and B lymphocytes express the p55 interleukin-2 receptor molecule
(TAC, CD25). Immunol Cell Biol 67:233, 1989
4. Zola H, Purling RJ, Koh LY, Tsudo M: Expression of the p70
chain of the IL-2 receptor on human lymphoid cells: Analysis using a
monoclonal antibody and high-sensitivity immunofluorescence. Immunol Cell Biol 68:217, 1990
5. Sheldon A, Flego L, Zola H: Coexpression of IL-2 receptor p55
and p75 by circulating blood lymphocytes. J Leukoc Biol 54:161, 1993
6. Taga K, Kasahara Y, Yachie A, Miyawaki T, Taniguchi N:
Preferential expression of IL-2 receptor subunits on memory populations within CD4(1) and CD8(1) T cells. Immunology 72:15, 1991
7. Kanegana H, Miyawaki T, Kato K, Yokoi T, Uehara T, Yachie A,
Taniguchi N: A novel subpopulation of CD45RA(1) CD4(1) T cells
expressing IL-2 receptor a-chain and having a functionally transitional
nature into memory cells. Int Immunol 12:1349, 1991
8. Zola H, Koh LY, Mantzioris BX, Rhodes D: Patients with HIV
infection have a reduced proportion of lymphocytes expressing the IL-2
receptor p22 chain (TAC, CD25). Clin Immunol Immunopathol 59:16,
1991
9. Hofmann B, Nishanian P, Fahey JL, Esmail I, Jackson AL, Detels
R, Cumberland W: Serum increases and lymphoid cell surface losses of
IL-2 receptor CD25 in HIV infection: Distinctive parameters of
HIV-induced change. Clin Immunol Immunopathol 61:212, 1991
10. Vingerhoets J, Bisalinkumi E, Penne G, Colebunders R, Bosmans E, Kestens L, Vanham G: Altered receptor expression and
decreased sensitivity of T cells to the stimulatory cytokines IL-2, IL-7
and IL-12 in HIV-infection. Immunol Lett 61:53, 1998
From www.bloodjournal.org by guest on January 12, 2015. For personal use only.
2992
CORRESPONDENCE
11. Ohashi Y, Takeshita T, Nagata K, Mori S, Sugamura K:
Differential expression of the IL-2 receptor subunits p55 and p75 on
various populations of primary peripheral blood mononuclear cells. J
Immunol 143:3548, 1989
12. Yagita H, Nakata M, Azuma A, Nitta T, Takeshita T, Sugamura
K, Okumura K: Activation of peripheral blood T cells via the p75
interleukin-2 receptor. J Exp Med 170:1445, 1989
13. Caligiuri MA, Zmuidzinas A, Manley TJ, Levine H, Smith KA,
Ritz J: Functional consequences of interleukin-2 receptor expression on
resting human lymphocytes. J Exp Med 171:1509, 1990
Response
We have recently published in BLOOD the first extensive
survey concerning IL-2Ra, IL-2Rb, and IL-2Rg expression by
human PBMC subsets.1 More than 100 donors were examined through a
4-year period and the results are consistent with our published data.1
Throughout the work, care was taken to study healthy donors and
resting PBMCs. The reported results were obtained by measuring cell
surface and intracellular expression of IL-2Ra, IL-2Rb, and IL-2Rg by
flow cytometry. The data were verified for the three chains by
measuring mRNA expression. For intracellular expression of IL-2Rg,
Western blot analysis was also performed. Table 1 summarizes the
data.
Several reasons may explain why Vanham et al were not able to
obtain the same results concerning cell surface expression of IL-2Ra by
CD4 and CD8 T lymphocytes.
(1) Their donors were apparently not controlled. Under some
circumstances, we also found IL-2Ra expression by CD4 T cells, for
instance during and after winter and spring seasonal infections. In our
study, donors went through a rigorous medical check-up before blood
collection.
(2) Their assay does not identify a clear negative lymphocyte
population; therefore, we cannot exclude either that their assay is not
reliable or that their cells are activated. Under these conditions, it may
not be surprising that they do not find any influence of anticoagulants. In
our hands, all the PBMC subsets analyzed from healthy donors were
negative for IL-2Ra expression, and we use cells from hemochromatosis patients as a positive control to show that our assay was able to
detect IL-2Ra when expressed. These results were misinterpreted by
Vanham et al. Furthermore, we show that IL-2Ra could be in vitro
induced in IL-2Ra–negative resting CD4 T cells after various stimulations.2
(3) The very poor and inconsistent (high standard deviation) induction of CD69 by CD4 T cells after IL-2 stimulation shown by Vanham et
al suggests that their cells do not express IL-2R, and not the contrary.
Furthermore, we previously demonstrated that IL-2 reactivity does not
always correlate with IL-2R expression.3
In conclusion, it is commonly accepted that CD25 expression correlates with T-cell activation and that resting T cells do not
express CD25.4-10 Therefore, we believe that Vanham et al should
make a more detailed study before claiming high expression of
CD25 by resting CD4 T cells. They should be aware that, in the IL-2R
system, there are not yet defined reference reagents and techniques and
that their methods may have to be improved and controlled if they
intend to modify almost consensual data concerning IL-2Ra
expression.
Denis David
Lynda Bani
Jean-Louis Moreau
Jacques The`ze
Unite´ d’Immunoge´ne´tique Cellulaire
De´partement d’Immunologie
Institut Pasteur
Paris, France
Table 1. Expression of IL-2R Chains and Specific mRNA by PBMCs of Healthy Adult Donors: Summary of our Data Presented in BLOOD
CD4 T
Lymphocytes
Cell surface expression (flow cytometry)*
a
b
g
Intracellular protein (intracellular flow cytometry)
a
b
g
mRNA (RT-PCR)
a
b
g
B
Lymphocytes
CD8 T
Lymphocytes
Monocytes
NK
Cells
,5%
,5%
,5%
F5%
14% 6 5.2%‡
8.6% 6 7.5%‡
,5%
,5%
49% 6 6.0%§
,5%
78% 6 3.1%
,5%
,5%
,5%
.60%
,5%
,5%
.45%
,5%
,5%
.45%
ND
ND
ND
,5%
.40%
.60%
—
—
1
—
—
1
—
—(1)\
1
—
—
1
—
1
1
F5%†
,5%
,5%
Values in bold and underlined are results in disagreement with the letter of Vanham et al, whereas values in italic and underlined are results in
partial agreement with the letter of Vanham et al.
Abbreviations: ND, not determined; —, not detected.
*Percentage of positive cells.
†Expression of less than 5% is considered nonsignificant.
‡Two kinds of donors can be distinguished. Most of them do not express significantly b or g IL-2R chains, whereas 30% of them highly expressed
these chains. This results in an important standard deviation.
§IL-2Rg chain is expressed for all donors but with a variable intensity.
\mRNA detected for few donors in agreement with the ‡ note.
From www.bloodjournal.org by guest on January 12, 2015. For personal use only.
CORRESPONDENCE
2993
REFERENCES
1. David D, Bani L, Moreau J-L, Demaison C, Sun K, Salvucci O,
Nakarai T, de Montalembert M, Chouaib S, Joussemet M, Ritz J, The`ze J:
Further analysis of interleukin-2 receptor subunit expression on the different
human peripheral blood mononuclear cell subsets. Blood 91:165, 1998
2. Bani L, David D, Moreau J-L, Cayota A, Nakarai T, Ritz J, The`ze
J: Expression of the IL-2 receptor g subunit in resting human CD4 T
lymphocytes: mRNA is constitutively transcribed and the protein stored
as an intracellular component. Int Immunol 9:573, 1997
3. Moreau J-L, Chastagner P, Tanaka T, Miyasaka M, Kondo M,
Sugamura K, The`ze J: Control of IL-2 responsiveness of B lymphocytes
by IL-2 and IL-4. J Immunol 155:3401, 1995
4. Robb RJ, Munck A, Smith KA: T cell growth factor receptors. J
Exp Med 154:1455, 1981
5. Cantrell DA, Smith KA: Transient expression of interleukin-2
receptors. Consequences for T cell growth. J Exp Med 158:1895, 1983
6. Depper JM, Leonard WJ, Kro¨nke M, Noguchi PD, Cunningham
RE, Waldmann TA, Greene WC: Regulation of interleukin 2 receptor
expression: Effects of phorbol diester, phospholipase C, and reexposure
to lectin or antigen. J Immunol 133:3054, 1984
7. Ohashi Y, Takeshita T, Nagata K, Mori S, Sugamura K: Differential expression of the IL-2 receptor subunits, p55 and p75 on various
populations of primary blood mononuclear cells. J Immunol 143:3548, 1989
8. Caligiuri MA, Zmuidzinas A, Manley TJ, Levine H, Smith KA,
Ritz J: Functional consequences of interleukin 2 receptor expression on
resting human lymphocytes. J Exp Med 171:1509, 1990
9. Nakarai T, Robertson MJ, Streuli M, Wu Z, Ciardelli TL, Smith
KA, Ritz J: Interleukin 2 receptor g chain expression on resting and
activated lymphoid cells. J Exp Med 180:241, 1994
10. Unutmaz D, Pileri P, Abrignani S: Antigen-independent activation of naive and memory resting T cells by a cytokine combination. J
Exp Med 180:1159, 1994
Primary Recurrent Miscarriages: Anti–b2-Glycoprotein I IgG Antibodies Induce
an Acquired Activated Protein C Resistance That Can Be Detected
by the Modified Activated Protein C Resistance Test
To the Editor:
Using the study of affinity-purified IgG phospholipid-dependent
inhibitors on the time-course of factor Va generation and inactivation, Galli et
al1 demonstrated convincingly that anti–b2-glycoprotein I antibodies induce an acquired resistance to activated protein C (aPC), thus providing
a new possible explanation for their thrombogenic potential.
We have studied the effect of various antiphospholipid IgG antibodies
on the activated protein C-mediated factor Va proteolysis (aPC-FV)
using the modified aPC-resistance test that includes predilution of
patient plasma in factor V depleted plasma, according to Jorquera et al2
(Coatest APC Resistance V; Chromogenix, Mo¨lndal, Sweden; results
given as aPC-FV ratios:time obtained in the presence of aPC divided by
the time obtained, using the same plasma, in absence of aPC).
All patients were nonthrombotic young women who had experienced
primary unexplained recurrent miscarriages. They had been controlled
to be negative for the R506Q (factor V Leiden) mutation. Lupus
anticoagulant activity (LA) had been tested according to the revised
Table 1. Effect of Various Plasmas Positive for Antiphospholipid-Related Markers on the AP C-Mediated Factor Va Proteolysis
(aPC-FV) Using the Modified aPC-Resistance Test
aPC-FV Ratio
Mixing Studies 1:1
Patient Plasmas
Control plasmas (n 5 200)
Whole plasmas
NP (pooled control plasmas)
Isolated LA (n 5 10)
Whole plasmas
IgG-depleted plasmas
Isolated aCLAb (n 5 10)
Whole plasmas
IgG-depleted plasmas
Isolated ab2GP1Ab (n 5 10)
Whole plasmas
IgG-depleted plasmas
Isolated aFIIAb (n 5 2)
Whole plasmas
IgG-depleted plasmas
Isolated aAnVAb (n 5 10)
Whole plasmas
IgG-depleted plasmas
NP
2.54 (2.08-3.36)
2.55
2.55 (2.19-2.96)
2.55
2.64 (2.19-3.24)
2.57 (2.11-3.18)
2.59 (2.23-2.85)
2.55 (2.28-2.80)
2.72 (2.31-3.30)
2.68 (2.35-3.22)
2.63 (2.35-2.96)
2.60 (2.38-3.01)
1.52 (1.11-2.02) [1]
2.42 (2.12-2.65) [2]
1.75 (1.23-2.19) [3]
2.45 (2.23-2.60) [4]
(2.76-3.15)
(2.80-3.04)
(2.65-2.96)
(2.71-2.82)
2.61 (2.25-3.00)
2.58 (2.29-3.05)
2.58 (2.36-2.88)
2.55 (2.34-2.79)
NP-b2neg
2.50 (2.10-2.92)
2.51
1.93 (1.54-2.52) [5]
2.47 (2.20-2.71) [6]
Results are expressed as aPC-FV ratios (time obtained in the presence of aPC divided by the time obtained in absence of aPC) and are given as
median value (range). Statistical analysis (Wilcoxon paired t-test): [1] v [2], [3] v [4], and [5] v [6]: P 5 .005; [1] v [3], [3] v [5], and [1] v [5]: P 5 .005. All
other comparisons were nonsignificant.
Abbreviations: NP, normal plasma; NP-b2neg, normal plasma after b2-glycoprotein I depletion; LA, positive lupus anticoagulant; aCLAb,
positive anticardiolipin IgG antibodies; ab2GP1Ab, positive anti–b2-glycoprotein I IgG antibodies; aFIIAb, positive antiprothrombin IgG
antibodies; aAnVAb, anti-annexin V IgG antibodies.
From www.bloodjournal.org by guest on January 12, 2015. For personal use only.
1998 92: 2989-2993
Interleukin-2 Receptor Subunit Expression and Function on Human
Peripheral T Cells Is Not Dependent on the Anticoagulant
Guido L. Vanham, Godelieve Penne, Chris Vereecken, Johan Vingerhoets and Luc Kestens
Updated information and services can be found at:
http://www.bloodjournal.org/content/92/8/2989.full.html
Articles on similar topics can be found in the following Blood collections
Information about reproducing this article in parts or in its entirety may be found online at:
http://www.bloodjournal.org/site/misc/rights.xhtml#repub_requests
Information about ordering reprints may be found online at:
http://www.bloodjournal.org/site/misc/rights.xhtml#reprints
Information about subscriptions and ASH membership may be found online at:
http://www.bloodjournal.org/site/subscriptions/index.xhtml
Blood (print ISSN 0006-4971, online ISSN 1528-0020), is published weekly by the American Society of
Hematology, 2021 L St, NW, Suite 900, Washington DC 20036.
Copyright 2011 by The American Society of Hematology; all rights reserved.


© Copyright 2026