
Cancer Facts & Figures for Hispanics/Latinos 2009-2011 Also available in Spanish
Cancer Facts & Figures for Hispanics/Latinos 2009-2011 Also available in Spanish For information, visit cancer.org/statistics. Contents Cancer Statistics 1 Selected Cancers 7 Cancer Sites with Higher Rates for Hispanics 10 Cancer in Children and Adolescents 13 Factors That Influence Health: Socioeconomic Status and Cultural Values and Beliefs 15 Risk Factors for Cancer 18 Cancer Screening Tests 24 Screening Guidelines 25 How the American Cancer Society Helps Save Lives and Reduce Cancer Disparities 27 Sources of Statistics 30 Factors That Influence Cancer Rates 31 References 32 Acknowledgments The production of this report would not be possible without the efforts of Priti Bandi, MS; Ermilo Barrera, MD; Carolina Casares, MD, MPH; Ronit Elk, PhD; Andy Lake; Brenda McNeal; Amelie Ramirez, DrPh; Erin Reidy, MA; Mona Shah, MPH; Scott Simpson; Kristen Sullivan, MS, MPH; and Ed Trapido, ScD; Dana Wagner. Cancer Facts & Figures for Hispanics/Latinos is a periodic publication of the American Cancer Society, Atlanta, Georgia. For more information contact: Rebecca Siegel, MPH Vilma Cokkinides, PhD, MSPH Ahmedin Jemal, DVM, PhD Elizabeth Ward, PhD Department of Surveillance and Health Policy Research This publication attempts to summarize current scientific information about cancer. Except when specified, it does not represent the official policy of the American Cancer Society. National Home Office: American Cancer Society, Inc., 250 Williams Street, NW, Atlanta, GA 30303-1002, (404) 320-3333 ©2009, American Cancer Society, Inc. All rights reserved, including the right to reproduce this publication or portions thereof in any form. For written permission, address the Legal Department of the American Cancer Society,250 Williams Street, NW, Atlanta, GA 30303-1002. Cancer Statistics Introduction According to the US Census Bureau, 45.5 million Americans, or 15% of the total US population, identified themselves as Hispanic or Latino in 2007. The terms “Hispanic” and “Latino/a” are used to refer to persons of Hispanic origin. The word Hispanic is a US federal designation, used in national and state reporting systems. Latino/a is a self-designated term of ethnicity. In this document, Hispanic and Latino/a are used interchangeably without preference or prejudice. Hispanics are the largest, fastest-growing, and youngest minority group. In 2007, the Hispanic median age was 27.6, compared to 36.6 in the US overall. Approximately 60% of Hispanics are born in the US, while the other 40% are foreign-born (not US citizens at birth). About 64% of Hispanics are of Mexican origin, followed by Puerto Rican (9.0%), Central American (7.6%), South American (5.5%), Cuban (3.4%), Dominican (2.8%), and other descent. Although persons of Hispanic origin may be of any race, about 97% of US Hispanics are white. The Hispanic population is not equally distributed across the US, but is concentrated in the West (43%) and South (35%) (Figure 1). Among states there is substantial variation in the Hispanic population by country of origin.1 For example, Mexican Americans comprise more than 75% of the Hispanic population in Texas and California, compared to only 14% in Florida. This report presents statistics on cancer incidence, mortality, survival, and risk factors for Hispanics in the US. All incidence and mortality rates have been age adjusted to the standard US population of the 2000 census in order to allow comparison between population groups with different age distributions. This publication is intended to provide information to community leaders, public health and health care workers, and others interested in cancer prevention, early detection, and treatment for Hispanics. It is important to note that most cancer data in the US are reported for Hispanics as an aggregate group, which masks important differences that exist between Hispanic subpopulations according to country of origin. For example, a study of Hispanics living in Florida found that the age-adjusted cancer death rate in Cuban men (327.5 per 100,000) was twice that in Mexican men (163.4 per 100,000).2 Figure 1. Hispanic Population Distribution, US, 2006 Hispanic or Latino population as a percent of total population by county 25.0 to 100 10.0 to 24.9 5.0 to 9.9 2.5 to 4.9 0 to 2.4 Source: U.S. Census Bureau, Population Estimates, July 1, 2006 Cancer Facts & Figures for Hispanics/Latinos 2009-2011 1 What Is Cancer? Cancer is a group of diseases characterized by uncontrolled growth and spread of abnormal cells. If the spread is not controlled, it can result in death. Cancer is caused by both external factors (tobacco, infectious organisms, poor nutrition, chemicals, and radiation) and internal factors (inherited mutations, hormones, immune conditions, and mutations that occur from metabolism). These causal factors may act together or in sequence to initiate or promote carcinogenesis. Ten or more years often pass between exposure to external factors and detectable cancer. Cancer is treated with surgery, radiation, chemotherapy, hormone therapy, biologic therapy, and targeted therapy. Can Cancer Be Prevented? All cancers caused by tobacco and heavy alcohol use could be prevented completely. Many of the cancers caused by external factors, such as infectious organisms, are also preventable. A large proportion of cancers of the colorectum could be prevented by avoiding risk factors such as obesity, physical inactivity, consumption of red and processed meat, and by detection and removal of precancerous lesions. The majority of cervical cancers could be prevented by vaccination against human papillomavirus, as well as detection and removal of precancerous cervical lesions. Screening can detect cancers of the breast, colorectum, cervix, oral cavity, and skin at an early stage when treatment is more likely to be successful. What Is the Risk of Developing or Dying of Cancer? Anyone can develop cancer. The risk of being diagnosed with cancer increases with age because most cancers require many years to develop (Table 1). Because the Hispanic population is young relative to whites, the median age at diagnosis is 62 years, compared to 68 years in whites. Overall, about 1 in 2 Hispanic men and 1 in 3 Hispanic women will be diagnosed with cancer in their lifetime. The lifetime probability of dying from cancer is 1 in 5 Hispanic men and about 1 in 6 Hispanic women. Cancer is the second leading cause of death among Hispanics, accounting for 20% of deaths overall and 13% of deaths in children. (Figure 2, Table 2). Table 1. Probability (%) of Developing Invasive Cancer among Hispanics Over Selected Age Intervals, US, 2004 to 2006* Birth to 39 40 to 59 60 to 69 70 and older Birth to death All sites† Male Female 1.15 (1 in 87) 1.72 (1 in 58) 5.92 (1 in 17) 7.16 (1 in 14) 12.33 (1 in 8) 7.85 (1 in 13) 36.04 (1 in 3) 24.19 (1 in 4) 40.58 (1 in 2) 33.64 (1 in 3) Breast Female 0.38 (1 in 261) 2.85 (1 in 35) 2.42 (1 in 41) 4.83 (1 in 21) 9.29 (1 in 11) Colon & rectum Male Female 0.06 (1 in 1,644) 0.06 (1 in 1,688) 0.77 (1 in 130) 0.61 (1 in 165) 1.32 (1 in 76) 0.84 (1 in 119) 4.35 (1 in 23) 3.54 (1 in 28) 5.21 (1 in 19) 4.43 (1 in 23) Liver & intrahepatic bile duct Male Female 0.02 (1 in 4,969) 0.01 (1 in 11,126) 0.43 (1 in 231) 0.10 (1 in 986) 0.49 (1 in 202) 0.20 (1 in 510) 1.05 (1 in 95) 0.68 (1 in 147) 1.67 (1 in 60) 0.87 (1 in 114) Lung & bronchus Male Female 0.01 (1 in 6,749) 0.02 (1 in 5,480) 0.40 (1 in 249) 0.34 (1 in 293) 1.21 (1 in 83) 0.78 (1 in 129) 4.89 (1 in 20) 2.83 (1 in 35) 5.17 (1 in 19) 3.49 (1 in 29) Melanoma Male Female 0.02 (1 in 4,522) 0.05 (1 in 1,844) 0.09 (1 in 1,101) 0.13 (1 in 793) 0.10 (1 in 996) 0.11 (1 in 948) 0.47 (1 in 214) 0.28 (1 in 357) 0.55 (1 in 181) 0.51 (1 in 194) Prostate Male <0.01 (1 in 20,462) 1.62 (1 in 62) 5.29 (1 in 19) 12.60 (1 in 8) 15.06 (1 in 7) Stomach Male Female 0.03 (1 in 3,807) 0.03 (1 in 3,342) 0.22 (1 in 451) 0.16 (1 in 612) 0.41 (1 in 245) 0.23 (1 in 441) 1.50 (1 in 67) 1.04 (1 in 96) 1.74 (1 in 58) 1.29 (1 in 78) Uterine cervix Female 0.18 (1 in 564) 0.41 (1 in 241) 0.24 (1 in 411) 0.42 (1 in 239) 1.16 (1 in 86) * For those free of cancer at beginning of age interval. † All sites excludes basal and squamous cell skin cancers and in situ cancers except urinary bladder. Source: DevCan: Probability of Developing or Dying of Cancer Software, Version 6.4.0 Statistical Research and Applications Branch, National Cancer Institute, 2009. srab.cancer.gov/devcan. American Cancer Society, Surveillance Research, 2009 2 Cancer Facts & Figures for Hispanics/Latinos 2009-2011 How Many New Cancer Cases and Deaths Are Expected in 2009? New cases: About 47,900 new cancer cases in men and 51,000 cases in women are expected to be diagnosed among Hispanics in 2009 (Figure 3). Prostate cancer is expected to be the most commonly diagnosed cancer in men and breast cancer the most common in women. Cancers of the colorectum and lung will be the secondand third-most commonly diagnosed cancers in both Hispanic men and women. The four most common cancers (breast, prostate, colorectal, and lung) account for almost half of all cancer cases among Hispanics. Deaths: About 14,400 Hispanic men and 14,400 Hispanic women are expected to die from cancer in 2009 (Figure 3). Among men, lung cancer is expected to account for about 22% of the total, followed by colorectal (11%) and liver (11%) cancers. Among women, breast cancer is the leading cause of cancer death (15% of the total), followed by cancers of the lung (13%) and colorectum Figure 2. Leading Causes of Death in Hispanics, All Ages, 2006 Heart disease 22% All other causes combined 39% Cancer 20% Diabetes 5% Accidents 9% Cerebrovascular disease 5% Source: US Mortality Data, 2006, National Center for Health Statistics, Centers for Disease Control and Prevention, 2009. American Cancer Society, Surveillance Research, 2009 Figure 3. Leading Sites of New Cancer Cases and Deaths among Hispanics, 2009 Estimates* Estimated Deaths Estimated New Cases Male Female Male Female Prostate 11,300 (24%) Breast 14,200 (28%) Lung & bronchus 3,100 (22%) Breast 2,200 (15%) Colon & rectum 5,500 (12%) Colon & rectum 4,900 (10%) Colon & rectum 1,600 (11%) Lung & bronchus 1,900 (13%) Lung & bronchus 4,800 (10%) Lung & bronchus 3,600 (7%) Liver & intrahepatic bile duct 1,600 (11%) Colon & rectum 1,500 (10%) Non-Hodgkin lymphoma 2,700 (6%) Thyroid 3,500 (7%) Prostate 1,500 (10%) Pancreas 1,100 (7%) Kidney & renal pelvis 2,600 (5%) Uterine corpus 3,300 (6%) Pancreas 1,100 (7%) Ovary 900 (6%) Urinary bladder 2,200 (5%) Non-Hodgkin lymphoma 2,300 (5%) Leukemia 800 (6%) Liver & intrahepatic bile duct 800 (5%) Liver & intrahepatic bile duct 2,200 (5%) Uterine cervix 2,000 (4%) Stomach 700 (5%) Stomach 700 (5%) Leukemia 1,800 (4%) Ovary 1,800 (3%) Non-Hodgkin lymphoma 600 (4%) Leukemia 600 (4%) Stomach 1,600 (3%) Kidney & renal pelvis 1,500 (3%) Kidney & renal pelvis 500 (3%) Non-Hodgkin lymphoma 500 (4%) Oral cavity & pharynx 1,400 (3%) Pancreas 1,400 (3%) Brain & other nervous system 500 (3%) Uterine cervix 500 (3%) All sites 47,900 (100%) All sites 51,000 (100%) All sites 14,400 (100%) All sites 14,400 (100%) * Excludes basal and squamous cell skin cancers and in situ carcinoma except urinary bladder. ©2009, American Cancer Society, Surveillance Research Cancer Facts & Figures for Hispanics/Latinos 2009-2011 3 Figure 4. Trends in Incidence and Death Rates for All Cancers Combined among Hispanics* 1992-2006 How Have Cancer Rates Changed Over Time? 500 Incidence, male Trends in cancer incidence rates: Cancer incidence rates for Hispanics have been available since 1992. In examining 10-year trends (1997-2006), incidence rates for all cancers combined among Hispanic men decreased by an average of 1.3% per year (Figure 4), a larger decrease than among non-Hispanic white men (0.8% per year). Over the same time interval, incidence rates for all cancers combined decreased 0.6% per year among Hispanic women and 0.4% per year among nonHispanic white women. 400 Incidence, female 300 Mortality, male 200 100 0 Mortality, female 1992 1994 1996 (10%). In contrast, the leading cause of cancer death in non-Hispanic women is lung cancer. 1998 2000 2002 2004 2006 Year *Persons of Hispanic/Latino origin may be any race. Source: Incidence – Surveillance, Epidemiology, and End Results (SEER) Program, SEER 13 areas, excluding the Alaska Native Registry, National Cancer Institute, 2009. Data for Hispanics are based on the NAACCR Hispanic Identification Algorithm (NHIA). Mortality – National Center for Health Statistics, Centers for Disease Control and Prevention, 2009. Data were excluded from Connecticut, Maine, Maryland, Minnesota, New Hampshire, New York, North Dakota, Oklahoma, and Vermont due to a large number of individuals with unknown origin/ethnicity. Trends in cancer death rates: Death rates for all cancers combined decreased during the interval 1997-2006 by an average of 2.2% per year among Hispanic men and by 1.2% per year among Hispanic women. The average annual decrease in non-Hispanic whites over the same time interval was 1.5% in men and 0.9% in women. Table 2. Leading Causes of Death Among Hispanics and Non-Hispanic Whites, US, 2006 All ages Heart diseases Cancer Accidents (unintentional injuries) Cerebrovascular diseases Diabetes All causes Children ages 1-14 Accidents Cancer Congenital anomalies (birth defects) Assault (homicide) Heart diseases All causes Hispanic Number of deaths Non-Hispanic White Percent of total deaths Death rate* Number of deaths Percent of total deaths Death rate* 28,921 26,633 12,052 7,005 6,287 133,004 21.7 20.0 9.1 5.3 4.7 100.0 144.1 118.0 31.5 34.2 29.9 564.0 516,883 455,978 91,830 108,886 50,950 1,944,617 26.6 23.4 4.7 5.6 2.6 100.0 200.3 184.6 42.1 41.9 20.4 777.0 773 265 186 157 76 2,124 36.4 12.5 8.8 7.4 3.6 100.0 6.6 2.3 1.6 1.3 0.6 18.1 2,081 749 451 267 207 5,632 36.9 13.3 8.0 4.7 3.7 100.0 6.3 2.3 1.4 0.8 0.6 17.1 * Rates are per 100,000 and age adjusted to the 2000 US standard population. Source: US Mortality Data, 2006, National Center for Health Statistics, Centers for Disease Control and Prevention, 2009. 4 Cancer Facts & Figures for Hispanics/Latinos 2009-2011 What Are the Major Differences in Cancer Burden between Hispanics and Non-Hispanic Whites? Incidence and death rates: Table 3 shows differences in cancer incidence and death rates between Hispanics and non-Hispanic whites in the US. For all cancers combined, and for the most common cancers (prostate, female breast, colorectal, and lung), incidence and death rates are lower among Hispanics than among non-Hispanic whites. Cancers for which rates are higher in Hispanics include stomach, cervix, liver, acute lymphocytic leukemia, and gallbladder. Trends in cancer incidence and death rates among Hispanics for specific cancer sites are shown in Figure 5. It is important to reiterate that statistics reported for Hispanics may mask wide variations in the cancer burden for specific populations according to country of origin. The cancer burden among Hispanics living in the US is generally similar to that seen in the countries of origin for which data are available. Compared to rates in the US, incidence of breast, colorectal, lung, and prostate cancers are lower in Puerto Rico, Cuba, and Central and South America, whereas incidence rates of cervical, liver, and stomach cancers are higher.3 There is some evidence that descendents of Hispanic migrants have cancer rates that approach those of non-Hispanic whites due to acculturation.4-6 The term “acculturation” refers to the process by which immigrants adopt the attitudes, values, customs, beliefs, and behaviors of their new culture. Among Hispanic immigrants to the US, these changes may include increases in smoking, obesity, and alcohol intake and decreases in dietary quality and physical activity.7 One study found that overall cancer death rates among Hispanics were 22% higher among those who were US-born compared to those who were foreign-born.8 Stage distribution and survival: Stage of disease describes the extent or spread of the cancer at the time of diagnosis. Local stage describes a malignant cancer that is confined to the organ of origin. A cancer that is diagnosed at a regional stage has spread from its original site into surrounding organs, tissues, or nearby lymph nodes. Distant-stage cancer has spread to distant organs. In general, the further a cancer has spread, the less likely that treatment will be effective. Although Hispanics have lower incidence and death rates than non-Hispanic whites for the most common cancers, they are more likely to be diagnosed with a more advanced stage of disease (Figure 6). Table 3. Cancer Incidence and Mortality Rates* and Ratios Comparing Hispanics to Non-Hispanic Whites, 2002-2006 Incidence Mortality Male Hispanic Female Non-Hispanic Ratio† Hispanic White All sites 430.3 562.1 0.8 326.8 429.5 Prostate 131.1 148.2 0.9 – – – – – 90.2 Colon & rectum 50.0 58.9 0.8 Lung & bronchus 49.2 89.1 Stomach 14.3 8.4 – – Female breast Uterine cervix – Male Female Non-Hispanic Ratio† Hispanic Non-Hispanic Ratio† Hispanic White White Non-Hispanic White Ratio† 0.6 0.8 All sites 155.2 231.5 0.7 104.0 160.7 – Prostate 19.8 23.8 0.8 – – 126.9 0.7 Female breast – – – 15.6 24.4 0.6 35.1 43.2 0.8 Colon & rectum 16.1 21.7 0.7 10.7 15.1 0.7 0.6 26.5 59.9 0.4 Lung & bronchus 34.0 72.6 0.5 14.5 44.0 0.3 1.7 8.6 3.8 2.3 Stomach 8.3 4.5 1.8 4.8 2.2 2.2 12.7 7.3 1.8 Uterine cervix – – – 3.1 2.1 1.5 – Liver‡ 15.9 7.2 2.2 6.2 2.5 2.5 Liver 11.3 6.4 1.8 5.2 2.8 1.9 Thyroid 3.8 5.4 0.7 13.8 15.1 0.9 Thyroid 0.6 0.5 1.2 0.6 0.5 1.3 ‡ Acute lympho- cytic leukemia 2.4 1.7 1.4 1.9 1.2 1.6 Acute lympho- cytic leukemia 0.8 0.6 1.4 0.6 0.4 1.7 Gallbladder Gallbladder 1.8 1.3 0.7 1.8 2.8 1.2 2.4 0.6 0.4 1.5 1.3 0.7 * Rates are per 100,000 and age adjusted to the 2000 US standard population. † Ratio is the unrounded Hispanic rate divided by the corresponding unrounded Non-Hispanic white rate. ‡ Includes intrahepatic bile duct Note: Persons of Hispanic origin may be of any race. Data Source: Incidence: North American Association of Central Cancer Registries Combined Incidence 2002-2006, 2009. Incidence data for Hispanics and Non-Hispanic Whites are based on the NAACCR Hispanic Identification Algorithm (NHIA) and exclude cases from the Alaska Native Registry. Mortality: National Center for Health Statistics, Centers for Disease Control and Prevention, 2009. Cancer Facts & Figures for Hispanics/Latinos 2009-2011 5 Figure 5. Cancer Incidence and Death Rates in Hispanics* by Site, 1992-2006 180 Male incidence 180 160 Female incidence 160 Rate per 100,000 Prostate 140 140 120 120 100 100 80 80 Breast 60 Lung & bronchus 40 60 40 Colon & rectum Lung & bronchus Colon & rectum Uterine cervix Stomach Stomach 20 20 Liver† 0 50 1992 Rate per 100,000 1996 1998 2000 2002 2004 2006 Male mortality 30 0 50 Lung & bronchus 40 20 1994 Liver† 1992 1994 1996 1998 2000 2002 2004 2006 Female mortality 40 30 Prostate Colon & rectum Breast 20 Lung & bronchus Stomach 10 10 Liver† Colon & rectum Liver† Stomach Uterine cervix 0 1992 1994 1996 1998 2000 2002 2004 2006 Year 0 1992 1994 1996 1998 2000 2002 2004 2006 Year *Persons of Hispanic/Latino origin may be of any race. †Liver includes intrahepatic bile duct. Source: Incidence – Surveillance, Epidemiology, and End Results (SEER) Program, SEER 13 areas, excluding the Alaska Native Registry, National Cancer Institute, 2009. Data for Hispanics are based on the NAACCR Hispanic Identification Algorithm (NHIA). Mortality – National Center for Health Statistics, Centers for Disease Control and Prevention, 2009. Data were excluded from Connecticut, Maine, Maryland, Minnesota, New Hampshire, New York, North Dakota, Oklahoma, and Vermont due to a large number of individuals with unknown origin/ethnicity. Survival rates indicate the percentage of patients who are alive after a given time period following a cancer diagnosis. The most commonly used survival measure for the general population is relative survival, which is the ratio of observed survival in a group of cancer patients divided by the expected survival in a 6 Cancer Facts & Figures for Hispanics/Latinos 2009-2011 comparable group of cancer-free individuals. Because expected survival data are not available for Hispanics, an alternative measure – cause-specific survival – is used. Cause-specific survival is the probability of surviving a specific disease within a certain time period (usually 5 years) after diagnosis. Figure 6. Stage Distribution for Selected Cancers in Hispanics* and Non-Hispanic Whites, 2002-2006 Stage distribution (%) 100 100 Lung & bronchus 90 90 80 80 80 70 70 70 60 60 59 60 52 50 50 40 40 30 20 13 17 19 0 9 Localized 100 Regional Distant 9 Unstaged 80 60 63 38 Regional Unstaged 10 5 Regional 5 Distant 2 2 Unstaged 0 80 80 70 70 12 5 Localized 100 Uterine cervix 90 Regional 4 Distant 4 3 Unstaged Melanoma of the skin 84 73 60 47 48 50 38 40 34 30 10 10 0 12 10 90 20 Localized Distant 6 30 20 0 20 6 40 30 Hispanic Non-Hispanic white 30 20 18 Localized 78 40 10 50 30 36 20 0 Prostate 81 50 37 60 55 50 40 41 100 Female breast 90 70 37 30 22 10 Stage distribution (%) 100 Colon & rectum 90 Localized Regional 20 12 Distant 4 5 Unstaged 14 10 0 Localized 8 Regional 7 4 Distant 6 4 Unstaged Note: Percentages may not total 100 due to rounding. *Persons of Hispanic/Latino origin may be of any race. Incidence data for Hispanics are based on the Hispanic Identification Algorithm (NHIA) and exclude cases from the Alaska Native Registry. Data Source: Surveillance, Epidemiology, and End Results (SEER) Program, 17 SEER registries, Division of Cancer Control and Population Sciences, National Cancer Institute, 2009. Cancer survival rates are generally similar among Hispanics and non-Hispanic whites. Of those cancer sites listed in Table 4, the largest difference in survival is for melanoma; among men, 86.5% of non-Hispanic whites, but only 78.6% of Hispanics survive five years after diagnosis. This survival disparity may be due to a higher proportion of thicker tumors and later stage at diagnosis among Hispanics.9 Differences in survival rates may reflect later stage at diagnosis, less access to timely, high-quality treatment, and differences in tumor biology. Selected Cancers Female Breast New cases: Breast cancer is the most commonly diagnosed cancer among Hispanic women; an estimated 14,200 Hispanic women are expected to be diagnosed in 2009. Since 1997, breast cancer incidence rates have decreased 1.5% per year among non-Hispanic white women and 0.9% per year among Hispanic women. Some of the factors that increase risk of breast cancer are not modifiable, such as age, family history, early menarche, and late menopause. Other factors are potentially modifiable, such as postmenopausal obesity, use of postmenopausal hormones, alcohol consumption, and physical inactivity.10 Studies examining body size and weight change in relation to breast cancer risk in Hispanic and non-Hispanic white women indicate that the associations between body mass and breast cancer may differ by ethnicity.11-13 The breast cancer incidence Cancer Facts & Figures for Hispanics/Latinos 2009-2011 7 Table 4. Five-year Cancer-specific Survival Rates* (%), 1999-2005 Hispanic Non-Hispanic White Male All sites Prostate Lung & bronchus Colon & rectum Stomach Liver & intrahepatic bile duct Melanoma of the skin 63.7 92.3 13.5 62.3 24.7 13.8 78.6 65.6 93.5 14.9 65.0 23.1 14.7 86.5 Female All sites Breast Colon & rectum Lung & bronchus Uterine cervix Stomach Liver & intrahepatic bile duct Melanoma of the skin 66.4 85.8 63.2 17.4 75.9 26.2 17.4 87.9 65.4 88.5 63.7 19.5 72.3 27.7 13.6 92.1 * Rates are based on cases diagnosed in the SEER 17 areas from 1999-2005, followed through 2006. rate in Hispanic women is 27% lower than that in nonHispanic white women (Table 3). It has been estimated that about 7% of this difference may be explained by more protective reproductive patterns (lower age at first birth and larger number of children) among Hispanic women.14, 15 It may also reflect less use of hormone replacement therapy and under-diagnosis due to lower utilization of mammography.16, 17 Recent studies suggest that ethnic variation in genetic factors that influence breast cancer development may also contribute to some of the difference.18-20 Modifiable factors associated with a decreased risk of breast cancer in postmenopausal women include maintaining a healthy body weight, engaging in moderate or vigorous physical activity, and breast-feeding.10 Deaths: An estimated 2,200 deaths from breast cancer are expected to occur among Hispanic women in 2009. Breast cancer is the leading cause of cancer death among Hispanic women. During the period from 1997 to 2006, breast cancer death rates decreased by about 2% per year among both Hispanic and non-Hispanic white women. Stage distribution and survival: Breast cancer is less likely to be diagnosed at the earliest stage in Hispanic women compared to non-Hispanic white women even after differences in age, socioeconomic status, 8 Cancer Facts & Figures for Hispanics/Latinos 2009-2011 and method of detection are controlled (Figure 6).21 For example, during the period 2002-2006, 55% of breast cancers among Hispanic women were diagnosed at the local stage, compared to 63% of cases among non-Hispanic white women. Hispanic women are also more likely to be diagnosed with larger breast tumors than non-Hispanic white women.22, 23 Differences in mammography utilization and delayed follow-up of abnormal screening results may contribute to this difference.24, 25 Hispanic women are about 20% more likely to die of breast cancer than non-Hispanic white women diagnosed at a similar age and stage.26 Differences in access to care and treatment likely contribute to this disparity.27, 28 Intervention programs that follow patients throughout treatment in order to enhance communication between the surgeon, oncologist, and patient have been shown to reduce disparities in breast cancer care.29 Colon & Rectum New cases: An estimated 5,500 Hispanic men and 4,900 Hispanic women are expected to be diagnosed with cancer of the colon or rectum in 2009. Colorectal cancer is the second most commonly diagnosed cancer in both Hispanic men and women. Colorectal cancer incidence rates among Hispanic men and women are 15% and 19% lower, respectively, than those among non-Hispanic whites (Table 3). However, the rates among Hispanics in the US are higher than those among residents of Puerto Rico and Spanish-speaking countries in South and Central America.3, 30 Colorectal cancer is rare in developing countries but common in affluent countries, where diets tend to be higher in fat, refined carbohydrates, and animal protein and levels of physical activity are low. For example, compared to colorectal cancer incidence rates among men living in Puerto Rico, rates among men living in the US are 8% higher among Hispanics and 45% higher among non-Hispanic whites.30 Factors that increase risk for colorectal cancer include a personal or family history of polyps or colorectal cancer, chronic inflammatory bowel disease, inherited syndromes, obesity, diabetes, consumption of red and processed meat, and alcohol consumption.31 Factors that protect against colorectal cancer include occupational or recreational physical activity, use of anti-inflammatory drugs, milk and calcium consumption, and screening, through the detection and removal of polyps before they develop into cancer.31 Colorectal cancer incidence rates decreased 1.7% per year in Hispanic men and 0.4% per year in Hispanic women from 1997 through 2006.32 Deaths: About 1,600 Hispanic men and 1,500 Hispanic women are expected to die from colorectal cancer in 2009. Colorectal cancer is the second-leading cause of cancer death among Hispanic men and the thirdleading cause of cancer death among Hispanic women. Between 1997 and 2006, death rates for colorectal cancer decreased by 2.2% per year in Hispanic men and by 1.2% per year in Hispanic women. Stage distribution and survival: Colorectal cancer can be treated successfully if caught early. The 5-year relative survival rate for colorectal cancers diagnosed at a localized stage is 91%; survival drops to 70% and 11% for those diagnosed at a regional and distant stage, respectively.32 Only 4 out of 10 patients have localized disease at diagnosis. Hispanics are more likely to be diagnosed with advanced stage colorectal cancer than non-Hispanic whites (Figure 6) and have a lower probability of survival after diagnosis after accounting for differences in age and stage.26 Factors that may contribute to survival disparities include less access to and lower use of colorectal cancer screening tests and less access to timely and high-quality treatment. Hispanics have lower colorectal cancer screening rates than any other minority group in the US.24 Lung & Bronchus New cases: About 4,800 Hispanic men and 3,600 Hispanic women are expected to be diagnosed with lung cancer in 2009. Lung cancer is the third-most commonly diagnosed cancer in both Hispanic men and women. Cigarette smoking is the major risk factor for lung cancer, accounting for about 87% and 70% of the cases in men and women, respectively.33 Lung cancer rates among Hispanics are about half those in nonHispanic whites because of traditionally lower rates of cigarette smoking and because Hispanics who do smoke are less likely to be daily smokers (Table 3). From 1997 to 2006, lung cancer incidence rates declined faster in Hispanic men (2.5% per year) than non-Hispanic white men (1.6% per year). Among women during this time period, in contrast to slightly increasing rates in non-Hispanic whites (0.4% per year), rates were stable in Hispanics. The larger declines in lung cancer rates in Hispanic men and plateauing rates among Hispanic women may reflect the arrival of immigrants who are more likely to be nonsmokers. Deaths: About 3,100 lung cancer deaths in men and 1,900 deaths in women are expected to occur among Hispanics in 2009. Lung cancer is the leading cause of cancer death among Hispanic men and the second-leading cause among Hispanic women. Lung cancer death rates within Hispanic subpopulations vary according to historic differences in smoking patterns. From 1997 to 2006, death rates for lung cancer declined by 3.1% per year among Hispanic men and by 0.8% per year among Hispanic women. During the same time interval, lung cancer death rates among non-Hispanic whites decreased in men (1.6% per year) and were stable in women. The decline in death rates among men reflects a reduction in the prevalence of smoking over the past 30 years. Lung cancer death rates have yet to decrease among women because the smoking patterns of US women lag about 20 years behind those of men. Most cases of lung cancer could be prevented by decreasing initiation of smoking among adolescents and by increasing cessation among adult smokers. Within 10 years of cessation, the risk of lung cancer in former smokers is 30% to 50% lower than that of continuing smokers.34 Stage distribution and survival: Most patients with lung cancer are diagnosed at an advanced stage; only 13% of Hispanic lung cancer patients and 17% of nonHispanic white lung cancer patients are diagnosed with localized disease (Figure 6). The 5-year relative survival rate for all lung cancer patients diagnosed at localized stage is 53%. Survival decreases to 24% for patients diagnosed with regional stage and to 4% for those with distant-stage tumors. Tests such as low-dose spiral computed tomography (CT) scans and molecular markers in sputum have produced promising results in detecting lung cancers at earlier, more operable stages in high-risk patients, but have not yet been shown to reduce lung cancer deaths. The risks and benefits of screening individuals at high risk for lung cancer are currently under study. Prostate New cases: An estimated 11,300 Hispanic men are expected to be diagnosed with prostate cancer in 2009, making it the most commonly diagnosed cancer among Hispanic men. In 2002-2006, the prostate cancer rate among Hispanics was about 12% lower than the rate among non-Hispanic whites. Prostate cancer incidence rates decreased 1.8% per year in Hispanic men and 1.6% per year in non-Hispanic white men from 1997 through 2006. Cancer Facts & Figures for Hispanics/Latinos 2009-2011 9 Deaths: An estimated 1,500 deaths from prostate cancer are expected among Hispanic men in 2009, making prostate cancer the fourth-leading cause of cancer death. The prostate cancer death rate is slightly lower in Hispanic men (19.8 per 100,000) than in non-Hispanic white men (23.8 per 100,000) (Table 3). From 1997 to 2006, the death rate decreased by 3.6% per year on average in Hispanic men and by 3.9% per year in non-Hispanic white men. This decrease may reflect improvements in treatment. Stage distribution and survival: About 80% of prostate cancers are discovered at a localized stage (Figure 6). The 5-year relative survival rate for patients diagnosed at these stages approaches 100%.32 The survival rate for those diagnosed at a distant stage is about 31%. Hispanic men are more likely to die from prostate cancer than non-Hispanic whites even after accounting for differences in age and stage at diagnosis.26 This may reflect a lower likelihood of timely, high-quality treatment in Hispanic men. Inadequate monitoring during active surveillance (watchful waiting) in older Hispanic patients may also contribute to this survival disparity.35 Cancer Sites with Higher Rates for Hispanics Cancers of the stomach, liver, and uterine cervix, all of which are related to infectious agents, are more common in developing countries, especially in Central and South American countries and parts of Asia. In the US, the incidence and mortality rates of these cancers are higher among Hispanics than non-Hispanic whites, especially among first-generation immigrants to the US.5, 36 Stomach In 2009, approximately 2,600 Hispanics will be diagnosed with stomach cancer, and an estimated 1,400 will die from the disease. In the US, stomach cancer incidence rates are at least 70% higher in Hispanics than in non-Hispanic whites (Table 3). Incidence rates among Hispanics decreased by 3.2% per year in men and by 1.4% per year in women between 1997 and 2006. Hispanics are diagnosed with stomach cancer at a young age (< 50 years) more often than any other racial or ethnic group.37 The 5-year survival rate for stomach cancer in Hispanics is about 25% (Table 4). Stomach cancer is more common throughout Mexico, Central and South America, and Asia than in the US (Figure 7). Although chronic infection with Helicobacter pylori (H. pylori) is the strongest identified risk factor for stomach cancer, only 5% of infected individuals will develop the disease.38 The prevalence of H. pylori infection is higher in low-income than high-income countries and among individuals of lower socioeconomic status, particularly within crowded living conditions.39 In the US, infection rates among Hispanics 10 Cancer Facts & Figures for Hispanics/Latinos 2009-2011 are two to three times those in whites.40 The source of H. pylori infection and how the bacteria are spread is unknown for certain, though transmission from person to person through fecal-oral and oral-oral routes are the most likely. Additional risk factors for stomach cancer include high consumption of salt and salted foods; grilled or barbecued meat and fish; and starch. Many studies have shown that a diet high in vegetables and fruits is protective against the disease.38 Liver and Intrahepatic Bile Duct In 2009, approximately 3,100 Hispanics will be diagnosed with liver cancer, and about 2,400 will die from the disease. Incidence rates for liver cancer among Hispanics increased 3.1% per year in men and 2.5% per year in women from 1997 to 2006. Liver cancer incidence rates in the US are highest among Asian American/Pacific Islanders, followed by Hispanics, American Indian/Alaska Natives, African Americans, and nonHispanic whites.22 The 5-year survival rate for liver cancer among Hispanics is 14% in men and 17% in women (Table 4). The majority of liver cancers worldwide are attributed to chronic infections with hepatitis B virus (HBV) or hepatitis C virus (HCV).41 HBV is preventable through vaccination, and although there is not yet a vaccine for HCV, its transmission is largely preventable through public health measures, such as needle/syringe exchange programs and screening of blood, organ, tissue, and semen donors.42 National survey data for 1999-2002 found that Figure 7. Age-standardized Incidence Rates for Stomach Cancer, 2002 Male Cases per 100,000 23.6-69.6 13.1-23.5 8.2-13.0 5.3-8.1 3.0-5.2 0.6-2.9 No data Female Source: Ferlay, et al., GLOBOCAN 2002.2 Cancer Facts & Figures for Hispanics/Latinos 2009-2011 11 the prevalence of HCV infection among Mexican Americans was comparable to that in non-Hispanic whites and about half that in non-Hispanic blacks.43 In the US, vaccination against HBV is recommended for all newborns, for all children under age 18 who have not been vaccinated, and for adult members of high-risk groups (intravenous drug users, persons with multiple sexual partners, and health care workers). Alcohol intake and aflatoxin (a contaminant found in moldy grains and meals) are also risk factors for liver cancer.42 Treatment of liver disease in people with HBV or HCV infection may reduce the risk of developing liver cancer.44 Uterine Cervix In 2009, 2,000 Hispanic women in the US will be diagnosed with cervical cancer and 500 will die from the disease. Women in Mexico and Central and South America experience approximately triple the cervical cancer incidence and mortality rates of women in the US due to lack of access to screening in these countries.45, 46 Overall, cervical cancer incidence rates among Hispanic women residing in the US are about 70% higher than those in non-Hispanic whites. A recent geographic analysis found that Hispanic women experience the highest cervical cancer incidence rates of any racial/ethnic group in every region of the US.47 The highest rates were found among Hispanic women in the Midwest, likely due to larger numbers of new immigrants in this region. Cervical cancer is one of only two cancers (colorectal is the other) that can actually be prevented through screening. The Pap test, the most common screening test for cervical cancer, is a simple procedure in which a small sample of cells is collected from the cervix and examined under a microscope. In addition to detecting cancer early, when treatment is more successful, precancerous lesions detected through Pap screening can be removed before they develop into cancer. Fortunately, most cervical precancers are slow-growing, so nearly all cases could be prevented with regular screening. For more information on screening for cervical cancer, see page 25. The primary cause of cervical cancer is infection with certain types of human papillomavirus (HPV).48 Among Mexican women in the US, those born in Mexico have a higher prevalence of HPV infection.49 Population-based 12 Cancer Facts & Figures for Hispanics/Latinos 2009-2011 survey data for 2003-2004 showed that the prevalence of HPV infection among women (ages 14 to 59 years) was similar among Mexican Americans and non-Hispanic whites (24%) and highest among non-Hispanic blacks (39%).50 The first vaccine developed to prevent the most common HPV infections that cause cervical cancer, Gardasil, has been approved for use in females ages 9 to 26 years by the US Food and Drug Administration (FDA).48 Another vaccine, Cervarix, has been approved for use in many countries and is currently awaiting FDA approval. The death rate for cervical cancer among Hispanic women is almost 50% higher than that in non-Hispanic whites (Table 3). Low rates of screening and poor adherence to recommended diagnostic follow-up after an abnormal Pap test are thought to contribute to the higher mortality among Hispanic women.51 It has been estimated that as many as 80% of deaths from cervical cancer could be prevented by regular Pap screening coupled with adequate patient follow-up for treatment.52 Gallbladder Gallbladder cancer is relatively rare, has nonspecific symptoms that typically result in a late stage at diagnosis, and has very poor survival – only about 10% of patients survive 5 years.53 It is one of the few cancers that occurs more often in women than in men. In the US, Hispanic women have higher incidence rates than any other racial/ethnic group; an estimated 400 Hispanic women will be diagnosed with cancer of the gallbladder in 2009.54 Incidence rates of gallbladder cancer among Hispanics in the US decreased 3.2% per year in men and 2.8% per year in women between 1997 and 2006. Hispanic women living in California and New Mexico have the highest gallbladder cancer incidence, with rates 3- to 5-fold those of non-Hispanic white women living in the same area.53 There is wide variation in worldwide incidence; populations with the highest risk of gallbladder cancer are found in Latin America and Asia.53 A history of gallstones is the strongest risk factor for gallbladder cancer, although less than 1% of individuals with gallstones will develop this cancer.53, 55 Other established risk factors for gallbladder cancer include chronic inflammation and infection of the biliary tract and obesity.53, 55, 56 Cancer in Children and Adolescents Cancer is a relatively rare disease in children (0-14 years) and adolescents (15-19 years). The types of cancer that commonly occur in children are different from those that commonly occur in adults. Unlike many adult cancers, for which tobacco use, overweight and obesity, and physical inactivity are known preventable causes, cancer in childhood and adolescence is not well understood. Some causes of childhood cancers include genetic changes that can be passed down from parent to child, radiation exposure, and infections with certain viruses. For reasons that are not clearly understood, some childhood cancers are more common in developed countries while others are more common in developing countries. New cases: It is estimated that about 2,300 Hispanic children (ages 0-14 years) in the US will be diagnosed with cancer in 2009, accounting for about 2.3% of the total cancer cases in Hispanics. In contrast, childhood cancer accounts for 0.7% of new cancer cases in the total US population. The difference arises in part because the Hispanic population is younger – children account for almost 34% of the US Hispanic population, compared to 25% of the total US population.57 Leukemia is the most common cancer in Hispanic children, followed by cancers of the brain/central nervous system and lymphoma (Table 5). Childhood cancers with higher rates in Hispanics than non-Hispanic whites include leukemia, bone tumors (osteosarcomas), and germ cell tumors. However, for all cancers combined, incidence rates are lower in Hispanics than non-Hispanic whites in both children and adolescents. Figure 8 shows differences in the major types of childhood cancer by race/ethnicity. Compared to other population groups, Hispanic children have the highest rates of leukemia, Table 5. Childhood Cancer Incidence Rates* and Ratios Comparing Hispanics to Non-Hispanic Whites, 2002-2006 Age 0-14 years Hispanic All sites combined Leukemia Lymphoid leukemia Acute myeloid leukemia Brain & central nervous system Lymphoma Non-Hodgkin lymphoma (except Burkitt lymphoma) Hodgkin lymphoma Burkitt lymphoma Soft-tissue sarcomas Bone tumors Osteosarcoma Germ cell Malignant gonadal germ cell tumor Intracranial & intraspinal germ cell tumor Neuroblastoma Renal tumors Retinoblastoma Hepatic tumors 155.3 59.4 46.7 8.0 27.6 16.5 6.4 6.1 2.0 11.1 7.5 4.8 6.7 3.5 1.7 7.1 6.3 4.6 2.7 Age 15-19 years Non-Hispanic White Ratio† Hispanic 160.0 48.9 37.7 7.1 36.3 16.3 6.4 5.7 3.1 10.5 6.8 3.3 5.3 2.0 1.4 12.7 8.7 3.2 2.4 1.0 1.2 1.2 1.1 0.8 1.0 1.0 1.1 0.7 1.1 1.1 1.5 1.3 1.7 1.2 0.6 0.7 1.4 1.1 209.0 44.5 26.3 11.6 18.5 43.1 14.4 25.8 2.0 14.5 15.8 9.9 35.7 27.9 2.0 ‡ ‡ ‡ 1.4 Non-Hispanic White Ratio† 230.8 29.1 15.1 8.5 24.2 54.4 14.5 36.8 2.5 15.9 15.9 8.5 27.9 22.9 2.4 0.8 1.6 ‡ 1.1 0.9 1.5 1.7 1.4 0.8 0.8 1.0 0.7 0.8 0.9 1.0 1.2 1.3 1.2 0.9 – – – 1.2 * Rates are per 100,000 and age adjusted to the 2000 US standard population. (age adjusted) † Ratios are calculated as Hispanic incidence rate divided by Non-Hispanic white incidence rate. ‡ Data suppressed due to fewer than 16 cases during 2002-2006 Note: Persons of Hispanic/Latino origin may be of any race. Data Source: North American Association of Central Cancer Registries Combined Incidence 2002-2006, 2009. ©2009, American Cancer Society, Surveillance and Health Policy Research Cancer Facts & Figures for Hispanics/Latinos 2009-2011 13 double those of African American children who experience the lowest rates. The higher rates of leukemia in Hispanic children are driven by acute lymphocytic leukemia, for which Hispanics of all ages experience a higher incidence.58, 59 Deaths: Although childhood cancer is rare, it is the second-leading cause of death among Hispanic children and the fourth-leading cause of death among adolescents. It is estimated that about 400 Hispanic children will die from cancer in 2009. Trends in incidence and death rates: From 1992 to 2006, incidence and death rates for all cancers combined changed very little among Hispanic girls and boys. However, melanoma incidence rates increased by 7.5% per year from 1992 through 2004 among Hispanic children and adolescents.60 Early detection: Childhood cancers are difficult to recognize. Parents should ensure that children have regular medical checkups and be alert to any unusual signs or symptoms that persist. These include an unusual mass or swelling; an unexplained paleness and loss of energy; a sudden tendency to bruise; a persistent, localized pain or limping; a prolonged, unexplained fever or illness; frequent headaches, often with vomiting; sudden eye or vision changes; and an excessive, rapid weight loss. Survival: Over the past 30 years, there have been significant improvements in 5-year relative survival rates for many childhood cancers, including non-Hodgkin lymphoma, acute lymphocytic leukemia, acute myeloid leukemia, and Wilms’ tumor. The 5-year relative survival rate for all cancers combined among children of all races and ethnicities improved from 58% for cases diagnosed in 1975-1977 to 81% for those diagnosed in 1999-2005.32 The substantial progress in pediatric cancer survival rates is largely attributable to significant advances in treatment and the high proportion of patients participating in clinical trials. However, Hispanic children have poorer survival than white children for many common childhood cancers, possibly as a result of less access to treatment. For example, relative 5-year survival rates for patients diagnosed from 1995 through 1999 were 74% in Hispanic children/adolescents and 81% in non-Hispanic whites.61 Treatment for childhood cancer depends on the type and stage of disease and involves a team that includes pediatric oncologists, nurses, social workers, psychologists, and others who assist children and their families. Selected Cancers Leukemia: Leukemia is a condition in which too many underdeveloped white blood cells are found in the blood and bone marrow. It is the most common cancer in children and young adults, representing about one-third Figure 8. Comparison of Common Childhood Cancer Incidence Rates* by Race/Ethnicity, Ages 0-19 years, 2002-2006 Other Brain/CNS† Lymphoma Leukemia 200 180 Rate per 1,000,000 160 140 72.3 64.6 59.7 120 100 50.5 54.2 38.0 43.4 80 60 25.5 40 20 0 40.6 25.9 15.0 19.7 45.9 43.6 American Indian/ Alaska Native ‡ Asian/ Pacific Islander 32.7 21.1 46.9 White 27.8 Black 23.2 55.7 Hispanic§ Source: Adapted from Horner, et al.32 Data source: North American Association of Central Cancer Registries Combined Incidence 2002-2006, 2009. *Rates are per 1,000,000 and age adjusted to the 2000 US standard population for three International Classification of Childhood Cancer groupings: I - leukemia, II - lymphoma, and III - brain/central nervous system (CNS). †Rate includes benign brain tumors and myelodysplastic syndromes and is based only on cases diagnosed in 2004-2006. ‡Incidence rates for American Indian/Alaska Native are based on the CHSDA (Contract Health Service Delivery Area) counties. §Persons of Hispanic origin may be of any race. 14 Cancer Facts & Figures for Hispanics/Latinos 2009-2011 of all childhood cancers. There are two major types of leukemia in children – acute lymphocytic leukemia (ALL) and acute myeloid leukemia (AML); ALL accounts for approximately 80% of Hispanic pediatric leukemias.61 Incidence of ALL peaks in children 2 to 3 years of age and has a 5-year relative survival rate of 77% in Hispanic patients.61 The incidence of ALL and AML is higher among Hispanic than non-Hispanic white children/adolescents.60 Though genetic abnormalities appear to be responsible for some proportion of childhood leukemia, few risk factors are well established with the exception of radiation exposure.62 Brain and other central nervous systems cancers: Brain and other central nervous systems (CNS) cancers account for about 15% of all malignancies among Hispanic children in the US.60 Incidence rates of CNS tumors are about 25% lower in Hispanic children and adolescents, compared to non-Hispanic children and adolescents.60 Most of this difference is explained by the incidence rate for astrocytoma, which is about 30% lower in Hispanic than white children.60 The difference may also reflect differences in access and utilization of state-of-the-art diagnostic techniques. Lymphoma: The risk of developing lymphoma increases with age. Among children 14 years and younger, the incidence rate is the same in Hispanics as in non-Hispanic whites; however, among adolescents (15 to 19 years), the incidence rate in Hispanics is about 30% lower than that in non-Hispanic whites.22, 63 Among Hispanic subpopulations, one study reported that lymphoma incidence rates among Hispanic children younger than 15 years of age in Florida (primarily Cuban and Central American origin) are twice those of Hispanic children in California (primarily of Mexican origin). 64 Factors That Influence Health: Socioeconomic Status and Cultural Values and Beliefs Cancer occurrence and survival are influenced by economic, social, and cultural factors. Socioeconomic status, as measured by income and education, is the most critical factor affecting health and longevity. It influences the prevalence of underlying risk factors for cancer, access to health insurance, preventive care, early detection, and treatment. Cultural factors, including language, beliefs, values, and traditions, may also influence underlying risk factors, health behaviors, beliefs about illness, and approaches to medical care. Other factors, including environment, genetics, previous and current health status, and psychosocial factors, also exert considerable influence on the cancer burden in the Hispanic population. Socioeconomic Characteristics In the US, Hispanics have lower levels of educational attainment than non-Hispanic whites and are more likely to live in poverty. In 2005-2007, 40% percent of Hispanics had less than a high school education, compared to 11% of non-Hispanic whites (Table 6).65 About 22% of Hispanics in the US lived in poverty, compared to 9% of non-Hispanic whites. There are also substantial socioeconomic differences within the US Hispanic population. For example, Cubans are about 40% more likely than Mexicans to have at least a high school education (Table 6). Access to Health Care Many Hispanics face financial, structural, and personal barriers to receiving health care. Financial barriers include inadequate health insurance and low personal income. Structural barriers include poor geographic access to providers and lack of transportation to and from providers. Personal barriers to care include cultural and linguistic factors.66, 67 Hispanics are much more likely than whites to work in agriculture, construction, domestic and food services, and other low-wage occupations, which are less likely to offer employer-based health insurance benefits.68 If health coverage is available, it may not be widely affordable. Hispanics are less likely to have health insurance than any other racial or ethnic group.27 The proportion of Hispanic women under age 65 who report no regular source of medical care is almost twice that of nonHispanic white women (Table 6). Cancer Facts & Figures for Hispanics/Latinos 2009-2011 15 Cultural Values and Beliefs Cultural proficiency is an important element in providing high-quality health care and preventive services to diverse populations. Cultural proficiency is a set of attitudes, skills, behaviors, and policies that enable organizations and staff to work effectively in crosscultural situations. It reflects the ability to acquire and use knowledge of the health-related beliefs, attitudes, practices, and communication patterns of clients and their families to improve services, strengthen programs, increase community participation, and close the gaps in health status among diverse population groups. Cultural proficiency also includes population-specific knowledge, including health-related beliefs and cultural values, disease prevalence, and treatment efficacy.69 Cultural proficiency begins with an honest assessment of our positive and negative assumptions about others. It is important to try not to describe an entire cultural group or reinforce stereotypes because diversity exists within every population. In addition, immigrant populations change over time through acculturation and assimilation. Through collaboration, patients and physicians can become empowered to work together toward eliminating racial and ethnic disparities in health care. While recognizing that there are many similarities among people from the same culture, it is important to remember that each individual has a unique personal history, belief system, communication style, and health status. What may be true about some or most individuals from a particular region or country may not be true of all individuals from that region or country. In addition, it is important to realize that Hispanic individuals originate from one of more than 40 countries and may speak a language other than Spanish, such as Portuguese, French, English Patois, and Dutch. Within the Hispanic community, there is a practice of traditional medicine carried out by curanderas, espiritistas, or healers. In urbanized barrios, this tradition has been carried on in part by Hispanic pharmacists, familiar with both traditional treatments like té de manzanilla (chamomile tea) and modern prescription medicines such as antibiotics. Many Hispanics will use traditional medicine in combination with other approaches. Traditional values within the Hispanic culture emphasize the importance of family (la familia), respect (respeto), personal familiarity (personalismo), trust (confianza), and spirit (espiritu).70 Table 6. Socioeconomic and Health Care Access Characteristics (%) by Hispanic Origin Hispanic Puerto All Mexican Rican Cuban Socioeconomic characteristics* Foreign born Income below poverty level Less than a high school degree (age > 25 yrs) A language other than English in the home Health care characteristics† No health care coverage Age < 65 years old Age > 65 years old No regular source of medical care (ages 18-64) Men Women Central or South American NonHispanic White 39.9 21.6 40.1 23.0 1.2 25.0 61.0 14.8 68.9 15.5 3.9 9.2 40.0 46.4 28.5 25.6 34.2 11.1 78.1 78.7 68.7 84.4 90.0 5.9 32.6 4.6 36.2 4.7 13.1 0.4 19.6 1.9 37.5 10.3 12.7 0.4 36.0 21.1 40.8 23.9 19.9 4.2 29.9 22.9‡ 32.9 25.5 19.7 11.0 * Source: American Community Survey, 2005-2007. Accessed via DataFerrett May 7, 2009. † Source: National Health Interview Survey, 2007, National Center for Chronic Disease Prevention and Health Promotion, Centers for Disease Control and Prevention; Estimates age adjusted to the 2000 US Standard Population. ‡ Estimate is considered unreliable due to sample size. 16 Cancer Facts & Figures for Hispanics/Latinos 2009-2011 The Family (La Familia): Family involvement is often critical in the health care of the patient. The Hispanic family network, which may include close friends in addition to immediate and extended family members, plays a major role in decisions regarding health care. Interdependence and cooperation are emphasized over autonomy. For example, family members frequently accompany and consult with Hispanic patients during medical visits.70 Including family members in the consultation is often critical to the care of the patient and may contribute to a patient’s ability to adhere to the recommended treatment. Providers can demonstrate sensitivity to the collective nature of these interactions by extending appointment times and facilitating family involvement. Respect (Respeto): In the Hispanic culture, mutual respect and trust are necessary elements in a successful relationship between patient and provider. Respect implies a mutual and reciprocal deference. Asking direct questions about sensitive topics such as alcoholism may be perceived as disrespectful. By virtue of their healing abilities, education, and training, health providers are afforded a high level of respect as authority figures. As a general rule, Hispanic patients tend to look forward to what the health care provider has to say and value the direction and services. Out of a sense of respect, many Hispanic patients tend to avoid disagreeing with or expressing doubts to their health care provider in relation to their treatment, and may even be reluctant to ask questions or admit confusion about their medical instructions or treatment. Associated with this is a cultural taboo against expressing negative feelings directly. This taboo may manifest itself by a patient withholding information, not following treatment orders, or terminating medical care. Hispanic patients may show respect by avoiding eye contact with health care providers, but expect the provider to look directly at them even when talking through an interpreter.70 Cultural respect promotes trust, which increases the likelihood of patient confidence and compliance.71 Personal familiarity (Personalismo): Hispanic culture values personal over institutional relationships. Hispanic loyalty to the individual provider has significant implications for continuity of care. Hispanic patients often prefer health care providers who are warm, friendly, and personal, and who take an interest in the patient’s life. If a trusted provider leaves the area, their Hispanic patients may stop treatment unless the provider initiates a relationship between the patients and the new provider.70, 71 Principles for Culturally Proficient Health Services for Hispanic/Latino Families and Communities – • Involve family members. • Show respect – Always be respectful, and explain without being condescending. • Get personal – Hispanics typically prefer being closer to each other in space than non-Hispanic whites do. • Ask about their life (family, friends, and work) and share life stories and pictures. • Encourage them to ask questions. • Take seriously the responsibility and respect conferred on the provider. • Reach out to the community – Community-based organizations within Hispanics neighborhoods, barrios, colonias, and other ethnic enclaves provide a significant point of entry and opportunity to expand on any outreach effort you may be involved in. • Respect traditional healing approaches – Hispanic patients may combine respect for the benefits of mainstream medicine, tradition, and traditional healing with a strong religious component. Trust (Confianza): Over time, by respecting the patient’s culture and showing interest, a provider can establish a relationship of trust. Confidence and trust may be difficult to achieve in the current health care system because long-term provider-patient relationships are relatively uncommon and clinicians are limited in the amount of time they can spend with each patient. Yet patient trust in the provider is central for identifying and treating health concerns and encouraging patient adherence to recommended treatment. Spirit (Espiritu): Health care professionals often work within the structures of mainstream medicine, which provides separate physical and mental health care. Hispanic culture, on the other hand, tends to view health from a more synergistic point of view. This view is expressed as the continuum of body, mind, and spirit (espiritu). Cultural competency can be improved upon through the education of health care providers. In addition, community health workers (promotoras) can be helpful in assisting Hispanic patients obtain health care and other services, facilitating communication between providers and patients, and promoting prevention and early detection programs within Hispanic communities. Cancer Facts & Figures for Hispanics/Latinos 2009-2011 17 Risk Factors for Cancer Smoking and obesity are two of the most important behavioral risk factors for cancer. They also increase the risk of developing and dying from other conditions, including diabetes, stroke, and cardiovascular diseases.24, 72 Alcohol consumption is another important risk factor for some cancers and for liver disease. Experts believe that if current knowledge about cancer prevention and early detection was fully applied, about half of all cancer deaths could be prevented.24, 72 This section provides information on behavioral risk factors in Hispanics. Tobacco Use – Adults Tobacco use is a major cause of cancer in the US and is responsible for about 30% of all cancer deaths. Most lung cancers and many cancers of the lip, oral cavity, pharynx, larynx, esophagus, pancreas, cervix, bladder, and kidney, are caused by cigarette smoking.73 The percentage of Hispanic adults who smoke is lower (12.9%) than the percentage of non-Hispanic white adults (22.2%) who smoke. Smoking rates in Hispanic women are about half of those in non-Hispanic white Table 7. Current Cigarette Smoking (%) and Alcohol Consumption (%), Adults 18 and Older, US, 2007 Current smoking Education* 0-12 years (no diploma) GED† diploma High school diploma Some college Associate degree Bachelor’s or higher Poverty level‡ Poor Near poor Nonpoor Unknown Health insurance coverage No Yes Immigration Born in US In US 1-9 yrs In US >10 yrs Overall smoking Hispanic Non-Hispanic White Male Female Total Male Female Total 16.6 – 20.7 20.1 19.4 13.6 7.7 – 8.0 13.7 13.5 4.2 12.5 18.1 14.2 17.1 16.5 9.0 42.5 55.0 30.2 23.2 21.0 10.4 42.3 43.2 26.9 22.3 19.0 8.5 42.5 48.8 28.5 22.7 19.9 9.4 20.3 16.4 17.7 14.2 10.8 8.6 6.8 8.9 15.2 12.6 12.8 11.3 38.3 33.6 22.0 20.0 37.8 32.6 17.3 19.6 37.9 33.0 19.7 19.9 21.0 15.1 10.3 7.2 15.5 11.1 43.9 20.5 38.6 18.5 41.5 19.5 21.0 22.2 14.5 17.4 12.3 4.9 6.0 8.4 16.8 12.7 10.4 12.9 23.7 19.2 21.6 23.6 21.1 18.4 14.2 20.8 22.4 19.4 17.9 22.2 27.2 5.8 16.9 32.5 16.7 24.4 3.7 18.2 32.2 1.6 2.3 17.6 2.6 10.4 25.0 7.0 23.9 31.0 5.4 9.3 32.8 6.2 16.4 31.8 Alcohol consumption Drank 5 or more drinks in a day on at least 1 day in past year Alcohol consumption level§ Current heavier Current moderate Current light – Sample size too small for reliable estimate. * Among adults 25 years and older. † General Education Development. ‡ Poor persons are defined as below the poverty threshold. Near poor persons have incomes between 100% and less than 200% of the poverty threshold. Non-poor persons have incomes of 200% or greater than the poverty threshold. § Heavier drinkers: more than 14 drinks per week for men and more than seven drinks per week for women; moderate drinkers: more than three drinks and up to 14 drinks per week for men and more than three drinks and up to seven drinks per week for women; light drinkers: three drinks or fewer per week, on average. Source: National Health Interview Survey, 2007, National Center for Chronic Disease Prevention and Health Promotion, Centers for Disease Control and Prevention; Estimates age adjusted to the 2000 US Standard Population. 18 Cancer Facts & Figures for Hispanics/Latinos 2009-2011 women, while smoking rates in Hispanic men are about three-quarters of those in non-Hispanic white men (Table 7). Rates of smoking among Hispanic adults who were born in the US (16.8%) are higher than those born elsewhere (10.4%).74 Among the major Hispanic subgroups, Puerto Ricans are more likely to smoke (23% of men and 15% of women) than Mexicans (17% of men and 9% of women) and Cubans (11.3% of men and 13.7% of women).75 Among smokers overall, Hispanics are more likely than non-Hispanic whites to be low-level smokers (consuming 5 or fewer cigarettes per day).76 Smoking cessation conveys tremendous health and economic benefits that are greater for those who quit at a younger age. Like all smokers, Hispanic smokers can reduce their risk of lung cancer and other smokingrelated diseases by quitting. For many smokers, quitting may be difficult because of the addictive properties of nicotine in tobacco. However, quitting is more successful with assistance and support from health providers. Advice to quit by a health care provider is important in encouraging smokers to quit, and several medical treatments can help, including medications (nicotine replacement products alone or in combination with antidepressant medication), counseling, and behavioral therapies.24, 77 However, lower rates of health insurance coverage and lack of access to medical care make it less likely that Hispanic smokers will be advised by a health care provider to quit or have access to tobacco cessation treatments. Studies have found that Hispanics are less likely to be advised to quit by a health care provider or to use nicotine replacement therapy when trying to quit than non-Hispanic whites.78, 79 As with most smokers, Hispanic smokers’ motivation to quit is partly influenced by concern about their family’s health, a desire to set a good example for their children, or because they received helpful advice and support from a medical provider.80-82 Smoking cessation programs for Hispanics may be most effective if they include outreach by lay health advisors (promotoras). These advisors, who are trained to attend to the specific health and medical needs of community members, assist medically underserved Hispanic smokers in accessing tobacco cessation services.83 Smokers may also improve their chances of quitting by accessing cost-free tobacco cessation telephone counseling services available in many states, such as the American Cancer Society Quitline® at 1-800-227-2345 or 1-800-QUIT-NOW.24 Tobacco Use – Youth In general, Hispanic youth are less likely to smoke cigarettes than non-Hispanic white youth (Table 8). Between 1991 and 2007, the percentage of Hispanic high school students who smoked peaked at 32.9% for females in 1995 and at 35.5% for males in 1997 (Figure 9). Following a period of steady declines through 2003, the trends in smoking prevalence in males and females were relatively stable between 2003 and 2007; current estimates show that 14.6% of females and 18.7% of males smoked cigarettes in 2007. Similar trends in youth smoking were observed during this time period in other population groups.84 Unlike markedly lower smoking rates in Hispanic women compared to men, smoking rates among adolescents are almost as high in girls as in boys (Table 8). There is little data available on Table 8. Current Tobacco Use (%) and Alcohol Consumption (%) in High School Students, US, 2007 Hispanic Non-Hispanic White Total Female Male Total Female Male Tobacco use Any tobacco use* Cigarette use† 20.1 16.7 16.4 14.6 23.9 18.7 29.9 23.2 24.3 22.5 35.3 23.8 Alcohol Current alcohol use‡ Episodic heavy drinking§ 47.6 26.8 47.5 25.3 47.7 28.3 47.3 29.8 47.1 27.9 47.4 31.8 * Smoked cigarettes, cigars, cigarillos, or little cigars, or used chewing tobacco, snuff, or dip on one or more of the 30 days preceding the survey. † Smoked cigarettes on one or more of the 30 days preceding the survey. ‡ One or more drinks on one or more of the 30 days preceding the survey. § Five or more drinks in a row within a couple of hours on one or more of the 30 days preceding the survey. Source: Youth Risk Behavior Surveillance System, 2007, National Center for Chronic Disease Prevention and Health Promotion, Centers for Disease Control and Prevention. MMWR Morb Mortal Wkly Rep. 2008;57(SS-4). Cancer Facts & Figures for Hispanics/Latinos 2009-2011 19 Figure 9. Trends in Cigarette Smoking*, Hispanic High School Students, US, 1991-2007 funding allocations in seven states with nearly 80% of the Hispanic population in the US (Arizona, California, Florida, Illinois, New Jersey, New York, and Texas) were less than 50% of the levels recommended by the CDC.94 40 Alcohol Intake – Adults 35 Males Percent 30 25 Females 20 15 10 1991 1993 1995 1997 1999 2001 2003 2005 2007 Year * Smoked cigarettes on one or more of the 30 days preceding the survey. Source: Youth Risk Behavior Surveillance System, 1991-2007. National Center for Chronic Disease Prevention and Health Promotion, Centers for Disease Control and Prevention, 2008. cigarette use among the various subgroups of Hispanic adolescents. According to one recent report, prevalence of smoking did not differ among subgroups of Hispanic adolescents with the exception of Cuban boys, who had somewhat higher rates.85 Tobacco Control Although smoking rates are currently lower among Hispanics than among other groups in the US, comprehensive tobacco control efforts are required in order to reduce cigarette smoking among certain subgroups, including Hispanic men and women with greater acculturation to the US.74, 86, 87 A variety of public health interventions have proven effective in reducing tobacco use, including tobacco tax increases, smoke-free laws, and counter advertising campaigns.24, 73, 88 Tobacco tax increases constitute an effective tobacco control strategy for Hispanics because studies have found this group to be more responsive to tax increases compared to other groups.89 In addition, countermarketing strategies can be effective in neutralizing tobacco industry advertising and promotional strategies targeted at Hispanic groups.90-92 It is also important to fund tobacco control programs at levels recommended by the Centers for Disease Control and Prevention (CDC).93 In 2009, tobacco control 20 Cancer Facts & Figures for Hispanics/Latinos 2009-2011 Excessive alcohol consumption is an important cause of cirrhosis of the liver and liver cancer. Alcohol consumption also increases the risk of cancers of the oral cavity and pharynx, esophagus, larynx, colorectum, and female breast.95-97 The American Cancer Society’s dietary guidelines for cancer prevention and risk reduction state that individuals should limit their alcohol consumption to no more than 2 drinks per day for men and no more than 1 drink per day for women. Alcohol consumption is of special concern among Hispanics because of their higher rates of liver cancer compared to other population groups. According to data from the National Health Interview Survey in 2007, Hispanics tend to consume less alcohol than non-Hispanic whites. Approximately 1.6% of Hispanic women and 3.7% of Hispanic men reported heavy alcohol consumption, compared to 5.4% of non-Hispanic white women and 7% of non-Hispanic white men (Table 7). Among current alcohol drinkers, the prevalence of binge drinking (drank 5 or more drinks in a day on at least one day in the past year) in Hispanic men and women was lower than in non-Hispanic whites. Among women, Hispanics were much less likely than nonHispanic whites to consume alcohol (Table 7). Lower alcohol consumption among Hispanic women may be explained by social customs and attitudes within the Hispanic culture and socioeconomic factors.98, 99 It is important that health promotion and cancer prevention efforts among Hispanic adults encourage low alcohol consumption.100 Alcohol Intake – Youth In 2007, Hispanic high school students reported slightly lower alcohol consumption than non-Hispanic whites. However, rates of consumption among Hispanic students were still quite high. About 48% of Hispanic girls and boys reported consuming alcohol on at least one of the preceding 30 days; 25% of girls and 28% of boys reported consuming 5 or more drinks on a single occasion (Table 8). High female alcohol consumption in Hispanic adolescents, equivalent to that in males, is in sharp contrast to much lower rates of alcohol consumption in Hispanic women compared to men. Prevention strategies to reduce alcohol use among Hispanic youth emphasize the importance of family interventions and communicating to parents the important role they can play in shaping their child’s development and behavior.101, 102 Overweight and Obesity – Adults Obesity is associated with an increased risk of several cancers, including breast, prostate, colon, and uterine.103 Obesity also increases the risk of diabetes, high blood pressure, heart disease, and premature death. An adult with a body mass index (BMI) of 30 or greater is considered obese. Overweight among adults is defined as a BMI of 25 or greater. (See sidebar.) In the early 1990s, 20.6% of US adults were obese; by 2005-2006, this figure had risen to 34%.104, 105 The prevalence of obesity has increased across all racial/ethnic groups. The sudden increase in obesity in the US is linked with changes in the social environment, including the availability and promotion of high-calorie and low-nutrient foods and reduced opportunities to engage in physical activity at work, while commuting, in school, and during leisure time.106, 107 These changes have led to increased caloric consumption and decreased energy expenditure in the population.106, 108 Rates of obesity are higher in Hispanics than non-Hispanic whites 104, 105 (Figure 10). The National Health and Nutrition Examination Survey (NHANES) is the most accurate source of information on obesity trends in the US because height and weight are measured rather than reported by participants. The NHANES reports data for Hispanics of Mexican descent but not other Hispanic subgroups. When first measured in 1976-1980, 26.6% of Mexican American women and 15.7% of Mexican American men were obese. In 2005-2006, 42.9% of Mexican women and 28.1% of Mexican men were obese.17, 104, 105 In 2005-2006, the NHANES found that approximately 74% of Mexican American men and women were overweight, in contrast to about 58% of non-Hispanic white women and 73% of non-Hispanic white men.105 Aside from avoiding tobacco use, lifestyle practices such as maintaining a healthy weight and increasing physical activity are the most important approaches to reducing the risk of cancer, as well as many chronic diseases. Because of the link between nutrition, physical activity, and cancer, the American Cancer Society publishes guidelines on nutrition and physical activity for cancer prevention. The guidelines, which were most Definitions of Overweight and Obesity, by Height and Body Weight Defining Body Mass Index Different measures are used to determine whether a person is considered overweight or obese, taking height into account. A common scale is the body mass index (BMI), or ratio of weight (in kilograms) to height (in meters, squared). For adults aged 20 years and older, overweight is defined as a BMI of 25.0-29.9 kg/m2; obesity is defined as a BMI of 30.0 kg/m2 or greater. Although BMI may overestimate body fat in athletes and others who have a muscular build, or underestimate body fat in older persons who have lost muscle mass, it is in general a reliable indicator of total body fat. This table relates BMI to pounds and inches rather than kilograms and meters. For example, a 5’4” woman is considered overweight if she weighs between 145 and 173 pounds. She is obese if she weighs 174 pounds or more. A 5’10” man is considered overweight if he weighs between 174 and 208 pounds and obese if he weighs 209 pounds or more. Height (feet, inches) 6’4” 6’3” 6’2” 6’1” 6’0” 5’11” 5’10” 5’9” 5’8” 5’7” 5’6” 5’5” 5’4” 5’3” 5’2” 5’1” 5’0” 4’11” 4’10” Body weight (pounds) Overweight* Obese† 205 200 194 189 184 179 174 169 164 159 155 150 145 141 136 132 128 124 119 246 240 233 227 221 215 209 203 197 191 186 180 174 169 164 158 153 148 143 * Overweight defined as body mass index of 25-29.9 kg/m2. † Obesity defined as body mass index of 30 kg/m2 or greater. recently updated in 2006, recommend maintaining a healthy weight throughout life, adopting a physically active lifestyle, eating a variety of healthy foods with an emphasis on plant sources, and limiting consumption of alcoholic beverages.107 The US Department of Agriculture recommendations on nutrition and physical activity for Americans are consistent with Cancer Facts & Figures for Hispanics/Latinos 2009-2011 21 those of the Society and are available in Spanish. (For additional information, see Nuevas Guias Alimentarias Ayudarán a los Estadounidenses Tomar Mejores Decisiones Alimenticias y Vivir Más Sanos at hhs.gov/news/ press/2005pres/20050112a.html). Overweight and Obesity – Youth Overweight children often become overweight adults, with an increased risk for a wide variety of poor health outcomes.109 Some of the health consequences of overweight and obesity can occur early in life, such as high blood pressure, high cholesterol, and diabetes.110 The prevalence of overweight in children of all racial and ethnic groups has increased sharply in the US since 1980.111, 112 For children and adolescents, the BMI that is considered healthy varies by age. Obese is defined as a BMI at or above the 95th percentile from sex- and age-specific growth charts.111 Data from the NHANES show that between the late 1970s and 2006, the percentage of US children ages 6 to 11 who were obese more than doubled, while the percentage of obese adolescents ages 12 to 19 almost tripled (Figure 11).104, 113 The percentage of obese children and adolescents has been consistently higher among Mexican Americans compared to nonHispanic whites. In the most recent time period, the obesity prevalence among Mexican children has stabilized. Obesity prevention strategies at the community, school, and family level are necessary to address the childhood epidemic in the US.108, 114, 115 Community Strategies There is growing recognition that multiple aspects of social environments where people live, work, and play appear to be linked to overweight and obesity.107, 108, 116 Although healthy eating and physical activity are a matter of individual choice, the local food environment (e.g., fast-food outlet density versus supermarkets) and Figure 11. Trends in Obesity for Mexican American and Non-Hispanic White Children, 1976-2006 Mexican male Mexican female Non-Hispanic white male Non-Hispanic white female 30 Ages 6-11 25 Figure 10. Trends in Obesity* for Mexican American and Non-Hispanic White Adults 20 and Older, 1976-2006 Percent 20 15 10 5 45 0 1976-80† 1988-94 1999-02 2003-06 1999-02 2003-06 40 35 30 20 20 Mexican female 15 Non-Hispanic white female Non-Hispanic white male 10 15 10 Mexican male 5 5 0 Ages 12-19 25 25 Percent Percent 30 1976-80† 1988-94 1999-02 2003-04 2005-06 Year * Body mass index of 30.0 kg/m2 or greater. Estimates are age adjusted to the 2000 US standard population. † Data for Mexican Americans in 1976-80 are for years 1982-84. Source: National Center for Health Statistics. 1976-2002: Health, United States, 2008, 2009. 1982-1984 (Mexican adults): Hispanic Health and Nutrition Examination Survey. 2003-2006: National Health and Nutrition Examination Survey Public Use Data Files. 2006, 2007. 22 Cancer Facts & Figures for Hispanics/Latinos 2009-2011 0 1976-80† 1988-94 Year * BMI at or above the sex- and age-specific 95th percentile BMI cutoff points from the 2000 sex-specific BMI-for-age CDC Growth. † Data for Mexican Americans in 1976-80 are for years 1982-84. Source: National Center for Health Statistics. 1976-2002: Health, United States, 2008, 2009. 1982–1984 (Mexican children): Hispanic Health and Nutrition Examination Survey. built-environment features (e.g., accessibility parks, gym or other recreational settings) can influence individuals’ choice and ability to adopt a healthy lifestyle.106, 108, 116, 117 Therefore, the American Cancer Society nutrition and physical activity guidelines include recommendations for community-level actions. They suggest the need for public, private, and community organizations to work together to facilitate and promote policies to effect changes in social and physical environments in order to enable people to adopt and maintain healthy nutrition and physical activity behaviors.107 Specifically, community-level actions are needed to: (1) increase access to healthy foods in schools, worksites, and communities; (2) provide safe, enjoyable spaces for physical activity in schools; (3) provide for safe, physically active transportation (such as biking and walking) and recreation in communities. Examples of strategies to promote healthy behaviors in Latino communities Schools are a logical place for efforts to reduce childhood obesity. In Texas, the Paso del Norte Health Foundation’s Coordinated Approach to Child Health (CATCH) initiative has worked with local elementary schools to encourage healthy lifestyles by developing a standardized health promotion curriculum. The former commissioner of the Department of State Health Services in Texas recognized CATCH’s role in helping decrease the prevalence of overweight children in El Paso County: in 2001–2002, 27% of fourth-graders were overweight; by 2005-2006 the rate had dropped to 17%.118 In Albuquerque, New Mexico, the community partnership known as the Albuquerque Alliance for Active Living developed a “walking school bus” program, whereby children who live within one mile of their elementary school walk together with an adult supervisor. A team, including a representative from the National Park Service, a school nurse, a neighborhood association representative, and students from the University of New Mexico (UNM), developed a structured route that gives these children a safe, healthy way to get to and from school. The alliance has also instituted a bicycle-recycling program, created a network of walking paths, and created a graduate-level course in public health and community and regional planning at UNM.119 Cancer Facts & Figures for Hispanics/Latinos 2009-2011 23 Cancer Screening Tests Regular screening can greatly improve the chances of a cure for some types of cancer by detecting it at an early stage when treatment is most effective.24, 120 Screening can actually prevent some cancers (cervical and colorectal) by detecting and removing growths or changes in tissues that are likely to progress to cancer.120 The American Cancer Society’s recommendations for screening are on page 25. Colorectal Screening The American Cancer Society recommends that screening for colorectal cancer begin at age 50 in persons at average risk with no symptoms of colorectal cancer. The Society recommends that screening can be done by any of five different methods. (See page 25.)120 Hispanics aged 50 and older are less likely to have had a recent screening test for colorectal cancer than nonHispanic whites – 31.9% vs. 49.5%, respectively (Table 9). There are differences in the recent use of colorectal cancer tests by country of origin among Hispanics. For instance, Mexicans and Latinos from Central or South America are less likely than other Hispanic subgroups to have had recent colorectal cancer screening. Moreover, uninsured Hispanics and non-Hispanic whites are less likely to have had recent colorectal cancer screening tests than their insured counterparts (Table 9). Breast Cancer Screening Mammography is a low-dose x-ray procedure that can detect breast cancer at a stage when treatment may be more effective. The American Cancer Society recommends annual mammograms for women aged 40 and older who are at average risk for breast cancer, as well as regular clinical breast examinations.120 Since 1987, the use of breast cancer screening has been increasing across all racial and ethnic groups, and the gap in the prevalence of recent (within the past two years) mammography use between Hispanic and non-Hispanic white women has narrowed to about 8%.121, 122 In 2005, 59.6% of Hispanic women aged 40 and older had a mammogram within the past two years, compared to 68.1% of non-Hispanic whites (Table 9). Among Hispanic subgroups, Central and South American and Cuban women show a higher prevalence of breast cancer screening Table 9. Cancer Screening Test Use (%), by Hispanic Origin, US, 2005 Hispanic Hispanic sub-groups Puerto All Uninsured Mexican Rican Cuban Non-Hispanic Whites Central or South American All Uninsured Colorectal cancer, adults 50 and older* Total Men Women 31.9 34.0 30.2 14.7 5.5 19.9 28.2 29.2 27.4 44.8 57.2 36.9 32.2 24.9 40.6 25.8 25.5 26.1 49.5 51.0 48.3 19.0 25.5 9.2 Cervical cancer screening, women 18 and older Pap test within past 3 years 74.6 65.9 73.3 77.7 72.4 71.3 81.4 55.7 Breast cancer screening, women 40 and older Mammogram within past 2 years Mammogram within past year † 59.6 41.7 42.3 33.3 56.2 38.5 57.8 43.1 72.7 51.7 63.9 46.6 68.1 53.0 35.1 23.1 Prostate cancer, men 50 and older‡ Prostate specific antigen test (PSA) past year 29.7 4.0 26.6 28.1 27.9 34.0 42.9 19.2 * Either a fecal occult blood test within the past year, sigmoidoscopy within the past five years, or a colonoscopy within the past 10 years. † American Cancer Society recommends women 40 and older get regular annual mammograms. ‡ Among those who reported never having been diagnosed with prostate cancer. Note: The 2005 estimates for PSA screening are not comparable to estimates from 2003 and prior due to survey differences. Source: National Health Interview Survey Public Use Data File 2005, National Center for Health Statistics, Centers for Disease Control and Prevention, 2006; estimates are age adjusted to the 2000 Standard Population. 24 Cancer Facts & Figures for Hispanics/Latinos 2009-2011 Screening Guidelines For the Early Detection of Cancer in Asymptomatic People Site Recommendation Breast • Yearly mammograms are recommended starting at age 40. The age at which screening should be stopped should be individualized by considering the potential risks and benefits of screening in the context of overall health status and longevity. • Clinical breast exam should be part of a periodic health exam about every 3 years for women in their 20s and 30s, and every year for women 40 and older. • Women should know how their breasts normally feel and report any breast change promptly to their health care providers. Breast self-exam is an option for women starting in their 20s. • Women at increased risk (i.e., family history, genetic tendency, past breast cancer) should talk with their doctors about the benefits and limitations of starting mammography screening earlier, having additional tests (i.e., breast ultrasound and MRI), or having more frequent exams. Colon & rectum Beginning at age 50, men and women should begin screening with one of the examination schedules below: Tests that detect adenomatous polyps and cancer • A flexible sigmoidoscopy every 5 years, or • A colonoscopy every 10 years, or • A double-contrast barium enema every 5 years, or • Computed tomographic colonography every 5 years Tests that primarily detect cancer • Annual guaiac-based fecal occult blood test with high test sensitivity for cancer, or • Annual fecal immunochemical test with high test sensitivity for cancer, or • Stool DNA test with high sensitivity for cancer, interval uncertain ProstateHealth care providers should discuss the potential benefits and limitations of prostate cancer early detection testing with men and offer the PSA blood test and the digital rectal examination annually, beginning at age 50, to men who have a life expectancy of at least 10 years. Men at high risk (African American men and men with a strong family history of one or more first-degree relatives diagnosed with prostate cancer at an early age) should have this discussion with their health care provider beginning at age 45. Uterus ervix: Screening should begin approximately 3 years after a woman begins having vaginal intercourse, but C no later than 21 years of age. Screening should be done every year with regular Pap tests or every 2 years using liquid-based tests. At or after age 30, women who have had 3 normal test results in a row may get screened every 2 to 3 years. Alternatively, cervical cancer screening with HPV DNA testing and conventional or liquid-based cytology could be performed every 3 years. However, doctors may suggest a woman get screened more often if she has certain risk factors, such as HIV infection or a weak immune system. Women 70 years and older who have had 3 or more consecutive normal Pap tests in the past 10 years may choose to stop cervical cancer screening. Screening after total hysterectomy (with removal of the cervix) is not necessary unless the surgery was done as a treatment for cervical cancer. ndometrium: The American Cancer Society recommends that at the time of menopause all women should E be informed about the risks and symptoms of endometrial cancer, and strongly encouraged to report any unexpected bleeding or spotting to their physicians. Annual screening for endometrial cancer with endometrial biopsy beginning at age 35 should be offered to women with or at risk for hereditary nonpolyposis colon cancer (HNPCC). Cancer- related checkup For individuals undergoing periodic health examinations, a cancer-related checkup should include health counseling, and, depending on a person’s age and gender, might include examinations for cancers of the thyroid, oral cavity, skin, lymph nodes, testes, and ovaries, as well as for some nonmalignant diseases. American Cancer Society guidelines for early cancer detection are assessed annually in order to identify whether there is new scientific evidence sufficient to warrant a reevaluation of current recommendations. If evidence is sufficiently compelling to consider a change or clarification in a current guideline or the development of a new guideline, a formal procedure is initiated. Guidelines are formally evaluated every 5 years regardless of whether new evidence suggests a change in the existing recommendations. There are 9 steps in this procedure, and these “guidelines for guideline development” were formally established to provide a specific methodology for science and expert judgment to form the underpinnings of specific statements and recommendations from the Society. These procedures constitute a deliberate process to ensure that all Society recommendations have the same methodological and evidence-based process at their core. This process also employs a system for rating strength and consistency of evidence that is similar to that employed by the Agency for Health Care Research and Quality (AHCRQ) and the US Preventive Services Task Force (USPSTF). ©2009, American Cancer Society, Inc. Cancer Facts & Figures for Hispanics/Latinos 2009-2011 25 non-Hispanic white women, participation rates have improved in recent decades.17, 120 The prevalence of recent Pap testing among Hispanic women ages 18 and older increased from 64% in 1987 to 74.6% in 2005. Participation in cervical cancer screening across Hispanic subgroups ranges from 71% among Latinas from Central or South American to 77.7% among Puerto Rican women. Uninsured women are less likely to have had a recent Pap test, compared to women who have health care coverage (Table 9). Prostate Cancer Screening Evidence about the value of testing for early prostate cancer detection is insufficient to recommend for or against screening with the digital rectal examination (DRE) or the prostate-specific antigen (PSA) test for men at average risk.120 Recently published results from clinical trials are conflicting about the mortality benefit of PSA screening for prostate cancer. The American Cancer Society recommendation for the early detection of prostate cancer is to promote informed choice to men aged 50 and older who have a life expectancy of at least 10 years.120 In 2005, 29.7% of Hispanic men aged 50 and older had a PSA test within the past year, compared to 42.9% of non-Hispanic whites. Mexican men and men who lack health insurance had the lowest prevalence of PSA testing (Table 9). (63.9% and 72.7%, respectively) than Mexican women (54.5%), who are the least likely to have had a recent mammogram. Despite increases in the prevalence of screening, breast cancer is detected at an advanced stage more often in Hispanics than in non-Hispanic whites (Figure 6). This difference has been largely attributed to lower frequency of and longer intervals between mammograms, and lack of timely follow-up of suspicious mammograms.123, 124 Cervical Cancer Screening Regular use of Pap tests followed by appropriate and timely treatment reduces deaths from cervical cancer.125 The American Cancer Society recommends that screening for the early detection of cervical cancer should begin approximately 3 years after a woman begins to have vaginal intercourse but no later than 21 years of age, and should continue at regular intervals thereafter. While Hispanic women have been historically less likely to participate in cervical cancer screening compared to 26 Cancer Facts & Figures for Hispanics/Latinos 2009-2011 Strategies to Improve Cancer Screening Health care barriers – such as a lack of health insurance or a usual source of care – that are experienced by many Hispanic men and women in the US are reflected in lower rates of preventive services, such as cancer screening.126-128 In addition, the lower educational status among Hispanics has been associated with lower cancer screening utilization in most studies; lower educational attainment may lead to less knowledge or awareness about cancer causes and screening practices. Effective communication strategies to close this knowledge gap are needed.129, 130 Studies have shown that the presence of social support may improve participation in screening examinations.131 Local outreach programs and culturally targeted interventions by lay Hispanic health advisors along with physician encouragement to promote the benefits of early cancer detection are also effective strategies for improving cancer screening participation within Hispanic communities.132 How the American Cancer Society Helps Save Lives and Reduce Cancer Disparities The American Cancer Society continues to work toward the 2015 goal of saving lives and eliminating disparities in cancer morbidity and mortality by helping people stay well and get well, by finding cures, and by fighting back against the disease. This section provides highlights and information on some of these efforts. Programs and Services Stay Well and Get Well Luzca Bien...Sientase Mejor is for Hispanic women undergoing cancer treatment. The program, which is a collaboration with the Personal Care Products Council Foundation, the Society, and the National Cosmetology Association, teaches female patients beauty techniques to help restore their appearance and self-image during chemotherapy and radiation treatments. The American Cancer Society helps people everywhere stay well by preventing cancer or detecting it early, when it is most treatable. If they are diagnosed with cancer, the Society provides the information, day-today help, and emotional support to guide them through every step of their experience and to help them get well. Cancer Information The American Cancer Society provides accurate, up-todate information spanning the cancer continuum from prevention to palliative care in Spanish and English 24 hours a day, seven days a week, via 1-800-227-2345 and through its Web site, cancer.org. The Society develops numerous Spanish-language materials, such as a colorectal cancer information resource kit and Cancer Facts & Figures for Hispanics/Latinos, to educate Spanish-speaking populations about cancer. Information is also available in Bengali, Chinese, French, Haitian Creole, Hindi, Korean, and Russian. For more information, visit the Easy Reading Project Web site at cancer.org/easyreading. Everyday Choices For A Healthier Life is a joint initiative of the American Cancer Society, the American Diabetes Association, and the American Heart Association to encourage the prevention and early detection of cancer, diabetes, heart disease, and stroke. The Everyday Choices Web site (everydaychoices.org) and brochure are both available in Spanish. The National Comprehensive Cancer Network, through a partnership with the Society, provides Spanish-language treatment guidelines for all of the major cancers in a reliable, specific, easy-to-understand format. These patientfriendly resources help cancer patients and their families make timely, well-informed decisions about their treatment. More information can be found at nccn.org. Many American Cancer Society programs and services have been developed or tailored to be culturally appropriate and language-specific for Hispanic audiences. Examples include the following: Luzca Bien...Sientase Mejor® (Look Good...Feel Better®) Cancer Survivors Network The American Cancer Society Cancer Survivors Network® (CSN) is an online community created by and for cancer survivors and cancer caregivers. All persons personally affected by cancer are welcome. The CSN site includes prerecorded stories in Spanish by Hispanic cancer survivors sharing their personal journey with cancer. Patient Navigator Program The American Cancer Society Patient Navigator Program involves the placement of trained Society staff in health care facilities with oncology treatment services that treat a high proportion of medically underserved patients. The goal of the Patient Navigator Program is to provide cancer patients and their families with personalized and reliable cancer information, Society resource referrals, and timely follow-up. Quitline The American Cancer Society Quitline® program is a clinically proven telephone counseling service that provides tobacco cessation assistance and materials in Spanish and English. Quitline also offers a TTY line and self-help materials, such as audiotapes, for low-literate individuals. Reach to Recovery In the American Cancer Society Reach to Recovery® program, trained breast cancer survivors provide one-on-one support, information, and inspiration to breast cancer patients. A promotional brochure is available in Spanish. Cancer Facts & Figures for Hispanics/Latinos 2009-2011 27 Find Cures Since 1999, the American Cancer Society has funded more than 117 studies totaling more than $100 million devoted to the poor and medically underserved. Almost one-fourth of this research focuses on the Hispanic/ Latino population, encompassing the cancer continuum from prevention to survivorship. Examples of currently funded research include the following: Prevention. Latino adolescents at low acculturation levels have lower rates of tobacco and other substance use compared to highly acculturated Latino youth. This is thought to be due to parenting practices, values, and norms. One Society-funded study is evaluating the feasibility of developing a parenting intervention focusing on cultural traditions and values in preventing tobacco and substance use in Latino adolescents. Survivorship. Studies in the general population have shown that hospice care results in better care for the patient and less stress for caregivers. Although cancer is the leading cause of death among Latinos, only 2-4% of Latinos use hospice care. Reasons why a family does not choose hospice care and outcomes for Latino patients and families are unknown. A current study conducted by a Society grantee is examining and comparing cancer caregiving and hospice use, including the effect of cultural factors, among Latinos and whites. Data from this study can be used to develop evidence-based programs to increase hospice use and improve caregiver outcomes. Fight Back The American Cancer Society and the American Cancer Society Cancer Action Network SM (ACS CAN), the Society’s nonprofit, nonpartisan advocacy affiliate, are dedicated to reducing cancer incidence and mortality rates among minority and medically underserved populations. This goal can be achieved by instituting effective policies and public health programs that promote overall wellness and save lives. ACS CAN and the Society are involved in advocacy efforts at both the state and federal levels; listed below are some of the efforts that the American Cancer Society and ACS CAN have been involved with in the past few years: ACS CAN is the leading voice of patients in the health care reform debate, having worked with a broad cross section of stakeholders for the past several years to build momentum for nationwide reform. To eliminate death 28 Cancer Facts & Figures for Hispanics/Latinos 2009-2011 and suffering from cancer, the Society and ACS CAN believe that all Americans need access to quality, affordable health care. One in three Hispanics are uninsured and almost half of low-income Hispanics lack a usual source of care.133 Furthermore, Hispanics are less likely to utilize effective cancer prevention and early detection services. That is why ACS CAN is dedicated to fighting for legislation that will help save lives through prevention, meaningful coverage, and improved quality of life. Each year, ACS CAN works hard to ensure that the agencies overseeing cancer research and programs receive the money they need to continue the strong battle against cancer. ACS CAN continues to lead the fight to maintain and increase the investment the US has made in biomedical and cancer research at the National Institutes of Health, National Cancer Institute, and the Centers for Disease Control and Prevention (CDC). This investment includes increased funding for cancer research at the National Center on Minority Health and Health Disparities, which the Society was instrumental in helping to establish. Increasing funding for the CDC’s National Breast and Cervical Cancer Early Detection Program is a high priority for the Society and ACS CAN. This successful program provides community-based breast and cervical cancer screening, diagnosis, and treatment to lowincome, uninsured women (cdc.gov/cancer/nbccedp). Today, there is only enough funding to screen 1 in 5 eligible women aged 50-64 for the community-based breast and cervical cancer screening program run by the CDC. The result is that millions of women are going without lifesaving screenings and treatment. ACS CAN is leading the effort to increase funding for this lifesaving program. ACS CAN has been instrumental in the introduction of legislation that will create a national colorectal cancer prevention, early detection, and treatment program for the medically underserved. This bill will build on efforts to improve access to health care, remove some barriers Hispanic adults face when trying to access cancer screenings, and elevate the importance of refocusing our health care system on preventing disease altogether. ACS CAN was a leading partner in the successful passage of the Family Smoking Prevention and Tobacco Control Act, signed into law in 2009. This legislation will give the Food and Drug Administration (FDA) the authority to regulate tobacco products and stop companies from marketing their deadly product to children. Every day, 3,500 children try a cigarette for the first time and another 1,000 become addicted. In 2004, one in 10 Hispanic middle school students smoked cigarettes, a higher proportion than in any other racial or ethnic group.134 ACS CAN was extremely influential in securing funding for the Patient Navigator bill, which was signed into law by President George W. Bush in 2005. This landmark legislation provides funding for patient navigators who are skilled in providing culturally relevant information, tailored outreach and education, and interventions that will improve access to care, health outcomes, and quality of life in medically underserved communities. Research on patient navigators shows that they improve colorectal screening compliance rates, help patients and their families manage cancer diagnoses, and overcome language and cultural barriers to obtaining timely and appropriate cancer care and treatment. ACS CAN strongly supports legislation to create new opportunities for research to reduce cancer disparities across the entire disease spectrum, from prevention and screening, to treatment and palliative care. This work can then facilitate intervention delivery with the goal of reducing disparities across the continuum of cancer care. To learn more and stay up to date on ACS CAN’s latest actions, visit acscan.org. Other Organizations That Are Focused on Cancer and Other Health Issues among Hispanics Intercultural Cancer Council (ICC) The Intercultural Cancer Council promotes policies, programs, partnerships, and research to eliminate the unequal burden of cancer among racial and ethnic minorities and medically underserved populations in the United States and its associated territories. For more information, visit iccnetwork.org. National Hispanic Council on Aging The National Hispanic Council on Aging (NHCOA) was established as an advocacy organization with the primary purpose of improving the quality of life for Latino senior citizens, families, and communities. Since its inception, the NHCOA has focused on the importance and function of the family to assist the elderly in every aspect of living and to provide needed care in old age. For more information, visit nhcoa.org. National Hispanic Medical Association (NHMA) The National Hispanic Medical Association is a nonprofit association representing 36,000 licensed Hispanic physicians in the United States. The mission of the organization is to improve the health of Hispanics and other underserved populations. As a rapidly growing national resource based in the nation’s capital, NHMA provides policy-makers and health care providers with expert information and support in strengthening health service delivery to Hispanic communities across the nation. For more information, visit nhmamd.org. National Latino Council on Alcohol and Tobacco Prevention (LCAT) Created in 1989 by a group of Latino public health professionals and community advocates, the National Latino Council on Alcohol and Tobacco Prevention (LCAT) is dedicated to reducing the harm caused by alcohol and tobacco in the Latino community. LCAT serves as a national resource center for those actively working in Hispanic/Latino tobacco prevention and control. For more information, visit nlcatp.org. Prevención Prevención is a nonprofit organization that develops, produces, and disseminates Spanish-language educational materials on health promotion and disease prevention via Spanish-language radio, television, and the Internet. In partnership with government and private organizations, Prevención conducts health information campaigns targeted toward “hard-to-reach” Spanishspeaking segments of the population. For more information, visit prevencion.org. Redes En Acción The National Latino Cancer Research Network is a National Cancer Institute-funded initiative to combat cancer among Latinos. The program focuses on developing national and regional networks of partners engaging in cancer research, training, and awareness activities surrounding key Latino cancer issues. Under the NCI’s new Community Networks Program initiatives, Redes is expanding its infrastructure to reduce cancer disparities by promoting cancer education, research, and training within the US and Puerto Rico. For more information, visit redesenaccion.org. Cancer Facts & Figures for Hispanics/Latinos 2009-2011 29 Sources of Statistics New cancer cases: The estimated numbers of new US cancer cases among Hispanics in 2009 were calculated by fitting the estimated numbers of cancer cases that occurred each year in the US from 1995 through 2005 to a statistical forecasting model. The estimated numbers of US cases from 1995 through 2005 were calculated using cancer incidence data for these years from 41 states and the District of Columbia that met the North American Association of Central Cancer Registries’ (NAACCR) high-quality data standard for incidence and population data collected by the US Census Bureau. Incidence rates: Incidence rates are defined as the number of newly diagnosed cancer cases that occur each year in a population of specified size. They are usually expressed as the total number of cases per 100,000 population per year. Incidence data for this report were collected either by the Surveillance, Epidemiology, and End Results (SEER) program or NAACCR, as stated, along with the population data collected by the US Census Bureau. All incidence rates in this publication are age adjusted to the 2000 US standard population. Cancer deaths: The estimated numbers of US cancer deaths among Hispanics in 2009 were calculated by fitting the number of cancer deaths from 1992 through 2006 to a statistical forecasting model using the Joinpoint regression program.135 Data on the number of deaths are obtained from the National Center for Health Statistics (NCHS) of the Centers for Disease Control and Prevention (CDC). Death rates: Similar to the incidence rates, death rates represent the corresponding number of deaths per 100,000 population per year. Death rates were reported by the SEER program using data on cancer deaths from the National Center for Health Statistics along with population data from the US Census Bureau. All death rates in this publication are age adjusted to the 2000 US standard population. 30 Cancer Facts & Figures for Hispanics/Latinos 2009-2011 National Health and Nutrition Examination Survey (NHANES). The NHANES is conducted by the CDC’s National Center for Health Statistics (NCHS). It is designed to provide national prevalence estimates on the health and nutritional status of adults and children. Data are gathered through in-person interviews and direct physical exams in mobile examination centers. For more information, visit cdc.gov/nchs/nhanes.htm. National Health Interview Survey (NHIS). The NHIS is conducted by the CDC’s National Center for Health Statistics (NCHS). It is designed to provide national prevalence estimates on personal, socioeconomic, demographic, and health characteristics, such as cigarette smoking and physical activity. Data are gathered through a computer-assisted personal interview of adults aged 18 and older. The annual survey has been conducted by NCHS since 1957. For more information, visit cdc.gov/nchs/nhis.htm. Youth Risk Behavior Surveillance System (YRBSS). The YRBSS survey is conducted by the CDC’s National Center for Chronic Disease Prevention and Health Promotion (NCCDPHP). It is designed to provide national, state, and local prevalence estimates on health risk behaviors such as tobacco use, unhealthy dietary behaviors, and physical inactivity among youth and young adults who attend public and private high schools. Data are gathered through a self-administered questionnaire completed during a required subject or class period. The biennial survey began in 1991. The state and local surveys are of variable data quality, and caution should be used in comparing data among them. For more information, visit cdc.gov/HealthyYouth/yrbs/ index.htm. Factors That Influence Cancer Rates Data Completeness and Geographic Coverage Comparison of cancer rates between racial and ethnic groups, particularly those involving groups other than whites or African Americans, should be interpreted with caution for several reasons. First, ethnicity and race are not always classified uniformly in medical records, death certificates, and the US decennial census, so rates for populations other than whites and African Americans are likely to be underestimated. Second, the incidence trend data compiled in this report are from the 13 SEER cancer registry areas, which may not be representative of the total US population and may not accurately reflect the cancer experience of Hispanics throughout the US. Third, comparisons made between Hispanics and non-Hispanic whites consider only ethnicity and do not describe potential racial differences. Last, the cancer experience within the Hispanic population varies greatly according to country of origin. For example, smoking-related cancers are more likely to be higher in Cuban Americans than Mexican Americans because of differences in smoking prevalence between these two groups. Hispanic/Latino Identification Accurately identifying Hispanic/Latino individuals for cancer surveillance has been an ongoing challenge. In an effort to address this issue, the North American Association of Central Cancer Registries (NAACCR) convened an expert panel in 2001 to develop the NAACCR Hispanic Identification Algorithm (NHIA), first released for use by cancer registries in 2003. NHIA uses a combination of patient variables found within cancer registry records, including last name and birthplace, to indirectly determine Hispanic origin. Following widespread implementation by state cancer registries, improvements were made to NHIA and a modified version was released in 2005 (NHIA v2).136 More recently, in certain states with large and diverse Hispanic/Latino populations, special research investigations have been under way to more precisely classify Hispanic subpopulations and describe their specific cancer burden. One such investigation from the Florida cancer surveillance registry recently documented the cancer incidence of Cubans, Puerto Ricans, and Mexicans residing in that state. Such information is useful for planning targeted cancer control programs.137 Age Adjustment to the Year 2000 Standard Epidemiologists use a statistical method called “age adjustment” to compare groups of people with different age compositions. For example, without adjusting for age, it would be inaccurate to compare the cancer rates of the state of Florida, which has a large elderly population, to that of Alaska, which has a younger population. This is especially true when examining cancer rates, since cancer is generally a disease of older people. Without adjusting for age, it would appear that the cancer rates in Florida are much higher than Alaska. However, once the ages are adjusted, the rates appear to be similar. Cancer Facts & Figures for Hispanics/Latinos 2009-2011 31 References 1. Howe HL, Wu X, Ries LA, et al. Annual report to the nation on the status of cancer, 1975-2003, featuring cancer among U.S. Hispanic/Latino populations. Cancer. Oct 15 2006; 107(8):17111742. 2. Martinez-Tyson D, Barnett Pathak E, Soler-Vila H, Flores AM. Looking under the Hispanic umbrella: cancer mortality among Cubans, Mexicans, Puerto Ricans and other Hispanics in Florida. J Immigr Minor Health. 2009; 11(4):249-57. 3. Cancer Incidence in Five Continents. Vol VIII. Lyon, France: International Agency for Research on Cancer; 2002. 4. Chao A, Gilliland FD, Hunt WC, Bulterys M, Becker TM, Key CR. Increasing incidence of colon and rectal cancer among Hispanics and American Indians in New Mexico (United States), 1969-94. Cancer Causes Control. Mar 1998; 9(2):137-144. 5. Thomas DB, Karagas MR. Cancer in first and second generation Americans. Cancer Res. Nov 1 1987; 47(21):5771-5776. 6. Wilkinson JD, Wohler-Torres B, Trapido E, et al. Cancer trends among Hispanic men in South Florida, 1981-1998. Cancer. Feb 15 2002; 94(4):1183-1190. 7. Lara M, Gamboa C, Kahramanian MI, Morales LS, Bautista DE. Acculturation and Latino health in the United States: a review of the literature and its sociopolitical context. Annu Rev Public Health. 2005; 26:367-397. 8. Singh GK, Hiatt RA. Trends and disparities in socioeconomic and behavioural characteristics, life expectancy, and causespecific mortality of native-born and foreign-born populations in the United States, 1979-2003. Int J Epidemiol. Aug 2006; 35(4):903919. 9. Cockburn MG, Zadnick J, Deapen D. Developing epidemic of melanoma in the Hispanic population of California. Cancer. Mar 1 2006; 106(5):1162-1168. 10. American Cancer Society. Breast Cancer Facts & Figures 20092010 (in press). Atlanta, GA: American Cancer Society; 2009. 11. Baumgartner KB, Hunt WC, Baumgartner RN, et al. Association of body composition and weight history with breast cancer prognostic markers: divergent pattern for Hispanic and non-Hispanic White women. Am J Epidemiol. Dec 1 2004; 160(11):1087-1097. 12. Slattery ML, Sweeney C, Edwards S, et al. Body size, weight change, fat distribution and breast cancer risk in Hispanic and non-Hispanic white women. Breast Cancer Res Treat. Mar 2007; 102(1):85-101. 13. Wenten M, Gilliland FD, Baumgartner K, Samet JM. Associations of weight, weight change, and body mass with breast cancer risk in Hispanic and non-Hispanic white women. Ann Epidemiol. Aug 2002; 12(6):435-434. 14. Sweeney C, Baumgartner KB, Byers T, et al. Reproductive history in relation to breast cancer risk among Hispanic and non-Hispanic white women. Cancer Causes Control. May 2008; 19(4):391-401. 15. Martin JA, Hamilton BE, Sutton PD, et al. Births: final data for 2006. In: Statistics NCfH, ed57. US Dept of Health and Human Services; 2009:1-104. 16. Hausauer AK, Keegan TH, Chang ET, Clarke CA. Recent breast cancer trends among Asian/Pacific Islander, Hispanic, and African-American women in the US: changes by tumor subtype. Breast Cancer Res. 2007; 9(6):R90. 32 Cancer Facts & Figures for Hispanics/Latinos 2009-2011 17. National Center for Health Statistics. Health, United States, 2007 With Chartbook on Trends in the Health of Americans. Hyattsville, MD2007. 18. Fejerman L, John EM, Huntsman S, et al. Genetic ancestry and risk of breast cancer among U.S. Latinas. Cancer Res. Dec 1 2008; 68(23):9723-9728. 19. Hines LM, Risendal B, Slattery ML, Baumgartner KB, Giuliano AR, Byers T. Differences in estrogen receptor subtype according to family history of breast cancer among Hispanic, but not nonHispanic White women. Cancer Epidemiol Biomarkers Prev. Oct 2008; 17(10):2700-2706. 20. Risendal B, Hines LM, Sweeney C, et al. Family history and age at onset of breast cancer in Hispanic and non-Hispanic white women. Cancer Causes Control. Dec 2008; 19(10):1349-1355. 21. Lantz PM, Mujahid M, Schwartz K, et al. The influence of race, ethnicity, and individual socioeconomic factors on breast cancer stage at diagnosis. Am J Public Health. Dec 2006; 96(12):2173-2178. 22. Surveillance, Epidemiology, and End Results (SEER) Program (www.seer.cancer.gov) SEER*Stat Database: Incidence - SEER 17 Regs Public-Use, Nov 2008 Sub (2000-2006) - Linked To County Attributes - Total U.S., 1969-2006 Counties, National Cancer Institute, DCCPS, Surveillance Research Program, Cancer Statistics Branch, released April 2009, based on the November 2008 submission. 23. Miller BA, Hankey BF, Thomas TL. Impact of sociodemographic factors, hormone receptor status, and tumor grade on ethnic differences in tumor stage and size for breast cancer in US women. Am J Epidemiol. Mar 15 2002; 155(6):534-545. 24. American Cancer Society. Cancer Prevention & Early Detection Facts & Figures 2009. Atlanta, GA: American Cancer Society; 2009. 25. Press R, Carrasquillo O, Sciacca RR, Giardina EG. Racial/ethnic disparities in time to follow-up after an abnormal mammogram. J Womens Health (Larchmt). Jul-Aug 2008; 17(6):923-930. 26. Jemal A, Clegg LX, Ward E, et al. Annual report to the nation on the status of cancer, 1975-2001, with a special feature regarding survival. Cancer. Jul 1 2004; 101(1):3-27. 27. Ward E, Halpern M, Schrag N, et al. Association of insurance with cancer care utilization and outcomes. CA Cancer J Clin. JanFeb 2008; 58(1):9-31. 28. Freedman RA, He Y, Winer EP, Keating NL. Trends in racial and age disparities in definitive local therapy of early-stage breast cancer. J Clin Oncol. Feb 10 2009; 27(5):713-719. 29. Bickell NA, Shastri K, Fei K, et al. A tracking and feedback registry to reduce racial disparities in breast cancer care. J Natl Cancer Inst. Dec 3 2008; 100(23):1717-1723. 30. Soto-Salgado M, Suarez E, Calo W, Cruz-Correa M, FigueroaValles NR, Ortiz AP. Incidence and mortality rates for colorectal cancer in Puerto Rico and among Hispanics, non-Hispanic whites, and non-Hispanic blacks in the United States, 1998-2002. Cancer. Apr 28 2009. 31. American Cancer Society. Colorectal Cancer Facts & Figures 2008-2010. Atlanta, GA: American Cancer Society; 2008. 32. Horner MJ, Ries LAG, Krapcho M, (eds). ea, eds. SEER Cancer Statistics Review, 1975-2006. Bethesda, MD: National Cancer Institute; 2009. 33. Smoking-attributable mortality, years of potential life lost, and productivity losses – United States, 2000-2004. MMWR Morb Mortal Wkly Rep. Nov 14 2008; 57(45):1226-1228. 34. Samet JM. The 1990 Report of the Surgeon General: The Health Benefits of Smoking Cessation. Am Rev Respir Dis. Nov 1990; 142(5):993-994. 35. Shavers VL, Brown M, Klabunde CN, et al. Race/ethnicity and the intensity of medical monitoring under ‘watchful waiting’ for prostate cancer. Med Care. Mar 2004; 42(3):239-250. 36. Canto MT, Chu KC. Annual cancer incidence rates for Hispanics in the United States: surveillance, epidemiology, and end results, 1992-1996. Cancer. Jun 1 2000; 88(11):2642-2652. 37. Al-Refaie WB, Tseng JF, Gay G, et al. The impact of ethnicity on the presentation and prognosis of patients with gastric adenocarcinoma. Results from the National Cancer Data Base. Cancer. Aug 1 2008; 113(3):461-469. 38. Shibata A, Parsonnet J. Stomach Cancer. In: Schottenfeld D, Fraumeni JF, eds. Cancer Epidemiology and Prevention. Third ed. New York: Oxford University Press; 2006:707-720. 39. Brown LM. Helicobacter pylori: epidemiology and routes of transmission. Epidemiol Rev. 2000; 22(2):283-297. 40. Meuller NE, Birmann BM, Parsonnet J, Schiffman MH, Stuver SO. Infectious Agents. In: Schottenfeld D, Fraumeni JF, eds. Cancer Epidemiology and Prevention. Third ed. New York: Oxford University Press; 2006:531-534. 41. Donato F, Boffetta P, Puoti M. A meta-analysis of epidemiological studies on the combined effect of hepatitis B and C virus infections in causing hepatocellular carcinoma. Int J Cancer. Jan 30 1998; 75(3):347-354. 42. London WT, McGlynn KA. Liver Cancer. In: Schottenfeld D, Fraumeni JF, eds. Cancer Epidemiology and Prevention. Third ed. New York: Oxford University Press; 2006:763-786. 43. Armstrong GL, Wasley A, Simard EP, McQuillan GM, Kuhnert WL, Alter MJ. The prevalence of hepatitis C virus infection in the United States, 1999 through 2002. Ann Intern Med. May 16 2006; 144(10):705-714. 44. Buchschacher GL, Wong-staal F. Etiology of Cancer: Viruses, Section One, RNA Viruses. In: DeVita VT, Hellman S, Rosenberg SA, eds. Cancer Principles & Practice of Oncology. Seventh ed. Philadelphia: Lippincott Williams & Wilkins; 2005:165-173. 45. GLOBOCAN 2002: Cancer Incidence, Mortality and Prevalence Worldwide IARC CancerBase No. 5. [computer program]. Version 2.0. Lyon: IARC Press; 2004. 46. Kamangar F, Dores GM, Anderson WF. Patterns of cancer incidence, mortality, and prevalence across five continents: defining priorities to reduce cancer disparities in different geographic regions of the world. J Clin Oncol. May 10 2006; 24(14):2137-2150. 47. Watson M, Saraiya M, Benard V, et al. Burden of cervical cancer in the United States, 1998-2003. Cancer. Nov 15 2008; 113(10 Suppl):2855-2864. 48. Saslow D, Castle PE, Cox JT, et al. American Cancer Society Guideline for human papillomavirus (HPV) vaccine use to prevent cervical cancer and its precursors. CA Cancer J Clin. Jan-Feb 2007; 57(1):7-28. 49. Giuliano AR, Papenfuss M, Schneider A, Nour M, Hatch K. Risk factors for high-risk type human papillomavirus infection among Mexican-American women. Cancer Epidemiol Biomarkers Prev. Jul 1999; 8(7):615-620. 50. Dunne EF, Unger ER, Sternberg M, et al. Prevalence of HPV infection among females in the United States. JAMA. Feb 28 2007; 297(8):813-819. 51. Reynolds D. Cervical cancer in Hispanic/Latino women. Clinical Journal of Oncology Nursing. 2004; 8(2):146-150. 52. International Agency for Research on Cancer. Cervix Cancer Screening Lyon 2005. 53. Randi G, Franceschi S, La Vecchia C. Gallbladder cancer worldwide: geographical distribution and risk factors. Int J Cancer. Apr 1 2006; 118(7):1591-1602. 54. Goodman MT, Yamamoto J. Descriptive study of gallbladder, extrahepatic bile duct, and ampullary cancers in the United States, 1997-2002. Cancer Causes Control. May 2007; 18(4):415-422. 55. Hsing AW, Rashid A, Devesa SS, Fraumeni JFJ. Biliary Tract Cancer. In: Schottenfeld D, Fraumeni JF, eds. Cancer Epidemiology and Prevention. Third ed. New York: Oxford University Press; 2006:787-800. 56. Larsson SC, Wolk A. Obesity and the risk of gallbladder cancer: a meta-analysis. Br J Cancer. May 7 2007; 96(9):1457-1461. 57. US Census Bureau, Population Division. Annual Estimates of the Population by Sex, Race and Hispanic or Latino Origin for the United States: April 1, 2000 to July 1, 2007. 58. Pullarkat ST, Danley K, Bernstein L, Brynes RK, Cozen W. High lifetime incidence of adult acute lymphoblastic leukemia among Hispanics in California. Cancer Epidemiol Biomarkers Prev. Feb 2009; 18(2):611-615. 59. Yamamoto JF, Goodman MT. Patterns of leukemia incidence in the United States by subtype and demographic characteristics, 1997-2002. Cancer Causes Control. May 2008; 19(4):379-390. 60. Linabery AM, Ross JA. Trends in childhood cancer incidence in the U.S. (1992-2004). Cancer. Jan 15 2008; 112(2):416-432. 61. Linabery AM, Ross JA. Childhood and adolescent cancer survival in the US by race and ethnicity for the diagnostic period 1975-1999. Cancer. Nov 1 2008; 113(9):2575-2596. 62. Ross JA, Spector LG. Cancers in Children. In: Schottenfeld D, Fraumeni JF, eds. Cancer Epidemiology and Prevention. Third ed. New York: Oxford University Press; 2006:1251-1268. 63. Surveillance Research Program, National Cancer Institute SEER*Stat software (www.seer.cancer.gov/seerstat) version 6.5.1. [computer program]. 64. Wilkinson JD, Fleming LE, MacKinnon J, et al. Lymphoma and lymphoid leukemia incidence in Florida children: ethnic and racial distribution. Cancer. Apr 1 2001; 91(7):1402-1408. 65. US Census Bureau, 2007 American Community Survey. 2007. Accessed May 7, 2009. 66. Institute of Medicine. Committee on the Consequences of Uninsurance. Series of reports: Coverage matters: insurance and health care; Care without coverage; Health insurance is a family matter; A shared destiny: community effects of uninsurance; Hidden costs, value lost: uninsurance in American. National Academy Press, Washington, DC. 2001-2003. 67. Sherrill W, Crew L, Mayo R, Mayo W, Rogers B, Haynes D. Educational and health services innovation to improve care for rural Hispanic communities in the USA. Rural Remote Health. 2005; 5(4):402-411. 68. Escarce J, Kapur K. Access to and Quality of Health Care. In Hispanics and the Future of America. Eds. Marta Tienda and Faith Mitchell. pp.410-415. Committee on Transforming Our Common Destiny, National Research Council National Academy Press, Washington, DC. 2006. 69. Goode TD, Dunne MC, Bronheim SM. The Evidence Base for Cultural and Linguistic Competency in Health Care: Georgetown University; October 2006. 70. National Alliance for Hispanic Health. Quality Health Services for Hispanics: The Cultural Competency Component 2001. Cancer Facts & Figures for Hispanics/Latinos 2009-2011 33 71. Diaz V. Cultural factors in preventive care: Latinos. Prim Care Clin Office Pract. 2002; 29:503-517. 72. Colditz GA, Atwood KA, Emmons K, et al. Harvard report on cancer prevention volume 4: Harvard Cancer Risk Index. Risk Index Working Group, Harvard Center for Cancer Prevention. Cancer Causes Control. Jul 2000; 11(6):477-488. 73. Centers for Disease Control and Prevention. Reducing Tobacco Use: A Report of the Surgeon General, 2000. US Department of Health and Human Services. Washington, DC. 2000. 74. Bethel J, Schenker M. Acculturation and smoking patterns among Hispanics: a review. Am J Prev Med. 2005; 29(2):143-148. 75. National Health Interview Survey, 2006-7, Sample adult file, National Center for Health Statistics, Centers for Disease Control and Prevention. Available at cdc.gov/nchs/nhis.htm. 2007. 76. Hyland A, Rezaishiraz H, Bauer J, Giovino GA, Cummings KM. Characteristics of low-level smokers. Nicotine Tob Res. 2005; 7(3):461-468. 77. Fiore M, Bailey W, Cohen S. Treating Tobacco Use and Dependence. US Department of Health and Human Services. Public Health Services. Rockville, Md.2000. 78. Cokkinides VE, Halpern MT, Barbeau EM, Ward E, Thun MJ. Racial and ethnic disparities in smoking-cessation interventions: analysis of the 2005 National Health Interview Survey. Am J Prev Med. 2008; 34(5):404-412. 79. Levinson AH, Borrayo EA, Espinoza P, Flores ET, PérezStable EJ. An exploration of Latino smokers and the use of pharmaceutical aids. Am J Prev Med. 2006; 31(2):167-171. 80. Perez-Stable E, Marin G, Posner S. Ethnic comparison of attitudes and beliefs about cigarette smoking. J Gen Intern Med. 1998; 13(3):167-174. 81. Zhu S, Nguyen Q, Cummins S, Wong S, Wightman V. Nonsmokers seeking help for smokers: a preliminary study. Tob Control. 2006; 15(2):107-113. 82. Sias JJ, Urquidi UJ, Bristow ZM, Rodriguez JC, Ortiz M. Evaluation of smoking cessation behaviors and interventions among Latino smokers at low-income clinics in a US-Mexico border county. Addict Behav. 2008; 33(2):373-380. 83. Rhodes SD, Foley KL, Zometa CS, Bloom FR. Lay health advisor interventions among Hispanics/Latinos: a qualitative systematic review. Am J Prev Med. 2007; 33(5):418-427. 84. Centers for Disease Control and Prevention. Cigarette Use Among High School Students – United States, 1991-2007. MMWR Morb Mortal Wkly Rep. 2008;57(25):689-691. 85. Caraballo R, Lin Yee S, Gfroerer J, Pechacek T, Henson R. Tobacco Use Among Racial and Ethnic Populations subgroups of Adolescents in the United States. Prev Chronic Dis. 2006;3(2):1-11. 86. Centers for Disease Control and Prevention. Cigarette smoking among adults – United States, 2007. MMWR Morb Mortal Wkly Rep. 2009;57(45):1221-1226. 87. Zhu SH, Pulvers K, Zhuang Y, Baezconde-Garbanati L. Most Latino smokers in California are low-frequency smokers. Addiction. 2007;102(Suppl 2):104-111. 88. US Department of Health and Human Services. Tobacco Use Among Racial/Ethnic Groups- African Americans, American Indian and Alaska Natives, Asian Americans and Pacific Islanders, and Hispanics: Report of the Surgeon General. Atlanta, GA: US Department of Health and Human Services, Centers for Disease Control and Prevention; 1998. 89. Tauras JA. Differential impact of state tobacco control policies among race and ethnic groups. Addiction. 2007;102(Suppl 2):95-103. 34 Cancer Facts & Figures for Hispanics/Latinos 2009-2011 90. Stoddard J, Johnson C, Sussman S, Dent C, Boley-Cruz T. Tailoring outdoor tobacco advertising to minorities in Los Angeles County. J Health Commun. 1998; 3(2):137-146. 91. Fernandez S, Hickman N, Klonoff EA. Cigarette advertising in magazines for Latinas, White women, and men, 1998-2002: a preliminary investigation. J Community Health. 2005; 30(2):141151. 92. Acevedo-Garcia D, Barbeau E, Bishop JA, Pan J, Emmons KM. Undoing an epidemiological paradox: the tobacco industry’s targeting of US Immigrants. Am J Public Health. 2004; 94(12):21882193. 93. Centers for Disease Control and Prevention. Best Practices for Comprehensive Tobacco Control Programs – 2007. Atlanta, GA: US Department of Health and Human Services, Centers for Disease Control and Prevention, National Center for Chronic Disease Prevention and Health Promotion, Office of Smoking and Health. 2007. 94. Campaign for Tobacco-Free Kids. A Decade of Broken Promises: The 1998 State Tobacco Settlement Ten Years Later, Washington, DC: National Center for Tobacco-Free Kids. 2008. 95. Boffetta P, Hashibe M, La Vecchia C, Zatonski W, Rehm J. The burden of cancer attributable to alcohol drinking. Int J Cancer. 2006; 119:884-887. 96. Doll R, Forman D, La Vecchia C, Woutersen R. Alcoholic beverages and cancers of the digestive tract and larynx. In: Mcdonald I, (Editor). Health issue related to alcohol consumption. Second Ed. Oxford: Blackwell. 1995. 97. Schatzkin A, Longnecker M. Alcohol and breast cancer. Where are we now and where do we do from here? Cancer 1994; 74:1101-1110. 98. Marin G, Marin M. Differential perceptions of drinkers of alcoholic beverages by Mexican-Americans and non-Hispanic whites. Subst Use Misuse. 1997; 32(10):1369-1384. 99. Slone LB, Norris FH, Gutiérrez Rodriguez F, Gutiérrez Rodriguez Jde J, Murphy AM, Perilla JL. Alcohol use and misuse in urban Mexican men and women: An Epidemiologic perspective. Drug Alcohol Depend. 2006; 85(2):163-170. 100. Komro KA, Perry CL, Veblen-Mortenson S, Farbakhsh K, Toomey TL, Stigler MH, Jones-Webb R, Kugler KC, Pasch KE, Williams CL. Outcomes from a randomized controlled trial of a multi-component alcohol use preventive intervention for urban youth: project northland Chicago. Addiction. 2008; 103(4):606-618. 101. Rowe CL, Liddle HA. Family-based treatment development for adolescent alcohol abuse. Int J Adolesc Med Health. Jan-Mar;18. 2006; 18(1):43-51. 102. Copello AG, Velleman RD, Templeton LJ. Family interventions in the treatment of alcohol and drug problems. Drug Alcohol Rev. 2005; 24(4):369-385. 103. International Agency for Research on Cancer. Handbook of Cancer Prevention, Vol 6. Weight Control and Physical Activity. International Agency for Research on Cancer (IARC) Lyon, France 2002. 104. Ogden C, Carroll M, Curtin L, McDowell M, Tabak C, Flegal K. Prevalence of overweight and obesity in the United States, 1999-2004. JAMA. 2006; 295(13):1549-1555. 105. Ogden C, Carroll MD, McDowell MA, Flegal KM. NCHS Data Brief Obesity among adults in the United States: No statistically significant change since 2003-2004: National Center for Health Statistics, CDC, USDHHS;2007. 106. US Department of Health and Human Services. The Surgeon General’s Call to Action to Prevent and Decrease Overweight and Obesity. Washington, DC: US Department of Health and Human Services. 2001. 107. Kushi LH, Byers T, Doyle C, et al. American Cancer Society Guidelines on Nutrition and Physical Activity for cancer prevention: reducing the risk of cancer with healthy food choices and physical activity. CA Cancer J Clin. 2006; 56(5):254-281. 108. Institute of Medicine. Preventing Childhood Obesity: Health in the Balance. (Eds.) Koplan JP, Liverman CT, Kraak VI. Institute of Medine, Washington, DC. 2005. 109. Serdula M, Ivery D, Coates R, Freedman D, Williamson D, Byers T. Do obese children become obese adults? A review of the literature. Prev Med. 1993; 22:167-177. 110. Dietz W. Health consequences of obesity in youth: Childhood predictors of adult disease. Pediatrics. 1998; 105:518-525. 111. Odgen CL, Flegal KM, Carroll MD, Johnson C. Prevalence and trends in overweight among US children and adolescents, 19992000. JAMA. 2002; 288(14):1723-1737. 112. Gortmaker S, Peterson K, Wiecha J, et al. Reducing obesity via a school-based interdisciplinary intervention among youth: Planet Health. Arch Pediatr Adolesc Med. 1999; 153(4):409-418. 113. Ogden CL, Carroll MD, Flegal KM. High body mass index for age among US children and adolescents, 2003-2006. JAMA. 2008; 299(20):2401-2405. 114. Balcazar H, Alvarado M, Hollen ML, Gonzalez-Cruz Y, Hughes O, Vazquez E, Lykens K. Salud Para Su Corazon-NCLR: a comprehensive Promotora outreach program to promote hearthealthy behaviors among hispanics. Health Promot Pract. 2006; 7(1):68-77. 115. Collins JL, Wechsler H. The VERB™ Campaign Not About Health, All About Fun: Marketing Physical Activity to Children. Am J Prev Med. 2008; 36 (Suppl 6):S171-S172 116. Sallis JF, Glanz K. Physical Activity and Food Environments: Solutions to the Obesity Epidemic. Milbank Quarterly. 2009; 87(1):123-154. 117. Powell LM, Chaloupka FJ, Slater SJ, Johnston LD, O’Malley PM. The availability of local-area commercial physical activityrelated facilities and physical activity among adolescents. Am J Prev Med. 2007; 33(4 Suppl):S292-300. 118. Paso del Norte Health Foundation, Newsletter 2006. New Study Shows Drop in Obesity Rates for El Paso Children, Data are from the School Physical Activity and Nutrition (SPAN) survey, El Paso, TX, Available at pdnhf.org/documents/476pnhfjuly06.pdf (Accessed on May 14, 2009). 119. Desjardins E, Schwartz AL. Collaborating To Combat Childhood Obesity. Health Affairs. 2007; 26 (no 2):567-571. 120. Smith RA, Cokkinides V, Brawley OW. Cancer Screening in the U.S., 2009: A Review of Current American Cancer Society Guidelines and Issues in Cancer Screening. CA Cancer J Clin. 2009; 59(1):27-41. 121. Breen N, Wagener DK, Brown ML, Davis WW, BallardBarbash R. Progress in cancer screening over a decade: results of cancer screening from the 1987, 1992, and 1998 National Health Interview Surveys. J Natl Cancer Inst. Nov 21 2001; 93(22):1704-1713. 122. Breen N, A Cronin K, Meissner HI, Taplin SH, Tangka FK, Tiro JA, McNeel TS. Reported drop in mammography : is this cause for concern? Cancer. 2007; 109(12):2405-2409. 123. Otero-Sabogal R, Owens D, Canchola J, Golding JM, Tabnak F, Fox P. Mammography rescreening among women of diverse ethnicities: patient, provider, and health care system factors. J Health Care Poor Underserved. Aug 2004; 15(3):390-412. 124. Smith-Bindman R, Miglioretti D, Lurie N, et al. Does utilization of screening mammography explain racial and ethnic differences in breast cancer? Ann Intern Med. 2006; 144(8):541-553. 125. Saslow D, Runowicz C, Solomon D, et al. American Cancer Society guideline for the early detection of cervical neoplasia and cancer. CA Cancer J Clin. 2002; 52(6):342-362. 126. Jerant AF AR, Franks P. Factors associated with Hispanic/ non-Hispanic white colorectal cancer screening disparities. J Gen Intern Med. 2008; 23(8):1241-1245. 127. Jerant AF, Fenton JJ, Franks P. Determinants of racial/ethnic colorectal cancer screening disparities. Arch Intern Med. 2008; 168(12):1317-1324. 128. Phillips K, Mayer M, Aday L. Barriers to care among racial/ ethnic groups under managed care. Health Aff. 2000; 19(4):65-75. 129. Makoul G, Cameron KA, Baker DW, Francis L, Scholtens D, Wolf MS. A multimedia patient education program on colorectal cancer screening increases knowledge and willingness to consider screening among Hispanic/Latino patients. Patient Educ Couns. 2009; Aug;76(2):220-226. 130. Cameron KA, Francis L, Wolf MS, Baker DW, Makoul G. Investigating Hispanic/Latino perceptions about colorectal cancer screening: a community-based approach to effective message design. Patient Educ Couns. 2007; 68(2):145-152. 131. Chin MH, Walters AE, Cook SC, Huang ES. Interventions to reduce racial and ethnic disparities in health care. Med Care Res Rev. 2007; 64(5 suppl):7S-28S. 132. Fisher TL, Burnet DL, Huang ES, Chin MH, Cagney KA. Cultural leverage: interventions using culture to narrow racial disparities in health care. Med Care Res Rev. 2007; 64(5 suppl):243S282S. 133. Halle M, Lewis CB, Seshamani M. Health Disparities: a case for closing the gap. 2009; healthreform.gov/reports/ healthdisparities/index.html. Accessed June 11, 2009. 134. Centers for Disease Control and Prevention. Tobacco use, access, and exposure to tobacco in media among middle and high school students – United States, 2004. MMWR Morb Mortal Wkly Rep. April 1 2005; 54(12). 135. Joinpoint Regression Program, Version 3.0. April 2005; Statistical Research and Applications Branch, National Cancer Institute [computer program] 2006. 136. NAACCR Latino Research Work Group. NAACCR Guideline for Enhancing Hispanic/Latino Identification: Revised NAACCR Hispanic/Latino Identification Algorithm [NHIA v2]. Springfield (IL): North American Association of Central Cancer Registries. September 2005. 137. Pinheiro PS, Sherman RL, Trapido EJ, et al. Cancer incidence in first generation U.S. Hispanics: Cubans, Mexicans, Puerto Ricans, and new Latinos. Cancer Epidemiol Biomarkers Prev. Aug 2009; 18(8):2162-2169. Cancer Facts & Figures for Hispanics/Latinos 2009-2011 35 Chartered Divisions of the American Cancer Society, Inc. California Division, Inc. 1710 Webster Street Oakland, CA 94612 (510) 893-7900 (O) (510) 835-8656 (F) Eastern Division, Inc. (NJ, NY) 6725 Lyons Street East Syracuse, NY 13057 (315) 437-7025 (O) (315) 437-0540 (F) Florida Division, Inc. (including Puerto Rico operations) 3709 West Jetton Avenue Tampa, FL 33629-5146 (813) 253-0541 (O) (813) 254-5857 (F) Puerto Rico Calle Alverio #577 Esquina Sargento Medina Hato Rey, PR 00918 (787) 764-2295 (O) (787) 764-0553 (F) Great Lakes Division, Inc. (MI, IN) 1755 Abbey Road East Lansing, MI 48823-1907 (517) 332-2222 (O) (517) 664-1498 (F) Great West Division, Inc. (AK, AZ, CO, ID, MT, ND, NM, NV, OR, UT, WA, WY) 2120 First Avenue North Seattle, WA 98109-1140 (206) 283-1152 (O) (206) 285-3469 (F) Midwest Division, Inc. (IA, MN, SD, WI) 8364 Hickman Road Suite D Des Moines, IA 50325 (515) 253-0147 (O) (515) 253-0806 (F) High Plains Division, Inc. (including Hawaii operations, KS, MO, NE, OK, TX) 2433 Ridgepoint Drive Austin, TX 78754 (512) 919-1800 (O) (512) 919-1844 (F) New England Division, Inc. (CT, ME, MA, NH, RI, VT) 30 Speen Street Framingham, MA 01701-9376 (508) 270-4600 (O) (508) 270-4699 (F) Hawaii Pacific Division, Inc. 2370 Nuuana Avenue Honolulu, HI 96817 (808) 595-7500 (O) (808) 595-7502 (F) Illinois Division, Inc. 225 N. Michigan Avenue Suite 1200 Chicago, IL 60601 (312) 641-6150 (O) (312) 641-3533 (F) Mid-South Division, Inc. (AL, AR, KY, LA, MS, TN) 1100 Ireland Way Suite 300 Birmingham, AL 35205-7014 (205) 930-8860 (O) (205) 930-8877 (F) Ohio Division, Inc. 5555 Frantz Road Dublin, OH 43017 (614) 889-9565 (O) (614) 889-6578 (F) Pennsylvania Division, Inc. Route 422 and Sipe Avenue Hershey, PA 17033-0897 (717) 533-6144 (O) (717) 534-1075 (F) South Atlantic Division, Inc. (DC, DE, GA, MD, NC, SC, VA, WV) 250 Williams Street Atlanta, GA 30303 (404) 816-7800 (O) (404) 816-9443 (F) ©2009 American Cancer Society, Inc. No. 862309

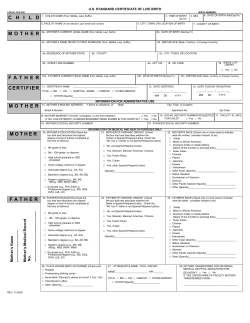


© Copyright 2026