
ELEcTric vEHicLES reALLy ON trACK?
Electric vehicles //////// Research paper //////// Electric vehicleS REALLY ON TRACK? Emmanuelle Ostiari SRI Analyst, Mirova November 2012 INTRODUCTION Even though transport is today responsible for half the world’s petroleum consumption and roughly 15% of greenhouse gas emissions, alternative solutions still remain underdeveloped. The electric vehicle, the figurehead of low carbon transport solutions, responds to the challenges of a more sustainable mobility by a reduction in CO2 emissions and by not being dependent on oil. This technology is already the object of massive investment by car and auto part manufacturers. Numerous models have been marketed and will continue to flourish. United States Leaf (Nissan) – 2010 I-MiEV (Mitsubishi) – 2011 Focus Electrique (Ford) – 2011 Fit EV (Honda) – 2012 Roadster (Tesla) – 2008 Europe Japan I- MiEV (Mitsubishi) – 2011 C-Zéro (Citroën) – 2011 Ion (Peugeot) – 2011 Mia (Mia Electric) – 2012 Leaf (Nissan) – 2011 Fortwo ED (Smart) – 2012 Fluence ZE (Renault) – 2011 Twizy (Renault) – 2011 Roadster (Tesla) – 2010 or Citroën ‘Saxo’ electric (1997), expectations for the electric vehicle have so far remained quite high. It seems premature, on the basis of only these experiences, to conclude that the automobile sector is taking the wrong road with the electric path. Although this relative failure could be blamed on a price that is still too high, or on a lack of confidence in models which are still perceived as ‘not mature’, we believe that technological developments are still numerous and encouraging, and should lead to a much stronger presence of electric vehicles on the road to a more sustainable future. In this critical period for the electric vehicle, we propose to revisit the advantages expected from this type of model, the obstacles to its deployment and the technological evolution under study. This analysis of the risks and solutions across the entire value chain will provide us with a better understanding of the circumstances under which the electric vehicle is tenable, and of the firms which could deploy the appropriate technological and organisational levers to reduce or circumvent the obstacles to the development of the electric vehicle. I-MiEV (Mitsubishi) – 2010 Leaf (Nissan) – 2010 Electricity production Electric Charging Electricity transmission and distribution Main barriers to electric vehicle development Infrastructure Importance of the barriers Source: Natixis Asset Management. Figure 1: Electric vehicle markets Vehicle design Storage batteries However, at this stage, we have to admit that electric vehicle sales have not taken off, despite an enticing positioning as regards environmental challenges. Less than two years after the launching of their electric models, Peugeot and Citroën, who sold approximately 7,000 models, are attempting to drastically lower sale prices to dispose of their stocks. Mia Electric, which designs only electric vehicles, is hardly surviving and is basing its hopes on requests for proposals from large private groups. Even though Nissan reached the threshold of 37,000 vehicles sold with the ‘Leaf’ model, they are increasingly worried by the slippage in their objectives, notably in the United States. Incidentally, the American economic situation is no more favourable for General Motors, which is selling way below the initial objectives with the Chevrolet ‘Volt’, the range extender electric model, the production of which is regularly shut down due to overstocks. Despite the fact that sales have not been more impressive for older electric models, such as the Peugeot ‘106’ electric (1995) Equipment Anode Battery Motors Lithium production Cathode Metal production Automobile construction Source: Natixis Asset Management. Figure 2: Electric vehicle value chain Even though it is difficult to predict which technologies will be winners, we consider the electric vehicle value chain to be a promising source of investment which responds to the challenges of sustainable mobility. In addition to technological advancements, the rapidity of its development will depend also on other factors, such as general regulations on CO2 or those specific to the automobile, investment in the low carbon production of electricity, the adaptability of electric networks, and the setting up of adequate infrastructures to provide the electricity. 1 I The design of a petrol-less automobile: the electric sector 60 1 I 1 The electric vehicle – technology 60 1 I 2 Interesting environmental performance 62 1 I 3 Electric vehicles – still penalised for their economic performance 2 I Barriers to development CONteNtS //////// Research paper //////// Electric vehicles 65 66 2 I 1 Upstream: raw material resources 66 2 I 2 The storage battery: keystone of the sector 66 2 I 3 Downstream: production and distribution of electricity 72 Bibliography 75 1 i The design of a petrol-less automobile: the electric sector 1 i 1 The electric vehicle – technology a ‘new old’ technology ‘Breakthrough’ technologies must respond, both to the challenge of the depletion of resources by resorting to energy sources other than oil, and to the challenge of climate change by reducing CO2 emissions. the electric vehicle comprises a new type of propulsion using potentially different energy sources and, in this sense, is considered to be a breakthrough vehicle. However, the electric vehicle is not new technology. the first prototypes appeared in 1835, but the technology was really ‘democratised’ thanks to technological advancements in lead storage batteries from 1890. electric vehicles were then introduced in europe and the United States where they were used as city taxis. in 1894, Charles Jeantaud presented a two-seater electric vehicle called the ‘phaëton’. Although the first to participate in an automobile race, the ‘phaëton’ model was beaten by the ‘Jamais contente’ (Never satisfied) manufactured by Camille Jenatzy and equipped with Michelin tyres, which drove faster than 105 km/h in 1899 (iNA 1968). Despite a promising beginning, the slow progress made on batteries compared to the accelerated development of internal combustion engines relegated the electric vehicle to a position of secondary importance. Since petrol was cheap, the internal combustion engined vehicle became a means of personal transport and the electric vehicle, because of its poor range and high price, was forgotten from 1910 onwards. How electric vehicles work An electric vehicle, also called ‘Battery electrical vehicle’ (Bev), is propelled solely by an electric motor powered by the energy obtained from onboard batteries. the components of an electric vehicle are: an electric motor, a storage battery, a converter-inverter, a charger and a battery of a lower voltage with a DC/DC converter. the converter-inverter translates the various signals (acceleration, braking, etc.) to control the electric motor, i.e. either to convert mechanical energy into electrical energy, or vice versa, depending on the driving phase. the charger converts the mains network electricity into direct current to recharge the batteries. Finally, the low voltage battery draws from the storage battery via the DC/DC converter, to supply the auxiliary systems (air conditioning, radio, heating, etc.). Electric terminal Charger Electric motor Converter inverter 12 V Battery Storage battery DC/DC converter Source: Natixis Asset Management / ANFA, 2011. Figure 3: Components of an electric vehicle One of the characteristics of the electric motor is reversibility. it is capable of: ➜ producing a mechanical force from electricity during the traction phases ➜ producing electricity from a mechanical movement during the braking phases. this double capability allows electric vehicles to recover the energy produced during braking, and thus recharge the batteries. in fact, the movement of the wheels driven by the vehicle’s momentum produces electricity, which is recovered by the batteries. the electric vehicle differs from an internal combustion engine vehicle in that it has no clutch system, which means no gear shifting. the dynamic performance of this type of motor is superior to that of an internal combustion engine, with faster acceleration over a distance of 100 metres for two vehicles of the same type, and a smooth driving style with no risk of stalling and no engine noise. Electric vehicles //////// Research paper //////// there are currently three types of electric motor: ➜ asynchronous electric motors with an efficiency limited to ~80%, but at a lower cost ➜ synchronous electric motors with permanent magnet rotors, requiring rare earths ➜ synchronous electric motors with coil-wound rotors, more restrictive and costly in terms of electronics, but not requiring rare earth. Motor technologies Continuous Permanent Asynchronous current magnet Wound rotor motor motor rotor Manufacturers using this motor technology Not used on current models; this type of motor was present on electric models marketed during the 1990s. Better adapted for hybrid / electric vehicles: Tesla, Mia, Renault (Twizy), Chevrolet (Volt) Advantages Easy driving at high speed. Robust, Compact, Reliable, Low cost. Maintenance saving. Easy driving at high speed. Limited efficiency, high rotational speed, heat losses difficult to evacuate. Heat losses Efficiency limited to ~80% diminishing over time. Uses rare earth in the magnets. Restrictive in terms of maintenance. Requires an electrical contact with the rotor. Disadvantages Electric vehicles: PSA (ion and C-zero), Mitsubishi (MiEV), BMW (future ActiveE) Renault (Zoe, Fluence, Kangoo ZE), Bolloré (Bluecar) Hybrid vehicles: Toyota (Prius), PSA (Hybrid series) Source: Natixis Asset Management / Expert VE, 2012. Charger Storage battery Converter inverter Electric motor 12 V Battery DC/DC converter Fuel tank Generator Combustion engine Current generator Source: Natixis Asset Management / ANFA, 2011. Figure 4: Components of a range extender electric vehicle automobile and auto part manufacturers Currently, the key players with the largest presence in the electrical vehicle sector are: renault, Nissan, Chevrolet, tesla and Mia electric. even though pSA peugeot Citroën marketed two models designed by Mitsubishi, the group’s commitment is more evident on hybrid diesel and rechargeable hybrid vehicles. Few manufacturers produce batteries in house. the table below lists the existing partnerships. Battery manufacturers NEC/AESC LG Chem Table 1: Electric motor technologies Sanyo Electric (Panasonic) an alternative: the range extender electric vehicle the range extender electric vehicle, also called the ‘range extender Battery electrical vehicle’ (reBev), is also solely propelled by an electric motor. However, this model has onboard a current generator and a fuel tank to recharge the batteries over longer distances. the electric motor has a power rating below that of an electric vehicle motor. it has enough batteries to ensure a range of approximately 60 km in pure electric mode without the use of the internal combustion engine. So, with a full tank and a battery recharged beforehand, the vehicle can travel approximately 500 km (valeo 2010). its operation is very close to that of a rechargeable hybrid vehicle except for the propulsion, which is only electric in the case of a range extender electric vehicle. Fuel à Borne essence pump Electric terminal Electric vehicle manufacturers Model(s) Renault Fluence ZE(2011), Kangoo Express ZE (2011), Twizy (2011) Nissan Leaf Renault General Motors Hyundai Motor Ford Volvo Zoe (2012) Volt (2011) BlueOn (2012) Focus Electric (2013) C30 EV (2013) Toyota Ford IQ EV (2012) Fusion, C-Max, Fusion Energi, C-Max, Energi plug-in e-up (2013), Golf blue e-motion (2013) PHEV Swift Volkswagen Suzuki BMW Daimler GM Geely ActiveHybrid 3 HEV, ActiveHybrid 5 HEV Hybrid bus Chevrolet Spark EV PHEV sedan BMW Fiat PSA Peugeot Citroën Volkswagen Daimler Mini E e500 3008 HYbrid4 Porsche Cayenne, Touareg Hybrid N/A Honda Mitsubishi PSA Peugeot Citroën Fit / Jazz EV MiEV C-Zero, Peugeot Ion Hitachi GM Daimler Hybrid cars N/A Johnson Controls BMW Daimler Ford N/A N/A N/A Tesla Motors Roadster (2008), Model S (2013), Model X (2014) RAV4 EV Class B EV (2014), Classe A E Cell A123 Systems SB Limotive GS Yuasa – Lithium Energy Japan Tesla Motors Toyota Daimler (Mercedes) Source: Natixis Asset Management / manufacturers and battery manufacturers. Table 2: From battery to manufacturer //////// Research paper //////// Electric vehicles regardless of the electrical motor technology deployed, when we consider the life cycle of combustion and electrical energies as a whole, the electric vehicle’s efficiency1 is equivalent to that of a petrol vehicle. Considering the vehicle by itself, the maximum efficiencies are 35% for the petrol vehicle, 45% for the diesel vehicle and between 80% and 95% for the electric vehicle’s motor. However, to obtain real efficiencies, we should also integrate the losses due to: ➜ the extraction of raw materials (oil for combustion; gas, uranium, etc. for electric) ➜ the distribution from the central plant to the plug/pump ➜ the storage ➜ driving changes in the city or on the motorways ➜ the operation of the auxiliaries (heating, air conditioning, radio, and so on). 100% 80% 100% 60% 40% 20% 16% Useful energy Heat engine performance 0 Primary energy Aware of this opportunity and of the growth of its automobile market, China has set ambitious objectives to deploy the electric vehicle and place its manufacturers among the world’s best. Beyond the manufacturers, the internal combustion engine chain is affected as a whole: for example, the specialised auto part manufacturers (exhaust, foundry, engine parts, etc.) will experience a drop-off in their turnovers. Conversely, battery suppliers and auto part manufacturers specialising in making vehicles lighter will occupy an increasingly dominant place in the automobile sector. Transport and storage technical assessments of the electric vehicle focus on the battery and the motor. A technological breakthrough is important to manufacturers whose knowledge of the internal combustion engine is becoming less useful. the deployment process of the electric vehicle implies de facto a confrontation between manufacturing experts in auto mechanics for internal combustion engines and firms concerned with the electric model: electric motor manufacturers, battery makers, auto part manufacturers, chemical engineers, etc. With diesel or petrol vehicles, the positioning of the manufacturers with respect to one another was relatively established. the advent of the electric vehicle shook up the entire sector: the leading global manufacturers are finding themselves falling behind, and the newcomers will become the major players within ten years. Similar energy efficiency Fuel refining Automobile and auto part manufacturers are faced with major challenges relating not only to the electric motor and the lightening of the vehicles, but also to the management of the consumption of the auxiliaries (heating, air conditioning, radio, and so on). 1 i 2 interesting environmental performance Extraction of hydrocarbons Some conventional vehicle structure can be adapted to contain electric motors as well as storage batteries; however, automobile manufacturers are giving more and more priority to the design of specific chassis for electric vehicles, providing more range. vehicles can vary widely in the way they are organised, with an electric motor in the front or the rear of the vehicle, and the batteries located under the floorboard. Source: Natixis Asset Management / U.S. Department of Energy – Manicore, 2012. Figure 6: Energy efficiency of the combustion chain Auto parts manufacturers 100% Continental Denso Johnson Controls Plastic Omnium Stanley Electric Valeo 80% Toray Industries SGL Carbone BASF Rhodia 60% BYD Ford General Motors Hyundai Mitsubishi Nissan Renault Tesla Motors Toyota … 20% 100% 40% Auxiliaries systems use Electric engine performance Electric storage Electric distribution Nuclear plant performance Primary energy Useful energy 15% 0 Preparation of nuclear fuel Chemical engineers Miners Automobile manufacturers Source: Natixis Asset Management / U.S. Department of Energy – Manicore, 2012. Figure 7: Energy efficiency of the electric chain Sabic Arkema … Source: Natixis Asset Management. Figure 5: Vehicle design value chain (1) The energy efficiency of an engine or motor is the ratio between the energy supplied to the petrol engine or electric motor and the returned mechanical energy. To avoid useless energy losses, the optimising of this efficiency is a key research theme for manufacturers. Electric vehicles //////// Research paper //////// When we integrate all this data, the efficiency of the electric motor remains equivalent to that of a petrol engine. Energy expenditure is not the same for both chains. Thus, the losses of internal combustion engine vehicles are located in the automobile’s engine, with an efficiency of around 20% (which means that only 1⁄ 5 of the energy released by the fuel’s combustion is converted into mechanical energy, the rest being dissipated in the form of heat), while the electric chain is ineffective in terms of energy at the level of the central plant, whose efficiencies are around 30%. Note, also, that the energy used for the auxiliaries (heating in winter, headlights, windscreen wipers, radio, etc.) is more optimised for an internal combustion engine vehicle (which, for instance, reuses for heating the heat energy otherwise lost). An interesting carbon footprint The CO2 emissions generated by an electric vehicle are zero during the usage phase ‘from the plug to the wheel’. However, the emission of carbon dioxide per kWh of electricity produced varies from country to country, depending on the electrical mix. The production of electricity can come from multiple sources, for example, coal, oil, gas, nuclear or renewable energies. So the interest in terms of CO2 emissions depends heavily on the energy mixes. The table below points out the countries for which the electric vehicle represents an environmental opportunity. The consumption of an electric vehicle varies between 0.15 kWh/km (city car) and 0.25 kWh/km (utility vehicle). Multiplying this consumption by the CO 2 emissions per kWh of produced electricity, we obtain the CO2 emissions per kilometre travelled in gCO2/km. Electricity mix in 2008 Fossil Coal Gas Oil Considering that a petrol vehicle ‘from the well to the wheel’ is responsible for ~150 gCO2/km and that a diesel vehicle is responsible for ~135 gCO2/km, the electric vehicle only offers advantages in certain geographical zones. The deployment of the sector implies large investments which can discourage some manufacturers who have a mitigated carbon profit on their sales areas. On the other hand, we can see that the vehicle’s size has a great influence on the CO2 emissions generated. Both of these factors (electrical mix of the sales areas and range of proposed vehicles) can, in some cases, explain the differences in strategies applied by the manufacturers. For example, Renault is extremely interested in developing the electric vehicle with approximately 30% of its sales in France and market share in small vehicles. Nonetheless, to be complete, it is also necessary to include electric vehicle production in the life cycle analysis. In this respect, manufacturers are not giving out much information. In the case of an internal combustion engine vehicle, greenhouse gas emissions are generated for: ➜➜ production of the materials used (plastic, aluminium, glass, steel, rubber, liquids, electronics, etc.) ➜➜ assembly in the factory (movements of employees, freight, shutdowns, waste, R&D, etc.). Nuclear Hydraulic Renewable energy Emissions (CO2 /kWh) Emissions of CO2/km (0.15 kWh per km) Emissions of CO2/km (0.25 kWh per km) World 67% 41% 21% 5% 14% 16% 2% 446 67 111 North America 66% 43% 21% 2% 18% 13% 3% 446 67 111 USA 71% 49% 21% 1% 19% 6% 4% 488 73 122 Latin America 26% 3% 14% 15% 2% 63% 3% 177 27 44 Brasil 14% 3% 6% 4% 3% 80% 4% 88 13 22 EU 55% 28% 24% 3% 28% 10% 7% 346 49 81 Germany 62% 44% 13% 5% 23% 3% 12% 438 62 104 France 10% 6% 3% 1% 77% 11% 2% 80 12 20 Italy 79% 15% 45% 19% 0% 3% 18% 414 62 104 Russia 69% 19% 48% 2% 16% 16% 0% 361 54 90 Africa 83% 43% 28% 12% 2% 15% 0% 525 79 131 Middle East 99% 5% 58% 36% 0% 1% 0% 470 71 118 China 81% 79% 1% 1% 2% 17% 0% 645 97 161 South Korea 65% 39% 20% 7% 34% 1% 0% 430 65 108 Japan 66% 27% 26% 13% 24% 7% 3% 402 60 100 India 83% 69% 10% 4% 2% 14% 1% 618 93 154 Australia 93% 79% 10% 3% 0% 5% 2% 695 104 174 Source: Natixis Asset Management / International Energy Agency, 2010 / European Commission, 2012. Table 3: Electricity mix by country //////// Research paper //////// Electric vehicles ➜ CO2 emissions/km from ‘well to wheel’ in France for a vehicle consumption of 0.2 kWh/km: 16 gCO2/km3 ➜ CO2 emissions/km from ‘well to wheel’ in Germany for a vehicle consumption of 0.2 kWh/km: 83 gCO2/km ➜ CO2 emissions/km from ‘well to wheel’ in europe for a vehicle consumption of 0.2 kWh/km: 65 gCO2/km ➜ CO2 emissions/km from ‘well to wheel’ of a diesel vehicle: 135 gCO2/km (110 gCO2/km during the usage phase and 25 gCO2/km during the fuel production phase) ➜ Average service life: ~150,000 km ➜ percentage of the contribution of the support functions and logistics to the CO2 emissions in the global carbon footprint: 1.5% (renault, 2011). the details in Figure 8 show that an electric vehicle would reduce CO2 emissions by 20% with respect to a diesel vehicle over an average complete life cycle in europe. the production of an electric vehicle would then negatively compensate for a part of the CO2 emissions avoided during the usage. (2) CO2 emissions generated all through the life cycle: production of the vehicle, end of life of the vehicle, production of electricity, use of the vehicle, and logistics. (3) Natixis Asset Management, European Commission, 2012. 28 25 28 15 25 22 22 in circulation in EU) VE (produced and in circulation in VEEU) (produced and BEV (produced and in circulation in Germany) 0 BEV (produced and in circulation in Germany) 0 BEV (produced and in circulation in France) 15 BEV (produced and in circulation in France) 30 25 20 15 10 5 30 25 20 15 10 5 Diesel vehicle this calculation is not given for the electric vehicle. However, the emission factors are not the same. Automotive design platforms may be identical to those of the internal combustion engine vehicles or specific to an electric motorisation which optimises the vehicle’s performance, which is already impacting on the CO2 emissions during production. Moreover, the production of an electric vehicle, particularly with respect to the motor and the batteries, implies a supply of different raw materials and new manufacturing processes. renault issued an analysis of the life cycle2 of an electric vehicle of type Fluence Ze (renault, 2011). According to this document, the production of an electric vehicle in France generated 15 teCO2 globally, while a diesel vehicle type Laguna DCi 110 generates 28 teCO2. the bar graph and table in Figure 8 show the extent of the CO2 emissions due to the production of an electric vehicle subject to the following assumptions: renault’s aim is to sell its electric vehicles in France where the gain in CO2 is approximately 50%, but this calculation may explain the reluctance of some other manufacturers. However, these figures are to be reconsidered on account of the potential improvement of the energy mixes in many countries, as well as the increasing efficiency in the production of electric vehicles with economies of scale. Moreover, we do not have other data to confirm or invalidate these first results. Diesel vehicle For each tonne in an internal combustion engine vehicle, the emissions linked to the manufacture of the materials are estimated at 950 kgCO2eq, and for assembly, another 10% according to the French environment and energy Control Agency, ADeMe, which gives us ~1,500 kgCO2eq for a vehicle tonne (ADeMe/Carbon Balance Sheet of Companies and Communities, 2010). the service life of a vehicle is approximately 150,000–200,000 km. So if we consider an internal combustion engine vehicle with an unladen weight of 1,200 kg, we obtain between 9 and 12 gCO2eq/km. therefore, we can consider that ~10 kgCO2/km has to be added to obtain a global balance sheet of CO2 emissions for an internal combustion engine city car. Production of vehicle Logistics Production of fuel/electricity Usage of vehicle Production of vehicle Logistics Production of fuel/electricity Usage of vehicle Phases Usage of the vehicle Production of the fuel/ electricity* Support functions and logistics Production of vehicle from supply of raw materials to end of life Total Diesel vehicle 110 gCO2/km x 150,000 km = 16.5 tonnes 25 gCO2/km x 150,000 km = 3.8 tonnes 1,5% x 32 tonnes = 0.5 tonnes 28 tonnes – (16.5+3.8+0.5) tonnes = 7.2 tonnes de CO2 28 tonnes Electric (France) 0 tonne 16 gCO2/km x 150,000 km = 2.4 tonnes 1,5% x 32 tonnes = 0.5 tonnes 15 tonnes – (0+2.4+0.5) tonnes = 12.1 tonnes de CO2 15 tonnes Electric (Germany) 0 tonne 83 gCO2/km x 150,000 km = 12.5 tonnes 1,5% x 32 tonnes = 0.5 tonnes 12.1 tonnes** 25 tonnes Electric (EU) 0 tonne 65 gCO2/km x 150,000 km = 9.8 tonnes 1.5% x 32 tonnes = 0.5 tonnes 12.1 tonnes** 22.3 tonnes Figure 8: CO2 emissions from the production of an electric vehicle (tonnes) response to a health challenge talking only about CO2 emissions, some countries do not have a great interest in developing the electric vehicle without applying in parallel a strategy for lowering the carbon intensity at the level of electricity production. However, the electric vehicle also offers the advantage of not emitting polluting particles (fine particles, gases, odours, increases in exhaust fumes, and so on). According to the WHO, more than 1.4% of deaths in the world are probably induced by polluting particles in the air. they are also probably responsible for the reduction of 8.2 months in life expectancy in the eU 15, and 10.3 months in the new eU states. Fine particles of 2.5 micrometres in diameter (pM2.5) are the most dangerous. Many urban areas are supporting the fight against atmospheric pollution: urban tollgates, exemptions, reductions and subscription options are an additional argument in favour of the electric vehicle. Electric vehicles //////// Research paper //////// 1 I 3 Electric vehicles – still penalised for their economic performance The purchase price of the electric vehicle is higher than that of a vehicle with the same internal combustion engine size. New marketing options are thus proposed: ➜➜ vehicle purchase Moreover, in our calculation, we considered an average distance of 15,000 kilometres per year, that is, an average of approximately 40 kilometres per day. Below a number of daily kilometres, the difference between an internal combustion engine vehicle and an electric vehicle is intensified because the cost of the fuel per kilometre does not compensate for the initial cost of the battery. Thus, the electric vehicle is technically limited to trips shorter than about 150 kilometres, but must travel at least 40 kilometres to remain within a reasonable profitability scheme.5 In this context, company fleets appear to be the potential customers best suited for this type of vehicle. ➜➜ vehicle rental ➜➜ vehicle purchase and battery rental. As we can see in the table below, the global price of an electric vehicle over eight years varies from 27,000 to 50,000 euros. Thus, the electric vehicle remains more expensive than an internal combustion engine vehicle. These prices are to be re-evaluated based on the subsidies allotted by the governments supporting the development of cleaner mobility. Such governmental assistance can take several forms including, for example, purchase premiums and tax incentives. These are needed to accelerate the development of the sector. Another factor which is not in favour of the electric vehicle also has to be taken into consideration: this type of vehicle is marketed as a ‘secondary vehicle’; in fact, its usage being reduced to short distances implies a strong likelihood of needing another car for longer trips.4 However, it should not be overlooked that these subsidies are going to diminish. We think that the deployment of the electric vehicle sector will require technological advancements to significantly reduce the price of the batteries to render the electric vehicle affordable without subsidies. (4) On this point, Renault is considering commercial proposals to allow someone to rent an internal combustion engine vehicle for the duration of a trip and recover their electric vehicle on their return, thus eliminating the problem of long journeys. (5) General Council of Industry, Energy and Technology (CGIET), 2011. Table 4: Commercial supply of electric vehicles Electric vehicle Marketing mode Consumption (kWh/km or litres/100 km) Fuel costs (euros) Global price over 10 years or 150,000 km (€) Renault ‘Zoe’ Car purchase: €15,000 + rental of batteries for €100/month 0.15 kWh/km 2,340 26,940 Peugeot ‘Ion’ Car rental: €499/month 0.12 kWh/km 1,872 49,776 Citroën ‘C-zéro’ Car rental: €459/month for 4 years, and then €260/month for 4 years 0.12 kWh/km 1,872 36,384 BMW ‘Mini E’ Car rental: €475/month 0.21 kWh/km 3,276 48,876 0.12 kWh/km 3,024 35,038 0.15 kWh/km 3,780 29,205 5 litres/100km 7,800 € 22,000 € Mitsubishi ‘Mi-EV’ Nissan ‘Leaf’ Internal combustion engine Purchase and resale after 10 years = €32,700 – €5,486 Repairs/servicing = €4,800 Initial down payment of $1,999 (€1,425) + $349/month (€250/month) Purchase and resale after 8 years = €9,000€ Repairs / servicing = €5,000 Source: Natixis Asset Management. Assumptions Average kilometrage: ~15,000 km/year, that is, 120,000 kilometres travelled in eight years – Resale value calculation with a loss in value of 20% per year – Average electricity price in Europe: ~€13/100 kWh (Eurostat 2011) – Average electricity price in Japan: ~ €21 /kWh (Fournisseur électricité 2010) – Fuel expenditure: (consumption x 120,000 km x price of electricity) – Average cost in repairs/servicing = €600/year //////// Research paper //////// Electric vehicles 2 IBarriers to development supply. Given that reserves are moderate and not rare and that recycling capacities should improve, we do not consider that copper can limit the development of the electric vehicle. 2 I 1 Upstream: raw material resources Vehicle structure Electric vehicles are benefitting more and more from specific chassis to optimise performance and range. Here, space and weight gains are top priority. In this context, the auto part manufacturers must integrate lighter materials, such as carbon fibre and plastic. These new components will also face their own challenges in terms of resources, recycling and environmental footprints. These factors must be taken into account by auto part and automobile manufacturers. Electric motors and electrical circuits To sum up, these last two resources do not pose any problem in terms of reserves, but only in terms of supply. The difficulties can be circumvented by a more significant investment in production. The analysis of the potential limits on the resources used in storage batteries is presented later in the next section (see ‘Raw materials: the most decisive barrier in the choice of technologies’ later in this article). 2 I 2 The storage battery: keystone of the sector Various battery technologies coexist Rare earth elements (REEs) The manufacture of synchronous electric motors with permanent magnets requires the use of rare earth elements (neodymium). 97% of the production of REEs comes from China, which is reducing its exports little by little to give priority to its own internal demand. China holds only 50% of the world reserves (USGS, 2012), but has set up large storage capacities to eventually control the market of technologies depending on REEs. Thus, this resource does not pose any problems in terms of reserves, but remains uncertain in terms of supply. A European Commission Report published in 2010 lists neodymium as one of the most critical raw materials for the EU economy. Early in 2011, Chinese authorities announced China’s intention to limit the quantity exported to 14,446 tonnes in 2011, and to subsequently set up annual export quotas in accordance with the rules of the World Trade Organization. China also has the advantage of knowing the separation processes indispensable for the production of REEs. It will take a long time for other countries to catch up with this know-how. However, reserves of REEs are present in many other places, including the Commonwealth of Independent States, United States, India and Australia. Many of them are already investing in rare earth mines. As a result, this topic must continue to be watched to ensure the supply of REEs and avoid slowing down the deployment of the electric sector. Recourse to another type of motor not requiring REEs also remains possible: the synchronous motor with coiled rotor (more demanding and costly in terms of electronics). Copper The supply of copper used in electrical circuits (and in lithiumion batteries) can also prove complicated due to an increasing demand, notably from China, and in view of variable levels of copper production. An electric vehicle uses twice as much copper (~50 kg) as an internal combustion engine vehicle.5 However, these considerations are limited to the (5) General Council of Industry, Energy and Technology (CGIET), 2011. To store the produced electrical energy, this type of vehicle has to contain a storage battery. The first batteries were made of lead. Today, several technologies are competing with different characteristics relating to: ➜➜ the usable power corresponding to the motor’s peak power ➜➜ the specific energy corresponding to the quantity of energy stored per kg of battery and, indirectly, to the vehicle’s range ➜➜ the operating temperature range ➜➜ the number of cycles corresponding to the service life and cost per kWh. Table 5 summarises the characteristics of the main batteries in use in the electric vehicle. Considering the elements presented in the table, we can see that: ➜➜ lead (pb) batteries continue to used, particularly for scooters and electric bikes, or for forklifts ➜➜ nickel-cadmium (Ni-Cd) batteries can no longer be used for reasons of toxicity ➜➜ nickel metal hydride (Ni-Mh) batteries are used extensively for hybrid vehicles (Toyota Prius, Toyota Auris, BMW X6, etc.), but are not suitable for electric vehicles or rechargeable hybrids which require power batteries capable of storing much more energy (insufficient range) and longer charge/discharge cycles ➜➜ zebra batteries (installed in the CITROEN/VENTURI Berlingo used by the French postal system) do not have sufficient power to be suitable for electric vehicles with more and more powerful motors ➜➜ lithium-ion (LiCoO2) batteries are the most widely used on current generations of electric vehicles Electric vehicles //////// Research paper //////// Table 5: Battery characteristics Batteries Pb Ni-Cd Ni-Mh Zebra LiCoO2 Li-Po LiFePO4 LPM Date of appearance ~1850 ~1900 ~1990 ~1990 <2000 <2000 <2000 <2000 Specific energy (Wh/kg) 40 50 80 120 150 190 120 110 Peak power (W/kg) 700 - 900 150 1,500 250 800 - Number of cycles ~500 1,500 1,000 1,000 1,200 2,000 2,000 1,800 Costs (€/kWh) ~200 ~600 ~1,500 ~500 ~500 ~1,500 ~1,000 ~1,500 Advantages Low cost Reliability Cyclability (i.e. service life) Specific energy, cyclability Specific energy, power Space gains Cyclability Space gains Limits High toxicity of lead,1 Low specific energy (i.e. short range) High toxicity of cadmium,2 Low specific energy, Memory effect Cost, Uses rare earths (e.g. lanthanum), Self discharge capacity (30%) Limited power, High self-discharge (12%/day) Cost, Requires a BMS3 to prevent risks of explosion Limited power, Cost Problem of temperatures for charging Cost, Low temperature performance Source: Natixis Asset Management / ANFA, 2011 / General Council of Industry, Energy and Technology (CGIET), 2011/ ADEME, 2005 / Mines-Energie, 2005. (1) Recycling lead batteries has a disastrous effect on the health of populations in charge of recycling. The Blacksmith report has identified it as the most toxic industrial activity in terms of the number of years of life lost (Blacksmith Institute, 2012). • (2) Official journal of the EU, ‘Directive 2002/95/EC of the European Parliament and of the Council of 27 January 2003 on the restriction of the use of certain hazardous substances in electrical and electronic equipment’. See: http://eur-lex.europa.eu/LexUriServ/LexUriServ.do?uri=OJ:L:2003:037:0019:002 3:en:PDF. • (3) The Battery Management System (BMS) ensures temperature control and removes the risk of explosions. ➜ lithium-polymer (Li-po) batteries, still expensive, are mainly used on small models (mobiles, laptops), but are also beginning to appear on electric bikes and electric cars (venturi Fetish, etc.) ➜ lithium iron phosphate (LiFepO4) batteries are beginning to appear on the electric vehicle market (MiA electric Mia) ➜ king a thermal runaway condition and therefore an explosion. So, to prevent the formation of dendrites, the charge temperature has to be maintained within a certain range. thus, all lithium-ion batteries must be equipped with these Battery Management Systems (BMS) to keep the temperatures under control. Figure 9: Lithium-ion battery operation lithium metal polymer (LMp) batteries, still very dear, are installed in Bolloré Bluecars. We should also note the advancements made on the promising lithium-air technology, the energy density of which is higher than 2,000 Wh/kg, but which is subject to other disadvantages, such as low specific power and the risks of corrosion. ee- e- ee- e- At this stage, only batteries using lithium seem to be suitable for electric vehicles and rechargeable hybrids. the sales distribution of rechargeable batteries by technology confirms this trend: 70% lithium-ion, 10% lithium-polymer, 10% nickel metal hydride and 10% nickel cadmium. Separator For the rest of this section, we will concentrate on the case of lithium-ion batteries, considering their predominance on today’s market. = Charge = Discharge Battery safety: The electric vehicle’s ‘licence to operate‘ Some lithium batteries are subject to the risk of explosion and gas releases. two electrodes that come into contact during the manufacturing or recharge phase of the battery caused by the formation of lithium dendrites can trigger a short-circuit, provo- electrolytes Anode Cathode !"#$%&'"(%#)*(cobalt, aluminium, manganese) (lithium, copper) Source: Natixis Asset Management. //////// Research paper //////// Electric vehicles Lithium-ion batteries can be built with two anode types, lithium titanate and graphite, and five cathode types: cobalt oxide (LiCoO2), NCA (Li(NiCoAI)O2), NMC (Li(MnCo)O2), manganese oxide (LiMn2O4) or iron phosphate (LiFePO4). For each cathode type, thermal runaway – more or less intensive – can take place at different temperature ranges.6 Cathode name Cobalt dioxide NCA NMC Iron phosphate Manganese oxide Formula LiCoO2 Li(NiCoAI)O2 Li(MnCo)O2 LiFePO4 LiMn2O4 Specific energy (Wh/kg) - 529 476 424 419 Temperature range 180°C to 370°C 210°C to 330°C 230°C to 290°C 180°C to 320°C 200°C to 250°C Thermal runaway speed up to 360°C/ minute up to 290°C/ minute up to 60°C/ minute up to 10°C/ minute up to 10°C/ minute to 75% of the range claimed by the manufacturers under normal usage conditions. Thus, in the case of the future Renault Zoe, claimed as 220 km, the reality in terms of range corresponds to 165 km. The way the vehicle is driven – smoothly or nervously – has an important impact on the vehicle’s range. As a result, driver training would be a good idea. It should also be noted that the auxiliaries (heating, air conditioning, lighting, windscreen wipers, radio) can not be ignored as range reducers, but are omitted today in the claims made for ranges. The tests are performed under optimum conditions (smooth driving, no wind, no heating or air conditioning), which explains the differences between the real range and the claimed range. The Strategic Analysis Centre conducted three scenarios to represent the importance of the auxiliaries on an electric vehicle’s range. Figure 10: Range variations in electric vehicles depending on usage Consumption (kWh/km) 78 km 30 Source: Natixis Asset Management / General Council of Industry, Energy and Technology (CGIET), 2011. Table 6: Cathode technologies 20 The table above shows that cathodes producing the best specific energies, i.e. the longest travelling ranges, are also those which are the most exposed to the risk of thermal runaway with cobalt dioxide presenting the greatest risk. 10 The lithium-ion battery, the most common in use, has among the lowest risks of thermal runaway with a manganese dioxide cathode. However, other criteria impact on the choice of cathodes, such as cost, lifetime, specific power, or even time required to recharge. We can see that this topic has created diverging opinions and that the risks specific to the electric vehicle can prove detrimental to consumer confidence. But the internal combustion engine has also its own specific risks (explosion, for example) which have been accepted and even ignored by drivers for years. The electric vehicle has not yet progressed this far in the minds of the general public. Range of lithium-ion batteries: a less and less important topic The range of an electric vehicle, which is clearly less than that of a vehicle with an internal combustion engine, depends on the capacity of the batteries on board the vehicle and the consumption needed to drive it. The average range attained today is approximately 150 km. Usage must therefore be limited to short trips. Given that 90% of daily trips are less than 80 km, the electric vehicle has its place in many situations and for a precise usage. The ranges given correspond to those that can be attained under optimum conditions. In reality, the range corresponds 97 km 25 15 92 km 160 km 5 0 Range Standardised cycle Auxiliaries On highway In city Traction Source: Natixis Asset Management / General Council of Industry, Energy and Technology (CGIET), 2011. Assumptions Battery capacity of 22 kWh, range of 160 km in standardised cycle with an average speed of 33.6 km/h, consumption linked to traction of 13.8 kWh/100 km (city car). – Driving in standardised cycle under winter conditions (–5°C outside), average speed of 33.6 km/h, consumption linked to traction of 13.8 kWh/100 km and auxiliary consumption of 3 kW to ensure heating. – Driving on highway under winter conditions (–5°C outside), average speed of 100 km/h, consumption linked to traction of 21.0 kWh/100 km and auxiliary consumption of 3 kW to ensure heating. – Driving in city under winter conditions (–5°C outside), average speed of 18.8 km/h, consumption linked to traction of 12.0 kWh/100 km and auxiliary consumption of 3 kW to ensure heating. Some projects show that it is possible to extend the range with photovoltaic panels on the roof. By accepting the optimum assumptions,7 solar energy would help recovering 750 Wh in three hours, giving a range of nearly 5 km. (6) Sandia National Laboratories, 2010. (7) A 1 m2 panel on the roof of a city car consuming 0.15 kWh/km, solar lighting of 1,000 W/ m² equivalent to the power supplied by the sun at noon in clear weather at a temperature of 25°C, a panel yield of 25%; thus, a delivered power of 250 W/m². Electric vehicles //////// Research paper //////// Table 7: Tesla Motors models Tesla models Marketing date Chassis Battery capacity Range Price Roadster Combustion – adapted from Lotus Elise 56 kWh 395 km (245 miles) €95,000 € Model S 2013 Specifically designed for an electric motor 85 kWh 480 km (300 miles) €84,900 € 2014 Specifically designed for an electric motor 85 kWh – Comparable to the Model S price Model X Source: Natixis Asset Management / Tesla Motors, 2012. Even though most of the ranges claimed are limited to 150 km, Tesla Motors proposes models attaining two and even three times this range. However, this has significantly dropped over these last years and should continue to do so, as shown in the bar graph below. Using lithium-ion technology, the company also equips the Toyota RAV4 and the future Mercedes Benz Class B with batteries, while keeping secret the technological advancements that allow it to attain such a range. Figure 11: Lithium-ion batteries, price variation (€/kWh) 2500 $ 2000 $ 2000 1500 $ We do not consider range as an insurmountable obstacle for the electrical sector. On the one hand, technological evolution will progressively increase the range. On the other hand, on the consumer side, we are witnessing today a paradigm change concerning the car’s place in our societies. Formerly, in developed countries, the coveted car symbolised financial success par excellence. Today, behaviours have evolved; the Y generation is less obsessed by big-engined cars than by the practicality and adequacy of the vehicle to their way of life. With soaring urbanisation, inter- and peri-urban area movements will create fewer and fewer kilometres travelled and range will be less and less a barrier to purchase. 1000 $ 700 500 $ 600 500 300 200 120 2020 2025 2030 0$ 2005 2010 2011 2012 Source: Natixis Asset Management / Roland Berger, 2011 / Bloomberg New Energy Finance s.d. At this stage, the price of lithium-ion batteries remains high mainly because of the raw materials (Rolland Berger, 2012). In fact, for a vehicle with a 16 kWh battery, a range of 150 km and a sales price of €30,000, it would be necessary to count on a cost of €8,000 for the battery alone, i.e. nearly 30% of the vehicle’s price. Lithium-ion battery service life: not a priority issue The service lives of lithium-ion batteries vary from 7 to 8 years, that is, approximately 200,000 km. Despite remaining in the same order of magnitude, battery service life can vary according to the following parameters: number of cycles, usage and charging mode, type of driving, number of fast or incomplete charges, and so on. However, the service life should not be an inconvenience for the consumer when renting batteries from the manufacturer. The rental system adopted in many commercial offers in the sector allows customers to change batteries without being concerned about it. Considering the progress that is being made in the recycling of cobalt and lithium, the service life of the batteries is not, in our opinion, a high priority topic. Battery cost: a key indicator for the development of the sector The range of electric vehicles depends on the capacity of the onboard batteries. Existing vehicle battery capacities vary in most cases between 15 and 30 kWh with ranges around 150 km. Up to now, one of the main factors slowing down the development of lithium-ion batteries was their cost. Technological improvements reducing the electricity consumption per kilometre could also lower the cost of the electric car. Today, electricity consumption varies between 0.15 kWh /km and 0.25 kWh/km according to the vehicle’s category, and covers the vehicle’s drive chain, lighting, heating or air conditioning. Lower energy demands for these items would extend the range without increasing the stored capacities. An electric vehicle cannot recover the evacuated heat lost by the internal combustion engine. As a result, heating and air conditioning are taken directly from the energy on the battery. But in very cold winters, the energy consumed by the heating equals the consumption of the drive chain. Therefore, it will be necessary to add an independent heating system, for example, electric heating resistances or less demanding equipment in terms of battery power, such as a heat pump or a heat storage device. Eventually, research will find the way to recover the energy losses from the drive chain (batteries, power electronics and motor) to heat the passenger compartment. Conversely, in very hot periods, the air conditioning can also absorb up to half the power needed for driving. Lighting, another energy consumer, may also be saved through the wider use of xenon lights and/or various Light Emitting Diodes (LEDs). Resorting to the use of solar panels could also provide additional energy to maintain the characteristics linked to comfort and driving safety. //////// Research paper //////// Electric vehicles integrating all these new technologies, however, increases the cost. Nonetheless, we are confident about the trend towards lower costs in the medium term. However, we consider that the cost of batteries is one of the main handicaps faced by development over the short term. raw materials: the most decisive barrier in the choice of technologies the lithium-ion battery, the most commonly used battery technology in the development of the electric vehicle, is also the most problematic in terms of raw materials. in fact, lithium-ion batteries principally use lithium and cobalt. Lithium, recycling sectors to be developed Although lithium is a relatively abundant element, much of it is difficult to access. Lithium is present in sea salt in very small quantities, as well as in salt deserts, minerals, oil fields or even oceans (Bihouix, 2010). While resources are estimated at 34 million tonnes, lithium reserves amount to 13 million tonnes (USGS, 2012) and are distributed as shown in the chart below: Figure 12: World lithium reserves Chile China Australia Argentina Others Source: Natixis Asset Management / USGS, 2012. the annual production in 2011 was 34,000 tonnes and usage is distributed as follows: glasses and ceramics (29%), batteries (27%), lubricating greases (12%), continuous casting of steel (5%), air conditioners (4%), polymers (3%), primary aluminium production (2%), pharmaceutical products (2%), other (16%). 9,180 tonnes were used for batteries. According to reports, estimations vary widely on the quantity of lithium needed to produce a capacity of 1kWh for a lithium-ion battery, ranging from 80 grammes to 246 grammes of lithium depending on the chemical processes: ➜ 425 grammes of lithium carbonate equivalent (LCe), i.e. 80 grammes of lithium (Dundee Capital Markets, 2009) ➜ 87 grammes of lithium (Bihouix, 2010) ➜ 840 grammes of LCe, i.e. 158 grammes of lithium (reuters, 2011) ➜ 600 grammes of LCe, i.e. 113 grammes of lithium, to 1.3 kg of LCe, i.e. 246 grammes of lithium, depending on the cathode types (Argonne National Laboratory, 2009). By taking an average/high assumption of 150 grammes of lithium per kWh produced and an average consumption of 0.2 kWh/km, we obtain the information in table 8. Table 8: Lithium quantities required per vehicle type Electric vehicles (EV) Hybrid rechargeable vehicles (PHEV) Consumption (kWh/km) ~0.15 ~0.20 Electric range (km) 130 50 Capacity (kWh) 19.5 10 Quantity of lithium required (kg) 2.9 2.9 Source: Natixis Asset Management, 2012. to these, we must add the batteries of fuel cell vehicles that are equipped with lithium-ion batteries storing a capacity of ~1.5 kWh (Balkan Star Automotive Ltd. 2011). in its ‘Blue map’ scenario, where CO2 emissions linked to transport are 30% below the level of 2005, the international energy Agency (ieA) predicts that the annual sales of electric vehicles and rechargeable hybrid vehicles will increase, starting from 2015, to reach 7 million in 2020 and 100 million in 2050.8 With this scenario, the stock of electric vehicles and rechargeable hybrid vehicles would be 1.1 billion vehicles, with 524 million electric vehicles and 603 million rechargeable hybrid vehicles, which represents a demand of 2.4 million tonnes over 35 years. We should point out that the ieA estimates are very optimistic concerning the growth of electric and rechargeable hybrid vehicles. in every case, lithium is not regarded as a fossil fuel, due to the fact that it is 98% recyclable. Once the first generation of batteries are worn out, the reuse of the lithium will constitute a new source. to preserve the raw material resources and lower the manufacturing cost of batteries, the development of recycling appears to be a major challenge today, even though, at this stage, it is not economically as profitable as resorting to the raw material (Les echos, 2010). there are two solutions for recovering the materials of the electric car battery: chemical or thermal. the recycling sectors are still to be created and will also be the new players in the model. the european Union has set a stringent recycling objective of 45% for portable equipment batteries by 2016. in 2006, 20% of all batteries were recycled. Moreover, since 2005, the european Directive on end-of-Life vehicles (eLv) has imposed on manufacturers the duty to recycle or reuse 85% of the vehicle’s weight, rising to 95% in 2015. even though the application of this directive to electric vehicles is not clear, the considerable weight of the batteries in an electric vehicle may make battery recycling a serious regulatory issue. the ‘european strategy for energy efficient and clean vehicles’, rendered public on 28 April 2010 by the european Commission, hopes to encourage european research programmes on the recycling and reuse of batteries. in addition, the United States announced in August 2010 that the federal government would subsidise lithium battery recycling projects within the framework of the American recovery and reinvestment Act. (8) IEA, 2009. Electric vehicles //////// Research paper //////// Another important point in the development of the electric vehicle is the diversification of lithium supply sources. today, 85% of the production is controlled by 4 companies: rockwood via Chemetall and talison (buyout in 2012), SQM, and FMC (Lithium Americas 2012) / (Usine Nouvelle 2012). it would be possible to produce only 33 million electric vehicles annually. Also, remember that the recycling ratio represents today only 24% of consumption (Chemical Society of France / Société chimique de France, 2012). Figure 13: World cobalt production cobalt, a limited resource the lithium-ion technology also uses cobalt to manufacture cathodes. 45% of the cobalt reserves, estimated at 7.5 million tonnes, are located in the Democratic republic of the Congo (DrC) (USGS, 2012). D.R. of Congo Canada China Russia Zambia Rest of the world Although its resources are not considered to be rare, cobalt is problematical due to its strong presence in the DrC which is particularly known for mineral conflicts linked to the money obtained through trafficking. Batteries represent 25% of the usage of cobalt. Given that cobalt is a subproduct of the extraction of other metals (essentially copper and nickel, but also lead and zinc), its production is indexed on the production of other resources. in 2011, the annual production was 98,000 tonnes. But the production of an electric car requires approximately 3 kg of cobalt (Bihouix, 2010). thus, with the current production of 98,000 tonnes/year (USGS, 2012) and all uses restricted to that for batteries, Source: Natixis Asset Management / USGS, 2012. As a result, to avoid limiting the electric vehicle’s development, it is necessary either to increase cobalt production (which could eventually pose a problem for the reserves) or to turn to other technologies which do not use cobalt (lithium polymer, lithium iron phosphate or lithium metal polymer). We estimate that raw materials may constitute one of the most difficult barriers to overcome in the long term with a largescale deployment, not for the electric vehicle, but for the lithium-ion battery technology. Cathode manufacturers Cobalt Umicore (32%) Nichia (24%) Toda Kogyo (5%) Sumitomo Chemicals Tanaka Chemicals Nippon Chemicals Industrial Nippon Denko Sumitomo Metal Mining Sumitomo Metal Mining Umicore Manganese Nippon Denko Aluminium sheets Sumitomo Light Metal Industries Nippon Foil Mfg Battery manufacturers NEC/AESC LG Chem Panasonic/Sanyo A123 Systems SBLimotive GS Yuasa Hitachi Johnson Controls Electrolyte solutions Cheil Industries (33%) Ube Industries (21%) Mitsubishi Chem. (15%) Tomiyama Separators Battery life Recycling of batteries Umicore Recupyl Toxco Asahi Kasei (28%) Celgard (26%) Tonen/Toray (24%) Ube Industries Copper sheets Furukawa Electric Nippon Foil Mfg Nippon Denkai Lithium Rockwood (55%) SQM (20%) FMC (10%) Anode manufacturers Hitachi Chemicals (34%) Nippon Carbon (19%) BTR Energy (12%) JFE Holdings ShanShan Mitsubishi Chemicals Percentages in brackets indicate the company’s market share Source: Natixis Asset Management / Roland Berger, 2011 / SAE International, 2012 / Pike Research, 2012. Figure 14: Lithium-ion battery production value chain //////// Research paper //////// Electric vehicles Battery manufacture and end of life depend on only a very few players From the production of raw materials for anodes and cathodes to recycling at end of life, the challenges centring around the batteries of electric vehicles are significant. the companies listed in Figure 15 have, de facto, a leading role, whether concerning lithium or cobalt. the figure below demonstrates the following particular points: ➜ the lithium-ion battery market is oligopolistic over most of the segments, with between 60% and 85% of the market shares held by only three companies ➜ the companies involved in lithium and cobalt recycling are few (due to the economic factors indicated previously in this section) ➜ finally, the sector is dominated by Asiatic companies. Figure 15: Battery producers United States A123 Systems Johnson Controls Sumitomo Group Rockwood FMC Lithium Chile SQM South Korea LG Chem SB LiMotive Cheil Industries Belgium Umicore 2 i 3 Downstream: production and distribution of electricity Supply of electricity to ensure the supply of electricity, energy producers and distributors must also involve themselves in providing a regular supply. it should be noted that the development of the electric vehicle can also provide opportunities through: ➜ accelerating the deployment of intelligent electric networks (also called smart grids) and counters; frequently recharging electric vehicles could encourage staggered recharge hours to avoid excessive peaks in consumption ➜ offering new systems to store the energy with the ‘vehicle-to-grid’ concept, which assumes energy transfers from the grid to the vehicles and, conversely, from the vehicles to the grid. Figure 17: The ‘vehicle-to-grid’ concept Japan NEC/AESC Panasonic/Sanyo GS Yuasa Hitachi Mitsubishi Chemical Holdings UBE Industries Nichia Source: Natixis Asset Management. With cobalt, production is more diversified. Here, too, though, there are too few companies developing recycling methods. Figure 16: Cobalt producers (2011) OMG Chambishi Metals plc ICCI Umicore Xstrata BHP Biliton Vale Sumitomo Others Source: Natixis Asset Management / Cobalt Development Institute, 2012. Source: Natixis Asset Management. thus, electric and rechargeable hybrid vehicles will be capable of transferring energy from their batteries to the electricity network: a means for electricity distributors to occasionally respond to energy consumption peaks, and for vehicle owners to become energy suppliers by selling the electricity stored in their automobiles when the car is parked. even though this system is an opportunity for development, electricity producers and distributors do not foresee any major evolution on this storage system before 2030. the development of the electric vehicle also requires a network system which allows electric vehicle owners easy access to recharging infrastructure outside their homes. Beyond suppliers of charging terminals, this network system requires the involvement of companies and communities whether for private or public locations: public roads, parking areas, supermarkets, service stations, company parking lots for employees, and so on. At the moment, electric terminals have been installed, in most cases, in response to the needs of a company fleet or electric card organised services in self-service stations, such as exist in seven cities in France.9 (9) Initiative at Angoulême with Mia Electric (Mia), Auto Bleue at Nice with Peugeot (Ion), AutoCité at Besançon with Peugeot (Ion), Autolib’ at Paris with Bolloré (Bluecar), Moebius at Rueil-Malmaison with FAM (F-City), Mopeasy at Neuilly with Peugeot (Ion), Yélomobile at La Rochelle with Citroën (C-Zéro) and Mia Electric (Mia) Electric vehicles //////// Research paper //////// Lithium-ion battery recharging: a vital electrical network, but not a problem in the medium term There are several recharging modes: slow charge (~5 hours for a 16 kWh battery), fast charge (~30 minutes), exchange of batteries (a few minutes), or charging by induction. The real charging time depends on the remaining battery charge level, the battery energy capacity and the power level of the charge. The vehicle can be recharged by connecting it to the mains on slow charge with a simple 230-volt, 16-amp plug or with an additional three-phase, 32-amp installation that provides a semi-rapid charge in 3 hours. The slow charge presupposes the availability of a garage for private users, and rules on sharing for joint properties with various users. The installation of a terminal or a slow-recharge plug costs less than 1,000 euros. The fast charge recharges the battery to 80% in 30 minutes, but this charging mode damages the battery because the current and heating are more intense. Moreover, the fast charge can create large demand peaks if all users want to recharge at the same time, which would imply an energy supply often richer in carbon than the basic electric production to guarantee the offer during the peaks. The price of a fast-charge terminal is around 10,000 euros depending on power and usage (Legrand / Schneider Electric) and has shown a tendency to drop in the last few months. More generally, whether the recharge is performed rapidly and externally, or slowly at home, the management of the electricity demand should be matched to the development of smart counters and smart networks. For example, to avoid having all users recharging their batteries at once, around Electricity producers and distributors Acciona American Electric Power CPFL Energia CPS Energy E.On EDF Endesa SA Enel Iberdrola NRG Energy Powerstream RWE … 8 p.m. after returning from work, smart counters will make it possible to trigger the recharges at different times during the night, to spread out demand. The next option considered is to exchange batteries (a system experimented with by Better Place). However, the activity of these exchange stations is facing the following two problems: ➜➜ no battery standardisation has been established, and thus the concept concerns only some batteries ➜➜ this system significantly increases the operating cost since it demands a large, permanently available stock of batteries to ensure that exchanges can take place whenever required. Furthermore, these battery exchange stations require a lot of space for rapidly recharging the batteries (semi-fast charge) in order to be able to reissue them. Finally, charging by induction permits recharging the battery without connecting the vehicle to the electricity network. Once parked on the induction plate, a vehicle equipped with an energy sensor can receive the induction and transform it into current. This method is in the experimental phase. Most recharging should be performed at home on slow charge. However, fast charging must be externally accessible. Legrand estimates that the potential for recharging terminal installations in France is in the order of 400,000 public terminals and more than 4 million private ones by 2020. Moreover, within the borders of France, in accordance with Article 57 of the French Grenelle II Act, it is mandatory to: Recharging terminal managers and suppliers ABB Ametek DBT Energie Parken ENSTO enwi-etec General Electric Hager Ineo Ingeteal Legrand Saintronic Schneider Electric Sobem-Scame Sumitomo Corporation of America SVE … Potential locations Recharging stations: Better Place Supermarkets: E. Leclerc, Intermarché… Service stations Public places … Source: Natixis Asset Management / Pike Research, 2012. Figure 18: Electricity supply value chain //////// Research paper //////// Electric vehicles ➜➜ install terminals in residential, commercial and public structures as of 1 January 2012 ➜➜ set up recharging equipment in existing commercial and public buildings mainly used for a workspace by 2015 We estimate that the electric network of recharging terminals does not pose any particular problems for the development of the vehicle. Many companies are already positioned on terminal technologies, and regulations are also stimulating a faster deployment. ➜➜ provide the opportunity for co-owners and tenants to connect vehicles in existing apartment buildings (Legifrance 2012). Conclusion The electric vehicle is a breakthrough technology which responds to the major challenges of the automobile and, more globally, of mobility by eliminating CO2 emissions and pollutants during the vehicle’s usage phase and, in the case of favourable energy mixes, reducing the use of fossil resources. This type of vehicle is, however encountering many obstacles at this stage: high prices, insufficient recharging means and restrictive range, forcing consumers to reconsider their relation ship with the automobile. These inhibiting factors, among others, explain the half-hearted sales results of the first electric vehicles recently placed on the market. To ensure the development of the electric sector, it is necessary to spur on its development in many areas. ➜➜ Supply of raw materials: the number of companies supplying the required raw materials is limited, creating oligopolistic markets, and recycling is currently almost non-existent. ➜➜ Battery technologies: several technologies are currently competing, but none of them can guarantee: to not use rare resources; to provide enough specific energy and power for a range exceeding a hundred kilometres; to guarantee risk-free usage; and, finally, to achieve a cost that will allow a reduction in the global price of the electric vehicle. ➜➜ The electric motor: each of the three technologies present in the electric vehicles marketed presents its own set of restrictions, from the supply of rare metals to low efficiency and maintenance constraints. ➜➜ Vehicle structure: an electric vehicle must have a chassis which is specifically designed for electric usage, and a structure integrating more and more light materials to increase the available range. ➜➜ The network of electricity terminals: assuming that the IEA scenario of a reduction of 30% of CO2 emissions in 2050 compared with 2005 will be achieved, it will be necessary by then to provide for an infrastructure allowing the recharging of an installed base of more than one billion electric and rechargeable hybrid vehicles in circulation. To meet these challenges, the entire electric vehicle value chain will have to work together: mining and metal companies, battery manufacturers, recycling companies, electricity suppliers, recharging terminal managers, auto-part manufacturers and automobile manufacturers, etc. Searching for solutions to overcome these obstacles is, in itself, a source of opportunities for investment. The breakthrough is not only technological, but also behavioural: the feeling of ownership gradually disappears with the introduction of rental systems and the vehicle becomes merely an urban transport vector. More globally, from a sustainable mobility viewpoint, the automobile’s usage is bound to evolve. We consider that the electric vehicle has a role to play in the automobile sector. Initially, this type of model seems to be especially appropriate for company fleets. Beyond that, as far as it is destined to remain urban, the electric vehicle could, in the medium or long term, interest private owners of a small car who drive short distances, provided improvements have been made on all the aforementioned points. But until this different concept of the use of an automobile is generally accepted, rechargeable hybrid or electric vehicles with range extenders seem to provide a suitable transition. These two categories allow both travelling short distances in electric mode in the city and maintaining the possibility of going farther in internal combustion mode. They thus represent a good alternative way to progressively reduce the sector’s dependency on fossil fuels, without enormously altering the usage of the car. Beyond the breakthrough technologies, it should not be forgotten that the automobile sector still has a significant margin with respect to technological progress in internal combustion engine types and that these latest advances are also among the solutions to the problems of attaining cleaner mobility. Electric vehicles //////// Research paper //////// BIBLIOGRAPHY ADEME (2005, February) - Le Stockage électrochimique. ADEME/Bilan Carbone Entreprises et Collectivités Fournisseur électricité (June 2010) - Prix de l’électricité dans le monde. From www.fournisseurs-electricite.com/ fournisseurs-etrangers/actu-des-producteurs/1060-prix-delelectricite-dans-le-monde. (2010) - Guide des facteurs d’émissions – Chapitre 4 : Prise en compte des transports. How long will it last? ANFA (2011) - Dossier Technique – véhicules électriques et From www.science.org .au/nova/newscientist/ns_ diagrams/027ns_005image2.jpg. From www.mines-energie.org/Dossiers/Stock2005_15.pdf. hybrides. Argonne National Laboratory (May 2009) - Lithium-Ion Battery Recycling Issues. From www1.eere.energy.gov/vehiclesandfuels/pdfs/merit_review_2009/propulsion_materials/ pmp_05_gaines.pdf. Balkan Star Automotive Ltd. (October 2011) - Daimler Fuel Cell & Electric Drive Strategy. From www.baeps.org/ Economedia/Manfred.pdf. INA (1968) - À quand la voiture électrique? From www.ina. fr/economie-et-societe/environnement-et-urbanisme/video/ CAF86014983/a-quand-la-voiture-electrique.fr.html. International Energy Agency (2009) - Transport, Energy and CO2: Moving towards Sustainability. From www.iea.org/ textbase/nppdf/free/2009/transport2009.pdf. International Energy Agency (2010) - World Energy Outlook 2010. Bihouix, Philippe (2010) - Quel futur pour les métaux ? Raréfaction des métaux: un nouveau défi pour la société. Monts: EDP Sciences. Blacksmith Institute (2012) - The worlds’s worst pollution problems: assessing health risks at hazardous waste sites. From www.worstpolluted.org/files/FileUpload/files/2012%20 WorstPolluted.pdf. Bloomberg New Energy Finance - Electric vehicle battery prices down 14% year on year. From www.bnef.com/ PressReleases/view/210. Cobalt Development Institute (April 2012) - Cobalt news. Legifrance (24 March 2012) - Loi n° 2010-788 du 12 juillet 2010 portant engagement national pour l’environnement. From www.legifrance.gouv.fr/affichTexte.do?cidTexte=JO RFTEXT000022470434. Legrand - Catalogue de produits. From www.e-catalogue. legrandgroup.com/france/index.html?reference=059075#n av=5%2C7%2C1. Les Echos (December 2010) - Du neuf pour le recyclage du lithium. From http://archives.lesechos.fr/archives/2010/ LesEchos/20816-509-ECH.htm. From www.thecdi.com/cdi/images/news_pdf/cobalt_news_ april12.pdf. Lithium Americas (2012) - Lithium Info. From www.lithiu- Commission Européenne (2012) - Energy in figures – Sta- Manicore (July 2012) - Le véhicule électrique est-il la panacée? From www.manicore.com/documentation/voit_elect.html. tistical Pocketbook 2012. From http://ec.europa.eu/energy/ publications/doc/2012_energy_figures.pdf. Conseil Général de l’Industrie de l’Energie et des Technologies (CGIET) (June 2011) - La voiture de demain : carburants et électricité. From www.cgiet.org/documents/2011_06_16_voiture_de_demain.pdf. Dundee Capital Markets (October 2009) - Lithium – Hype mamericas.com/about-us/lithium-info/. Mines-Energie (February 2005) - Le stockage électrochimique. From www.mines-energie.org/Dossiers/Stock2005_15.pdf. Pike Research (2012) Pike Pulse Report: Electric Vehicle Batteries. From www.pikeresearch.com/research/pike-pulsereport-electric-vehicle-batteries. or Substance? A look at Lithium Demand and Supply. From http://research.dundeesecurities.com/Research/Lithium102809.pdf. Renault (March 2011) - Renault 2016 – Drive the Change Eurostat (2011) - Electricité – consommateurs domes- Reuters (February 2011) - Known lithium deposits can cover tiques – prix semestriels – nouvelle méthodologie à partir de 2007. From http://appsso.eurostat.ec.europa.eu/nui/show. do?dataset=nrg_pc_204&lang=fr. electric car boom. From www.reuters.com/article/2010/02/11/ us-lithium-latam-idUSTRE61A5AY20100211. Expert VE (October 2012) - Motorisation électrique et onduleur. From www.expert-ve.fr/moteur-onduleur-ve.html. – CSR Strategy. From www.renault.com/fr/lists/archivesdocuments/conférence nomura 17-03-2011.pdf. Roland Berger (August 2011) - The Li-Ion Battery Value Chain – Trends and implications. From www.rolandberger. com/media/pdf/Roland_Berger_The_Li_Ion_Battery_Value_ Chain_20110801.pdf. //////// Research paper //////// Electric vehicles Roland Berger (October 2012) - Lithium-ion batteries – The bubble bursts. From www.rolandberger.com/media/pdf/ Roland_Berger_Li_Ion_Batteries_Bubble_Bursts_20121019. pdf. SAE International (June 2012) - Vehicle electrification: Lithium in the limelight. From www.nxtbook.com/nxtbooks/ sae/12EVSD0626/index.php?startid=22. Sandia National Laboratories (September 2010) - Safety U.S. Department of Energy - Fuel Economy: Where the Energy Goes. From www.fueleconomy.gov/FEG/atv.shtml. USGS (January 2012) - Cobalt. From http://minerals.usgs. gov/minerals/pubs/commodity/cobalt/mcs-2012-cobal.pdf. USGS (January 2012) - Les terres rares. From http://minerals.usgs.gov/minerals/pubs/commodity/rare_earths/mcs2012-raree.pdf. related materials issues for batteries. From www.ccrhq.org/ userfiles/file/Niche/Nagasubramanianforweb.pdf. USGS (January 2012) - Lithium. From http://minerals.usgs. Schneider Electric. Catalogue de produits. Usine Nouvelle (August 2012) - Rockwood, nouveau géant du lithium. From http://indices.usinenouvelle.com/metauxnon-ferreux/metaux-mineurs/rockwood-nouveau-geant-dulithium.4415. From www.e-catalogue.schneider-electric.fr/navdoc/catalog/ ve/pdf/chapitre/GuideVE.pdf. Société chimique de France (August 2012) - Cobalt. From www.societechimiquedefrance.fr/extras/Donnees/ metaux/co/cadco.htm. Tesla Motors (2012) - Investor Presentation – Spring 2012. From http://files.shareholder.com/downloads/ABEA-4CW 8X0/1964722163x0x562858/6fd411d9-c47d-4d29-948909ba283bf07b/Tesla%20Presentation%20-%20Spring%20 2012.pdf. gov/minerals/pubs/commodity/lithium/mcs-2012-lithi.pdf. Valeo (September 2010) - Le véhicule zéro émission. From www.ifsttar.fr/fileadmin/uploads/recherches/geri/ PFI_VE/pdf/white_paper_ZEV_2010_FR.pdf. Electric vehicles //////// Research paper //////// List of Figures Figure 1: Electric vehicle markets Figure 2: Electric vehicle value chain Figure 3: Components of an electric vehicle Table 1: Electric motor technologies Figure 4: Components of a range extender electric vehicle Table 2: From battery to manufacturer Figure 5: Vehicle design value chain Figure 6: Energy efficiency of the combustion chain Figure 7: Energy efficiency of the electric chain Table 3: Electricity mix by country Figure 8: CO2 emissions from the production of an electric vehicle (tonnes) Table 4: Commercial supply of electric vehicles Table 5: Battery characteristics Figure 9: Lithium-ion battery operation Table 6: Cathode technologies Figure 10: Range variations in electric vehicles depending on usage Table 7: Tesla Motors models Figure 11: Lithium-ion batteries, price variation (€/kWh) Figure 12: World lithium reserves Table 8: Lithium quantities required per vehicle type Figure 13: World cobalt production Figure 14: Lithium-ion battery production value chain Figure 15: Battery producers Figure 16: Cobalt producers (2011) Figure 17: The ‘vehicle-to-grid’ concept Figure 18: Electricity supply value chain 59 59 60 61 61 61 62 62 62 63 64 65 67 67 68 68 69 69 70 70 71 71 72 72 72 73 DISCLAIMER This document is destined for professional clients. It may not be used for any purpose other than that for which it was conceived and may not be copied, diffused or communicated to third parties in part or in whole without the prior written authorization of Natixis Asset Management. None of the information contained in this document should be interpreted as having any contractual value. This document is produced purely for the purposes of providing indicative information. It constitutes a presentation conceived and created by Natixis Asset Management from sources that it regards as reliable. Natixis Asset Management and Mirova Environment and Infrastructure reserve the right to modify the information presented in this document at any time without notice and particularly the information concerning the description of the management processes which does not in any way constitute a commitment on behalf of Natixis Asset Management or Mirova Environment and Infrastructure. Natixis Asset Management and Mirova Environment and Infrastructure will not be held responsible for any decision taken or not taken on the basis of information contained in this document, nor in the use that a third party may make of it. Figures mentioned refer to previous years. Past performance does not guarantee future results. Reference to a ranking and/or a price does not indicate the future performance of the UCITS or the fund manager. The analyses and opinions referenced herein represent the subjective views of the author(s) as referenced, are as of the date shown and are subject to change. There can be no assurance that developments will transpire as may be forecasted in this material. The funds managed by Natixis Asset Management and mentioned in this document have received the approval of the French Financial Market Authority (AMF) or have received authorization to be marketed in France. Under Natixis Asset Management’s social responsibility policy, and in accordance with the treaties signed by the French government, the funds directly managed by Natixis Asset Management do not invest in any company that manufactures sells or stocks anti-personnel mines and cluster bombs. The funds managed by Mirova Environment and Infrastructure are not subject to the French Financial Market Authority agreement and can adopt exceptional rules of investment described in the legal prospectus. Before making any subscription, investors must verify if they are legally authorized to subscribe to an UCITS; in particular, subscription to the funds managed by Mirova Environment and Infrastructure is strictly reserved for well-informed investors answering the criteria defined in their regulation. Characteristics, risk and return profile and costs related to investment in a fund are described in the Key Investor Information Document, Mirova. Responsible investing Mirova is a brand of Natixis Asset Management. available on request from Natixis Asset Management. In the case of funds that qualify for a special tax status, we remind potential investors that the special tax conditions depend on the individual situation of each investor and that such conditions may be subject to future modification. This material is provided only to investment service providers or other Professional Clients or Qualified Investors and, when required by local regulation, only at their written request. • In France, the prospectus and the periodical reports are available on request from Natixis Asset Management or Mirova Environment and Infrastructure. Potential subscribers must be in possession of a copy of the Key Investor Information Document before making any subscription. • In the EU (ex UK) Distributed by NGAM S.A., a Luxembourg management company authorized by the CSSF, or one of its branch offices. NGAM S.A., 51, avenue J.F. Kennedy, L-1855 Luxembourg, Grand Duchy of Luxembourg. • In the UK Provided and approved for use by NGAM UK Limited, which is authorized and regulated by the Financial Conduct Authority. • In Switzerland Provided by NGAM, Switzerland Sàrl. • In and from the DIFC Distributed in and from the DIFC financial district to Professional Clients only by NGAM Middle East, a branch of NGAM UK Limited, which is regulated by the DFSA. Office 603 – Level 6, Currency House Tower 2, P.O. Box 118257, DIFC, Dubai, United Arab Emirates. • In Singapore Provided by NGAM Singapore (name registration no. 5310272FD), a division of Absolute Asia Asset Management Limited, to Institutional Investors and Accredited Investors for information only. Absolute Asia Asset Management Limited is authorized by the Monetary Authority of Singapore (Company registration No.199801044D) and holds a Capital Markets Services License to provide investment management services in Singapore. Registered office: 10 Collyer Quay, #14-07/08 Ocean Financial Centre. Singapore 049315. • In Hong Kong This document is issued by NGAM Hong Kong Limited and is provided solely for general information only and does not constitute a solicitation to buy or an offer to sell any financial products or services. Certain information included in this material is based on information obtained from other sources considered reliable. However, NGAM Hong Kong Limited does not guarantee the accuracy of such information. • In Japan Provided by Natixis Asset Management Japan Co., Registration No.: Director-General of the Kanto Local Financial Bureau (kinsho) No. 425. Content of Business: The Company conducts discretionary asset management business and investment advisory and agency business as a Financial Instruments Business Operator. Registered address: 2-2-3 Uchisaiwaicho, Chiyoda-ku, Tokyo. The above referenced entities are business development units of Natixis Global Asset Management, the holding company of a diverse line-up of specialised investment management and distribution entities worldwide. Although Natixis Global Asset Management believes the information provided in this material to be reliable, it does not guarantee the accuracy, adequacy or completeness of such information. Visit us: www.mirova.com Follow us: @Mirova_RI Natixis Asset Management MIROVA ENVIRONMENT AND INFRASTRUCTURE Limited Company - Share Capital: e50 434 604.76 A French simplified joint-stock company - Share Capital: e550 000 RCS Paris 329 450 738 - Regulated by AMF: GP 90-009 RCS Paris 394 648 216 - Regulated by AMF: GP 02 014 Registered Office: 21 quai d’Austerlitz - 75634 Paris Cedex 13 Registered Office: 21, quai d’Austerlitz - 75013 Paris The Infrastructure financing activity is managed by Mirova Environment and Infrastructure, a subsidiary of Natixis Asset Management. AN expertise OF


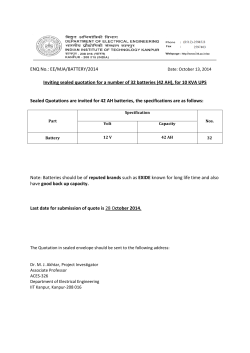

© Copyright 2026