
Kvartalsrapport per 30
Interim Financial Statements Q4 2014
Key figures ................................................................................................................ 3
Report of the Board of Directors ................................................................................... 4
Income Statement .................................................................................................... 13
Balance Sheet .......................................................................................................... 14
Statement of Changes in Equity ................................................................................. 15
Cash Flow Statement ................................................................................................ 16
Notes to the Financial Statements ......................................................................... 17-27
Note 1 Accounting policies ...................................................................................... 17
Note 2 Impairment losses on loans and guarantees recognised in the income statement 17
Note 3 Impairment losses on loans and guarantees recognised in the balance sheet ...... 18
Note 4 Non-performing and impaired loans ............................................................... 18
Note 5 Other assets ............................................................................................... 18
Note 6 Other liabilities............................................................................................ 18
Note 7 Customer deposits by sector and industry ...................................................... 19
Note 8 Customer loans by sector and industy ............................................................ 19
Note 9 Capital adequacy ......................................................................................... 19
Note 10 Financial derivatives .................................................................................. 21
Note 11 Issuance of unsecured debt and additional capital instruments ........................ 21
Note 12 Segment reporting..................................................................................... 22
Note 13 Reclassification of financial instruments ........................................................ 24
Note 14 Pensions ................................................................................................... 25
Note 15 SpareBank 1 Boligkreditt and SpareBank 1 Næringskreditt ............................. 25
Note 16 Liquidity risk ............................................................................................. 25
Note 17 Information about fair value ....................................................................... 26
Note 18 Events after the balance sheet date ............................................................. 27
Quarterly income statement....................................................................................... 28
Contact information and 2015 financial calendar........................................................... 30
SpareBank 1 SR-Bank Group
Unaudited
2
Key figures SpareBank 1 SR-Bank Group
01.01.14 - 31.12.14
MAIN FIGURES
01.01.13 - 31.12.13
MNOK
%
MNOK
%
2.404
1,45
2.119
1,42
1.732
1,04
1.824
1,22
778
0,47
555
0,37
Total income
4.914
2,96
4.498
3,01
Total operating costs
2.056
1,24
2.019
1,35
Operating profit before impairment losses
2.858
1,72
2.479
1,66
257
0,15
132
0,09
2.601
1,57
2.347
1,57
506
0,30
487
0,33
2.095
1,26
1.860
1,24
Net interest income
Net commission and other income
Net income on financial investments
Impairment losses on loans and guarantees
Pre-tax profit
Tax expense
Profit after tax
31.12.14
31.12.13
14,2 %
14,0 %
PROFITABILITY
Return on equity 1)
Cost ratio
2)
41,8 %
44,9 %
1,45 %
1,42 %
Gross loans to customers
141.620
120.273
Gross loans to customers including SB1 Boligkreditt og Næringskreditt
174.492
166.662
17,7 %
9,8 %
4,7 %
5,3 %
Combined weighted total average spread for lending and deposits 3)
BALANCE SHEET
Growth in loans 4)
Growth in loans incl SB1 Boligkreditt and Næringskreditt
Deposits from customers
81.489
71.667
Deposit-to-loan ratio
57,5 %
59,6 %
Growth in deposits
13,7 %
6,0 %
Total assets
174.926
156.985
Average total assets
166.017
149.554
Impairment losses ratio, annualized 5)
0,20 %
0,11 %
Non-performing commitments as a percentage of gross loans
0,30 %
0,69 %
Other doubtful commitments as a percentage of gross loans
0,36 %
0,37 %
Common equity Tier 1 capital ratio
11,5 %
11,1 %
Tier 1 capital ratio
12,3 %
12,8 %
Capital ratio
14,5 %
14,1 %
Tier 1 capital
14.828
14.511
120.189
113.075
LOSSES AND NON-PERFORMING COMMITMENTS
SOLIDITY
Risk weighted balance
BRANCHES AND STAFF
Number of branches
Number of employees (annualised)
SpareBank 1 SR-Bank share
48
52
1.106
1.165
31.12.14
Market price
Market capitalisation
Book equity per share(including dividends) (group)
31.12.13
31.12.12
31.12.11
31.12.10
52,50
60,25
37,20
40,70
57,00
13.427
15.409
9.514
5.182
7.257
60,28
55,00
49,48
48,75
47,45
Earnings per share, NOK
8,20
7,28
5,33
5,42
6,84
Dividends per share
2,00
1,60
1,50
1,50
2,75
Price / Earnings per share
6,40
8,28
6,98
7,51
8,33
Price / Book equity (group)
Effective return
6)
1)
Operating result as a percentage of average equity
2)
Total operating costs as a percentage of total operating income
3)
Net interest income as a percentage of average total assets
0,87
1,10
0,75
0,83
1,20
-10,2 %
66,0 %
-4,9 %
-23,8 %
17,5 %
4)
High growth in loans is attributable to a buy-back of loans from SpareBank 1 Boligkreditt AS
5)
Impairment losses on loans as a percentage of average gross loans, annualised
6)
Percentage change in the market price in the last period, including paid share dividend
SpareBank 1 SR-Bank Group
Unaudited
3
Strong result with higher income, moderat losses and good cost control
Q4 2014
•
•
•
•
•
•
•
•
•
Pre-tax profit: NOK 553 million (NOK 674 million)
Net profit for the period: NOK 448 million (NOK 567 million)
Return on equity after tax: 11.7% (16.2%)
Earnings per share: NOK 1.75 (NOK 2.22)
Net interest income: NOK 655 million (NOK 574 million)
Net commissions and other operating income: NOK 405 million (NOK 489 million)
Net income from financial investments: NOK 116 million (NOK 195 million)
Operating costs: NOK 530 million (NOK 534 million)
Impairment losses on loans: NOK 93 million (NOK 50 million)
(Figures for Q4 2013 are shown in brackets)
Preliminary annual result for 2014
•
•
•
•
•
•
•
•
•
•
•
•
•
•
Pre-tax profit: NOK 2,601 million (NOK 2,347 million)
Net profit for the period: NOK 2,095 million (NOK 1,860 million)
Return on equity after tax: 14.2% (14.0%)
Earnings per share: NOK 8.20 (NOK 7.28)
The board proposes a dividend of NOK 2.0 (NOK 1.6)
Net interest income: NOK 2,404 million (NOK 2,119 million)
Net commissions and other operating income: NOK 1,732 million (NOK 1,824 million)
Net income from financial investments: NOK 778 million (NOK 555 million)
Operating costs: NOK 2,056 million (NOK 2,019 million)
Impairment losses on loans: NOK 257 million (NOK 132 million)
Total lending growth over the last 12 months: 4.7% (5.3%)
Growth in deposits over the last 12 months: 13.7% (6.0%)
Common equity tier 1 capital ratio: 11.5% (11.1%)
Tier 1 capital ratio: 12.3% (12.8%)
(As at 31 December 2013 in brackets)
fourth quarter and replaced by more reasonable
sources of funding.
Financial performance Q4 2014
The group's pre-tax profit was NOK 553 million (NOK
674 million), NOK 24 million lower than in the third
quarter of 2014. The return on equity after tax for
the quarter was 11.7% (16.2%) compared with
12.2% in the third quarter of 2014. The lower result
for the quarter was primarily attributable to the NOK
61.2 million fall in the value of the group's bond
portfolio, with offshore commercial paper being
particularly affected.
Net interest income totalled NOK 655 million (NOK
574 million) compared with NOK 621 million in the
third quarter of 2014. The average interest margin
(net interest income as a percentage of average total
assets) was 1.51% in the fourth quarter of 2014
(1.46%) compared with 1.48% in the third quarter of
2014. The higher net interest income in the last
quarter was primarily attributable to lower interest
costs on external funding. Subordinated loans and
tier 1 capital instruments were redeemed early in the
SpareBank 1 SR-Bank Group
Net commissions and other operating income was
NOK 405 million (NOK 489 million) compared with
NOK 403 million in the third quarter of 2014.
Commissions from SpareBank 1 Boligkreditt and
SpareBank 1 Næringskreditt amounted to NOK 90
million (NOK 167 million), NOK 3 million lower than
in the third quarter of 2014.
Net income from financial assets totalled NOK 116
million (NOK 195 million) compared with NOK 142
million in the third quarter of 2014. The main reason
for the reduced income in the fourth quarter of 2014
was the fall in value of the bond portfolio.
Operating costs totalled NOK 530 million (NOK 534
million) compared with NOK 520 million in the third
quarter of 2014. Costs were up by NOK 10 million
compared with the third quarter of 2014. NOK 10
million in personnel-related restructuring costs was
Unaudited
4
recognised in the fourth quarter of 2014. Other costs
increased in line with expectations in the last quarter.
The average net interest margin was 1.45% in 2014
compared with 1.42% in 2013.
Impairment losses on loans were NOK 93 million
(NOK 50 million) compared with NOK 69 million in
the third quarter of 2014, NOK 62 million of which
was due to increased group write-downs. The group
has increased group write-downs due to external
market conditions and greater uncertainty because of
lower oil prices.
Net commissions and other operating income
Preliminary annual result for 2014
The group's pre-tax profit for 2014 was NOK 2,601
million (NOK 2,347 million), up NOK 254 million
compared with 2013. The return on equity for the
year increased to 14.2% (14.0%) and the
cost/income ratio was reduced to 41.8% at year-end
2014, compared with 44.9% in 2013. The improved
result is due to a combination of higher net interest
income, good cost control and profit of NOK 202
million from the realisation of the shares in Nets
Holding AS. The better result has helped build up the
capital necessary to satisfy the capital requirements
set by the authorities.
Net interest income
The group's net interest income amounted to NOK
2,404 million in 2014 (NOK 2,119 million). Net
interest income must be viewed in the context of
commissions and profit contributions from SpareBank
1 Boligkreditt and SpareBank 1 Næringskreditt.
Commissions from these companies amounted to
NOK 468 million in 2014 (NOK 611 million), whilst
profit contributions before tax were NOK 111 million
(NOK 103 million). Net interest income, commissions
and profit contributions before tax increased by a
total of NOK 150 million in 2014 compared with
2013.
Net commissions and other operating income totalled
NOK 1,732 million in 2014 (NOK 1,824 million).
Net commissions totalled NOK 1,292 million in 2014
(NOK 1,380 million). NOK 143 million of the NOK 88
million year-on-year reduction is attributable to lower
commissions from SpareBank 1 Boligkreditt and
SpareBank 1 Næringskreditt. The reduction was due
to the group reducing the proportion of sold loans to
the mortgage companies by a total of NOK 13.5
billion in 2014 compared with year-end 2013. Other
commissions were up by around 7% from 2013, with
the growth in income primarily due to arrangement
fees, brokerage commissions and insurance income.
Other operating income amounted to NOK 440
million in 2014 (NOK 444 million), with the majority
of this income stemming from real estate brokering.
Net income from financial investments
Net income from financial investments was NOK 778
million in 2014 (NOK 555 million). Capital gains on
securities amounted to NOK 140 million (capital
losses of NOK 81 million) and capital gains on
interest rate and currency trading amounted to NOK
96 million (capital gains of NOK 248 million).
Furthermore, income from ownership interests
totalled NOK 506 million (NOK 355 million) and
dividends totalled NOK 36 million (NOK 33 million).
Capital gains on securities of NOK 140 million in 2014
were derived from capital losses of NOK 92 million
from the interest portfolio and capital gains of NOK
232 million from the portfolio of shares and equity
certificates, of which the profit from realising the
shares in Nets Holding AS accounted for NOK 202
million. The sale of SpareBank 1 SR-Bank's 2.9%
stake in Nets Holding AS was completed in July 2014.
The capital losses from the interest portfolio were
primarily attributable to the fall in the estimation of
the value of high yield bonds in SR-Bank Markets,
with offshore commercial paper being particularly
affected, where the largest fall came in the fourth
quarter due to lower oil prices.
Income from ownership interests increased by NOK
151 million compared with 2013.
SpareBank 1 SR-Bank Group
Unaudited
5
recurring costs of
restructuring costs.
Table 1, The share of net profit
The share of net profit after tax
SpareBank 1 Gruppen
31.12.14 31.12.13
356
216
SpareBank 1 Boligkreditt
49
66
SpareBank 1 Næringskreditt
32
7
BN Bank
66
59
Other
Total income from ownership interests
3
7
506
355
The share of the net profit from SpareBank 1
Gruppen increased by NOK 140 mill in 2014 and
accounted for the largest proportion of higher income
from ownership interests. The higher result in
SpareBank 1 Gruppen was primarily due to the
improvement in SpareBank 1 Skadeforsikring's result
due to a reduction in the year's paid compensation
and the recognition of profit prior years as income.
The share of the net profit from SpareBank 1
Næringskreditt increased by NOK 25 million in 2014.
The increase is primarily attributable to the
introduction of a target of an 8% return after tax on
B shares (loans to BN Bank) from and including 1
January 2014, which means in reality that BN Bank
pays more to SpareBank 1 Næringskreditt. No such
requirement applied to the return in 2013.
Operating costs
The group's operating costs totalled NOK 2,056
million in 2014. This represents an increase of NOK
37 million (1.8%) compared with 2013. Personnel
costs rose by NOK 6 million (0.5%) to NOK 1,202
million, while other costs increased by NOK 31 million
(3.7%) to NOK 854 million.
The change in personnel costs was due to a NOK 24
million increase in pension costs, a NOK 4 million
increase in bonus provisions and non-recurring costs
of NOK 5.5 million in connection with marking the
group's 175th anniversary. Other personnel costs
were reduced by a total of NOK 27 million in 2014
due to the number of full time equivalent positions in
the group being reduced by 59 over the last year.
The group has continuously adjusted the resources
assigned to the office network to enable it to focus
more heavily on digital distribution channels in the
future and has, during the last two years, reduced its
number of full time equivalent positions by 109.
Personnel costs in 2014 were charged with nonrecurring costs of NOK 15.3 million linked to pensions
and personnel-related restructuring costs. Personnel
costs in 2013 were similarly affected by non-
SpareBank 1 SR-Bank Group
NOK
37
million
related
to
Other operating costs increased by NOK 30 million.
NOK 26 million of this was due to ICT costs and NOK
19.1 million was due to the liquidation of goodwill in
connection with the sale of EiendomsMegler 1
Forvaltning AS. Other administration and operating
costs were either unchanged or reduced.
The group's cost/income ratio, costs measured as a
percentage of income, was 41.8% (44.9%) for 2014.
Adjusted for income of NOK 202 million linked to the
write-up of the shares in Nets Holding AS, the
cost/income ratio for the group was 43.6 %.
Corrected for non-recurring costs linked to pensions
and the personnel-related restructuring costs
mentioned above, as well as the write-down of
goodwill, total operating costs increased by NOK 39
million (2.0%) compared with 2013. The annual
normalised growth in costs in ordinary operations is
expected to be around 2%.
Impairment
performance
losses
on
loans
and
non-
In 2014, the group recognised net impairment losses
on loans totalling NOK 257 million (NOK 132 million).
This corresponds to impairments as a percentage of
gross loans of 0.20% (0.11%). Impairments on
groups of loans increased by NOK 75 million in 2014.
The group has increased group write-downs due to
external market conditions and greater uncertainty
because of lower oil prices.
Closely monitoring customers and preventive work
are important tools in maintaining this good credit
quality, and contribute to the continued moderate
write-downs on loans.
Gross non-performing commitments amounted to
NOK 427 million at year-end 2014 (NOK 830 million).
This corresponds to 0.30% (0.69%) of gross loans.
The portfolio of impaired 1 (not non-performing) loans
totalled NOK 513 million (NOK 439 million). This
corresponded to 0.36% (0.37%) of gross loans. Total
non-performing and impaired loans at year-end 2014
came to NOK 940 million (NOK 1,269 million). In
terms of gross loans, this represents a reduction over
the last 12 months from 1.06% to 0.66%.
1
From and including the second quarter of 2014, nonperforming loans in the 30-90 days interval are not included
as impaired loans. The historical figures have been revised.
Unaudited
6
The loan loss provision ratios, measured as individual
write-downs as a percentage of non-performing and
impaired loans, were 22% (26%) and 45% (53%) at
year-end 2014.
commitments of less than NOK 10 million. These
account for around 68% of loan exposure and
approximately 99% of customers. 19.6% of loan
exposure is to customers who have loans in excess of
NOK 100 million. The credit quality of this part of the
portfolio is better than the rest of the portfolio.
Deposits from customers rose by 13.7% (6.0%) over
the last 12 months to NOK 81.5 billion (NOK 71.7
billion). Deposits from the corporate market and
public sector accounted for 52.5% (49.5%) of the
group's customer deposits at year-end 2014.
In addition to good growth in ordinary customer
deposits, the group also increased the capital under
management in alternative investment products from
NOK 13.9 billion to NOK 15.5 billion at year-end
2014. This management is primarily performed by
SR-Forvaltning AS and ODIN Forvaltning AS.
Loans to and deposits from customers
Gross loans at year-end 2014 amounted to NOK
141.6 billion (NOK 120.3 billion). Including loans
totalling NOK 32.9 billion (NOK 46.4 billion) sold to
SpareBank 1 Boligkreditt and SpareBank 1
Næringskreditt, gross loans amounted to NOK 174.5
billion at year-end 2014 (NOK 166.7 billion). Gross
lending growth over the last 12 months was 4.7%
(5.3%). The group has fulfilled its goal of reducing
lending growth as one of several measures
implemented to satisfy new, stricter capital
requirements. Loans to the retail market dropped
from 63.4% to 63.0% of total loans (including loans
sold to SpareBank 1 Boligkreditt and SpareBank 1
Næringskreditt) in 2014.
The deposit coverage ratio at year-end 2014,
measured as deposits as a percentage of gross loans,
was 57.5% (59.6%). The group continued its policy
of maintaining a high proportion of long-term funding
in 2014, and the Financial Supervisory Authority of
Norway's Funding Indicator 1 (ratio of illiquid assets
financed by debt with a duration of more than 1
year) is 109.0% for the parent bank and 110.7% on
a consolidated basis.
Business areas
SpareBank 1 SR-Bank's financial management is
based on different business areas that are defined on
the basis of their form of distribution, products and
customers. The reporting format is based on the risk
and return profile of the assets and is split into the
retail market (including the self-employed), corporate
market, capital market and subsidiaries of significant
importance.
Retail market division 2
The retail market division's profit contribution before
impairment losses on loans amounted to NOK 1,370
million in 2014. This represents an improvement of
NOK 44 million in the result from NOK 1,326 million
2
The group's total loan exposure of NOK 174.5 billion
includes a majority of commitments with a
probability of default of less than 0.5%. These
commitments represent 56% of the portfolio. The
total
lending
portfolio
primarily
consists
of
SpareBank 1 SR-Bank Group
The interest on intercompany receivables for the retail
market division and the corporate market division is
determined on the basis of expected observable market
interest rates (NIBOR) plus expected additional costs in
connection with the group's long-term funding (credit
premium). Differences between the group's actual funding
costs and the interest applied on intercompany receivables
are eliminated at the group level.
Unaudited
7
last year and was due to improved net interest
income, higher commissions and reduced costs.
Commissions from payment systems grew weakly,
while the growth within insurance and investment
services was good. The division expects somewhat
lower net interest income going forward due to
competition on prices for home mortgages.
Impairment losses on loans remain low. The
percentage of non-performing loans was 0.30% of
total loans.
The quality of the retail market portfolio is considered
very good and with low potential losses. The group
has tightened requirements in the last year in order
to reduce the risk associated with new home
mortgages. The proportion of loan exposure
(including the portfolio in SpareBank 1 Boligkreditt)
within a loan-to-collateral value ratio of 85% was
stable, at a high level, and was 91.3%. The IRB risk
weightings for home mortgages have developed
stably in the last three quarters and reflect a solid
portfolio. An increase in the regulatory LGD floor,
from 10% to 20%, for calculating risk weightings for
home mortgages was introduced from the first
quarter of 2014. The Financial Supervisory Authority
of Norway has warned that regulatory home
mortgage weightings will be further tightened from
2015.
The division practises good costs management and
costs were reduced by 5.4% in 2014. The number of
employees in the division has been reduced through
continuous restructuring.
The 12-month lending growth figure at year-end
2014 was 4.2%, while deposits grew by 8.9% over
the previous 12 months. The low growth within loans
was due in part to the competition situation and
some weaker housing prices in Rogaland. The growth
within deposits, unit trusts and money market funds
was good. This is the result of a long-term focus on
investment advice.
The division gained 5,900 new retail customers aged
over 13 in 2014. The growth in customers was
stronger than in 2013. The proportion of bank
customers who use digital channels is very high and
the focus on digital services and channels will
continue. SpareBank 1 launched the first 'wristwatch
bank' in Norway in the fourth quarter of 2014. This
enables SpareBank 1 customers to check their
balance and latest transactions using their smart
watch.
SpareBank 1 SR-Bank Group
Corporate market division 2 3
The corporate market division's profit contribution
before impairment losses on loans amounted to NOK
1,082 million in 2014. The NOK 123 million
improvement in the result compared with 2013 is
attributable to an increase in net interest income and
other operating income, at the same time as costs
have been reduced.
Over the last 12 months, the division's lending has
increased by 5.2%. The division has strengthened its
focus on deposits and has in the last 12 months
enjoyed 21.6% growth here. The growth in both
loans and deposits was due to increases in both new
and existing customers. The division is actively
pushing across-the-board sales of the group's
products, and commissions and other operating
income are up compared with 2013.
The quality of the corporate market portfolio is
considered good. The average probability of default
has developed positively over time, largely due to the
stronger risk profile of the existing customer base.
The proportion of commitments with a probability of
default of less than 2.5% was 73.3% of the portfolio
at year-end 2014. The property management
portfolio represents the group's largest concentration
in a single sector and accounted for 15.6% of total
loan exposure, including retail customers. A large
portion of this portfolio consists of financing
commercial properties for leasing. The portfolio is
characterised by long-term leases and financially
solid tenants. Despite the increasing vacancy rate in
the group's market area, the proportion of vacant
floor space in the group's loan portfolio remains
limited. A special review of the portfolio has been
conducted in order to uncover the potential effects of
the recent fall in oil prices. The review confirmed the
impression that the portfolio is robust.
Net individual write-downs of NOK 164 million were
recognised in 2014, compared with NOK 130 million
in 2013. In 2014, the division increased group writedowns due to external market conditions and greater
uncertainty because of lower oil prices. The division's
ordinary pre-tax profit (after losses) was NOK 27
million lower than in 2013.
Priority areas for the division are balanced and longterm volume growth, good customer relationships
and a well-developed range of products.
Unaudited
8
Capital market division 3
Securities activities are organised under the SR-Bank
Markets brand and include customer and own
account trading in fixed income instruments, foreign
exchange and equities, analysis and corporate
finance services.
In 2014, SR-Bank Markets achieved an operating
result before the allocation of customer income to
other business areas of NOK 71 million. This
represents a decrease of NOK 36 million from the
same period in 2013 and is primarily attributable to
lower
income
from
interest
and
currency
instruments, as well as the fall in value of the bank's
bond portfolio. The pre-tax profit after the allocation
of customer income amounted to NOK 19 million in
2014, a reduction of NOK 76 million from 2013.
The bulk of this income came from customer trading
in fixed income and foreign exchange instruments.
Credit spreads for oil and offshore related bonds
expanded strongly in the fourth quarter and resulted
in a fall in the value of the bank's trading portfolio.
Corporate finance has enjoyed good activity with
more completed transactions, while income from the
sale of equities and bonds has been relatively stable.
Income from advice and sales of securities is
expected to increase in 2015 as a result of SR-Bank
Markets' acquisition of Swedbank's Stavanger office.
Subsidiaries and associated companies
EiendomsMegler 1 SR-Eiendom AS
The company's pre-tax profit amounted to NOK 55.5
million in 2014 (NOK 41.9 million).
The
improvement in the result is an effect of increased
volume, cost reducing measures and more efficient
operations.
In 2014, 7,540 (7,246) properties were sold with a
total value of around NOK 22.5 billion. The supply of
new assignments was good and on a par with 2013.
There are significant differences in the regional
markets, both with respect to price and turnover
times. The housing market in Bergen is very good
3
The capital market division serves customers throughout
the group. Previously, most of the income this division
generates was recognised in the division. The internal
income recognition policy was changed on 1 January 2014
and income is now recognised, in its entirety, in the business
area to which the customer belongs. Historical accounting
figures have not been changed since the accounting effect is
considered to be insignificant.
SpareBank 1 SR-Bank Group
with record low turnover times and a rise in prices of
almost 10% from the year before. Turnover times in
the Stavanger region have stabilised at just over 30
days, while prices have risen moderately by
2.4%. In Kristiansand, the fall in house prices has
halted and we are now seeing a rise in prices. Of the
major cities, Kristiansand has the longest turnover
time for housing at around 60 days. However, the
number of sold homes has increased throughout our
entire market area in relation to 2013, and indicates
that the property market is functioning well.
Building activity remains high and the supply of new
housing is good. Sales of new homes were on a par
with 2013. A slight increase in sales of new homes is
expected in 2015, stimulated by low interest rates.
The influx of orders within commercial property for
both premises for lease and sale is good. The number
of transactions was on a par with 2013. We are
noting a rise in the number of vacant office premises
in the Forus area, and this may have a negative
effect on the commercial property market. The rental
market for housing is being affected by the
consolidation within the oil and oil services industries.
Prices for rented housing have fallen and the
turnover rate is significantly slower than in the last
few years.
The company expects the level of activity to remain
stable in Hordaland and the Agder counties going
forward. The situation in Rogaland is somewhat more
uncertain. Rationalisation measures in the oil sector
and the risk of a further fall in the price of oil may
impact sentiment in the housing market and have a
negative effect on the level of activity and home
prices. The housing market has so far hardly been
affected by this at the start of the first quarter of
2015.
The company has strengthened its market position
since the same time in 2013. It holds a strong
position in Rogaland with a market share of more
than 40%. Its market positions in the Agder counties
and Hordaland have also been strengthened in the
same period.
SpareBank 1 SR-Finans AS
The company's main products are lease financing for
the business sector and car and boat loans for retail
customers.
SpareBank 1 SR-Finans is the leading
leasing company in Rogaland with total assets of
NOK 7.0 billion.
Unaudited
9
The company achieved a pre-tax profit of NOK 145.9
million in 2014 (NOK 149.0 million). The reduction in
pre-tax profit in 2014 is primarily attributable to the
fact that the result in 2013 was affected by lower
losses due to a reversal of previous impairment
losses on loans. Profit before impairments and losses
was NOK 155.1 million (NOK 149.9 million).
Net lending increased by 8.8% in 2014 and at yearend 2014 it amounted to NOK 6,771 million (NOK
6,224 million). 6,907 new contracts were established
in 2014 (7,083 contracts) with a total volume of NOK
2,569 million (NOK 2,374 million).
Good growth is still expected in both car loans for
retail customers and lease financing for the corporate
market.
SpareBank 1 Gruppen AS
SpareBank 1 Gruppen AS is a holding company that
develops and delivers common IT/mobile solutions,
brands and marketing concepts, business concepts,
products
and
services,
expertise,
analyses,
processes, best practice solutions and purchases for
the banks in the SpareBank 1 Alliance. Its
subsidiaries
produce,
deliver
and
distribute
SpareBank 1 Gruppen products within P&C insurance,
life insurance, fund management, factoring, debt
collection and long-term monitoring.
SpareBank 1 Gruppen achieved a net profit of NOK
1,849 million in 2014 (NOK 1,097 million). The
improvement in the result was due to good profit
performance in the group's major business areas.
SpareBank 1 Skadeforsikring made a particularly
significant contribution with a NOK 585 million
improvement on its result from 2013. The good
progress made by SpareBank 1 Skadeforsikring was
due to an improvement in the insurance result
because of lower compensation costs and higher
profit prior years.
SpareBank 1 SR-Bank owned a 19.5% stake in
SpareBank 1 Gruppen at year-end 2014.
SpareBank 1 Boligkreditt AS and SpareBank 1
Næringskreditt AS
SpareBank 1 Boligkreditt and SpareBank 1
Næringskreditt are licensed mortgage companies that
issue covered bonds secured by home mortgage loan
or commercial real estate portfolios sold by the
owner banks. The companies are owned by the
savings banks that make up the SpareBank 1 Alliance
SpareBank 1 SR-Bank Group
and help ensure the owner banks have access to
stable, long-term funding at competitive rates.
SpareBank 1 Boligkreditt's total lending volume at
year-end 2014 amounted to NOK 161.2 billion, NOK
32.3 billion (NOK 45.7 billion) of which were home
mortgages bought from SpareBank 1 SR-Bank. In the
first and second quarter, the bank completed a buyback of loans worth a total of NOK 14.5 billion from
SpareBank 1 Boligkreditt. The bank currently owns a
20.1% stake in the company. This is normally
updated at the end of each year in line with the
volume sold.
SpareBank 1 Næringskreditt's total lending volume at
year-end 2014 amounted to NOK 16.1 billion, NOK
0.6 billion (NOK 0.6 billion) of which were loans
bought from SpareBank 1 SR-Bank. The bank owns a
26.8% stake in the company.
Funding
The group had good access to funding at competitive
prices in 2014. The volatility in the international
market during the year did not noticeably effect the
bank's funding.
SpareBank 1 SR-Bank had good liquidity at the end
of the fourth quarter of 2014 and believes it will
continue to have good access to long-term funding at
competitive prices. In the third quarter interim report
the bank announced that the board had decided to
apply for a licence for a wholly owned home
mortgage company. The bank received the licence to
be issued in the first quarter of 2015 and expects the
newly established company to be in a position to
issue covered bonds during the second quarter. The
group strives to achieve an even maturity structure
for funding and believes it is important to have good
relations with Norwegian and international investors
and banks. The liquidity buffer 4 amounted to NOK
18.2 billion at year-end 2014. NOK 5.7 billion of the
bank's external funding will fall due in the next 12
months. In addition to the liquidity buffer, the bank
has NOK 27.4 billion in home mortgages ready for
covered bond funding.
4
Liquidity buffer: cash, short-term investments, and drawing
rights in Norges Bank (bonds including covered bonds).
Providing deposits and lending remain unchanged, and no
new borrowing during the period.
Unaudited
10
Capital adequacy
At year-end 2014, the common equity tier 1 capital
ratio was 11.5%, up from 11.1% at the same time in
2013. In the same period, the tier 1 capital ratio
dropped from 12.8% to 12.3%, due to redemption of
Tier 1 capital instruments, while the total capital
ratio rose from 14.1% to 14.5%. Because of the
transitional rules, the minimum requirement for
capital adequacy cannot amount to less than 80% of
the corresponding amount calculated according to
the Basel I rules. The transitional rule was binding for
SpareBank 1 SR-Bank up to and including 30 June
2014 and may become applicable again when A-IRB
approval is granted for corporate market loans.
SpareBank 1 SR-Bank has applied to the Financial
Supervisory Authority of Norway for approval to use
A-IRB for corporate market loans and expects
clarification during the first quarter of 2015.
New, stricter capital adequacy regulations were
adopted by the EU in June 2013. Norway has chosen
to introduce the requirements slightly faster than it is
required to by the implementation deadline in the
international rules. From 1 July 2014, the common
equity tier 1 capital ratio requirement is 10.0% and
the capital ratio requirement is 13.5%, and these
have thus been met by a good margin by SpareBank
1 SR-Bank.
In addition to this, there will be a countercyclical
capital buffer requirement in Norway in the range of
0-2.5% in the form of common equity tier 1 capital.
On 26 September 2014, on the advice of Norges
Bank, the Ministry of Finance set the buffer at 1
percentage point from 30 June 2015.
On 12 May 2014, the Ministry of Finance issued
regulations
concerning
systemically
important
financial institutions (SIFI). Institutions with total
assets of at least 10% of Mainland Norway's GDP, or
at least a 5% share of the market for loans, will be
SpareBank 1 SR-Bank Group
covered by this definition. Upon implementation,
DNB, Nordea Bank Norway and Kommunalbanken
Norway were defined as systemically important. The
three SIFI banks will thus be subject to a special
capital buffer requirement from 1 July 2015. From 1
July 2016, when the new capital requirements have
been fully implemented, the systemically important
institutions must satisfy a minimum requirement for
their common equity tier 1 capital ratio of 12%, while
the minimum requirement for other institutions will
be 10%. The countercyclical capital buffer comes on
top of this. SpareBank 1 SR-Bank is close to the SIFI
requirement concerning market share and takes
account of this in its capital planning.
On 1 July 2014, the Financial Supervisory Authority
of Norway published a circular on the further
tightening of risk weighting for home mortgages for
banks that use internal methods, so-called IRB
methods. The tightening of probability of default
models, combined with a higher minimum level for
loss given default, the so-called LGD floor, from 1
January 2014 will increase the average risk weighting
for SpareBank 1 SR-Bank's home mortgages portfolio
to around 22-24%. The change must be reflected in
capital adequacy reporting by no later than the first
quarter of 2015. Meanwhile, the stricter requirements
for foreign banks' branches in Norway will be
implemented via Pillar 2, meaning that their reported
financial strength will, seen in isolation, not be
affected. Compared with other Nordic banks,
Norwegian IRB banks will thereby appear to be
relatively
weaker
capitalised.
The
stricter
requirements will, for the time being, have little
overall effect on capital adequacy in the Norwegian
banking sector since most Norwegian IRB banks are
still bound by the Basel I floor.
The bank's shares
The share price for the bank's shares (SRBANK) was
NOK 52.50 at year-end 2014. This represents an
increase of 12.8% since year-end 2013. The main
Oslo Stock Exchange index rose by 4.9% in the same
period. 7.7% (6.3%) of outstanding SRBANK shares
were traded in the fourth quarter of 2014.
There were 10,422 (11,151) shareholders of SRBANK
at year-end 2014. The proportion owned by foreign
companies and individuals increased from 14.1 % at
year-end 2013 to 22.4% at year-end 2014, whilst
48.9% were owned by residents of Rogaland, the
Agder counties and Hordaland. The 20 largest
shareholders owned 64.4% of the shares. The bank
Unaudited
11
holds 231,043 treasury
employees owned 1.8%.
shares,
while
group
The table below shows the 20 largest shareholders as
at 31 December 2014:
Table 2, 20 largest shareholders
Sparebankstiftelsen SR-Bank
Gjensidige Forsikring ASA
State Street Bank and Trust C o, U.S.A.
Morgan Stanley & C o LLC , U.S.A.
Folketrygdfondet
SpareBank 1-stiftinga Kvinnherad
Wimoh Invest AS
Skandinaviska Enskilda Banken, Sverige
Vpf Nordea Norge Verdi
State Street Bank and Trust C o, U.S.A.
State Street Bank and Trust C o, U.S.A.
C lipper AS
MSC O Equity Firm Account, U.S.A.
J.P. Morgan C hase Bank N.A., U.K.
Danske Invest Norske Instit. II
The Bank of New York Mellon, U.S.A.
Westco
Pareto Aksje Norge
Odin Norge
FLPS-Princ All Sec Stock Sub, U.S.A.
Total 20 largest
Number of
shares
(1,000)
%
72.419 28,32 %
26.748 10,46 %
8.644
3,38 %
8.232
3,22 %
2,76 %
7.070
2,43 %
6.227
2,25 %
5.761
3.908
1,53 %
3.260
1,27 %
3.044
1,19 %
2.748
1,07 %
2.525
0,99 %
2.287
0,89 %
2.083
0,81 %
0,75 %
1.925
1.865
0,73 %
1.578
0,62 %
1.544
0,60 %
1.474
0,58 %
1.434
0,56 %
164.775 64,43 %
Accounting policies
Please refer to note 1 for a description of the
accounting policies applied in the parent company's
and consolidated financial statements. The same
accounting policies are applied in interim and annual
financial statements.
Events after the balance sheet date
In January 2015, the group agreed to acquire
Swedbank's branch in Stavanger. In January 2015,
the group acquired the Rogaland branch of
SpareBank 1 Regnskapshuset Østlandet AS, which
includes three offices in Stavanger, Sandnes and
Ålgård respectively,. Both acquisitions were effective
from the first quarter of 2015.
Otherwise, no material events have been registered
after 31 December 2014.
years. A reduction of nearly 15% in relation to 2014
is expected in 2015. Both oil companies and the
supplier industry are in the process of rationalising
operations and reducing costs. The risk of lower
growth in the Norwegian economy has consequently
increased. Estimates vary from simply a minor
negative effect to more serious consequences for
employment, all depending on whether oil prices
remain low over time or not.
In the last year, the Stavanger region has seen
somewhat weaker rises in house prices than the rest
of the country, but the turnover volume is still high.
This development must be seen in the context of
house prices having grown much more in recent
years in Stavanger and Rogaland than in the rest of
the country. A higher degree of uncertainty about
how the economy will develop may contribute to
dampening the demand for loans, while lower
interest rates and wages growth have the opposite
effect. Non-performance and loan loss provisions are
therefore expected to remain moderate in 2015 as
well. The board would like to stress that a certain
level of uncertainty is associated with assessments of
future conditions.
Competition in the banking market is increasing and
significantly so with respect to home mortgage
customers. The group therefore announced at the
beginning of January that it has decided to lower its
home mortgage rate. The negative effect on the
group's net interest margin will partly be countered
by the terms for deposits also being adjusted, as well
as falling funding costs in the group's funding
portfolio.
SpareBank 1 SR-Bank is a solid, profitable group, but
must, like other banks, continue to strengthen its
solidity in line with the capital requirements set by
the authorities. Because of its good earnings from a
business model with good breadth and efficient
operations, the group is well-positioned to implement
the necessary build-up of capital, while ensuring
good competitiveness.
Future prospects
Oil prices fell dramatically in the latter half of 2014
and the low prices continued at the start of 2015.
The lower oil prices have increased the uncertainty,
especially in the petroleum sector. Oil investments
flattened out in 2014 after having increased by
almost 9% annually in each of the preceding three
SpareBank 1 SR-Bank Group
Stavanger, 4 February 2015
The Board of Directors of SpareBank 1 SR-Bank ASA
Unaudited
12
Income statement
Parent bank
Group
Note
01.01.13 - 01.01.14 31.12.13 31.12.14
01.01.14 - 01.01.13 31.12.14 31.12.13
Q4 2013
Q4 2014
1.416
896
1.530
932
5.442
3.535
5.918
3.736
Interest income
Interest expense
6.137
3.733
520
598
1.907
2.182
Net interest income
387
19
1
311
18
1
1.409
73
12
1.319
73
6
369
294
1.348
1.252
0
0
98
0
30
-55
33
412
249
24
473
125
98
-25
694
622
987
867
3.949
4.056
241
97
69
226
114
64
906
381
251
900
412
244
Personnel expenses
Administrative expenses
Other operating costs
407
404
1.538
1.556
Total operating costs
580
463
2.411
2.500
Operating profit before impairment losses
37
86
116
248
543
377
2.295
2.252
117
94
457
446
426
283
1.838
1.806
Q4 2014
Q4 2013
5.644
3.525
1.588
933
1.466
892
2.404
2.119
655
574
Commission income
Commission expenses
Other operating income
1.370
78
440
1.452
72
444
322
19
102
392
12
109
Net commission and other income
1.732
1.824
405
489
Dividend income
Income from investment in associates
Net gains/losses on financial instruments
36
506
236
33
355
167
1
138
-23
-2
95
102
Net income on financial investments
778
555
116
195
Income statement (MNOK)
Total income
14
Impairment losses on loans and guarantees
Pre-tax profit
4.914
4.498
1.176
1.258
1.202
468
386
1.196
432
391
308
128
94
323
109
102
2.056
2.019
530
534
2.858
2.479
646
724
2, 3 and 4
257
132
93
50
12
2.601
2.347
553
674
Tax expense
Profit after tax
506
487
105
107
2.095
1.860
448
567
Other comprehensive income
-24
7
-1
-18
-6
0
-6
-149
40
0
-109
0
0
0
-67
19
-1
-49
-6
0
-6
-415
112
0
-303
0
0
0
Unrecognised actuarial gains and losses
Deferred tax concerning changed estimates/pension plan changes
Change in value of financial assets available for sale
Total items not reclassified through profit or loss
Tax change actuarial gains/losses
Share of profit associated companies and joint ventures
Total items reclassified through profit or loss
-444
120
0
-324
0
5
5
-72
20
-1
-53
-6
4
-2
-166
45
0
-121
0
-11
-11
-25
7
-1
-19
-6
3
-3
-24
-109
-55
-303
Other comprehensive income
-319
-55
-132
-22
402
174
1.783
1.503
Total comprehensive income
1.776
1.805
316
545
8,20
7,28
1,75
2,22
Earnings per share (group)
SpareBank 1 SR-Bank Group
Unaudited
13
Balance sheet
Parent bank
Note
Group
31.12.13
31.12.14
Balance sheet (MNOK)
31.12.14
31.12.13
1.265
6.669
113.312
21.052
4.929
780
84
3.552
950
2.998
1.847
8.117
134.158
15.248
7.344
477
22
3.250
1.226
1.605
Cash and balances with central banks
Balances with credit institutions
Loans to customers
Certificates, bonds and other fixed-income securities
Financial derivatives
Shares, ownership stakes and other securities
Business available for sale
Investment in associates
Investment in subsidiaries
Other assets
5
1.847
2.222
140.920
15.261
7.340
626
22
4.727
0
1.961
1.265
1.253
119.525
21.065
4.923
938
85
4.710
0
3.221
155.591
173.294
Total assets
12
174.926
156.985
3.746
6.429
71.840
52.328
2.013
2.527
4.004
6.145
0
81.723
63.253
3.317
2.095
2.964
Balances with credit institutions
Public sector deposits regarding the covered bonds swap agreement
Deposits from customers
7
Listed debt securities
11
Financial derivatives
10
Other liabilities
6
Subordinated loan capital
11
6.139
0
81.489
63.253
3.317
2.361
2.964
3.742
6.429
71.667
52.328
2.013
2.746
4.004
142.887
159.497
159.523
142.929
6.394
1.587
409
162
4.152
0
6.394
1.587
512
59
5.245
0
6.394
1.587
512
59
6.851
0
6.394
1.587
409
162
5.504
0
12.704
13.797
15.403
14.056
155.591
173.294
174.926
156.985
SpareBank 1 SR-Bank Group
3, 8
13
10
17
Total liabilities
Share capital
Premium reserve
Proposed dividend
Fund for unrealised gains
Other equity
Profit/loss at period end
Total equity
Total liabilities and equity
Unaudited
12
14
Statement of changes in equity
Reserve
Share-
Premium
Other
for unrealised
Total
SpareBank 1 SR-Bank Group (Amounts in NOK million)
capital
reserve
equity
gains
equity
Equity as of 31.12.2012
6.385
1.587
4.593
72
12.637
Reclassification of treasury shares
9
-9
Profit after tax
1.769
Unrecognised actuarial gains and losses after tax
Share of profit associated companies and joint ventures
1.715
Adjusted equity accosiates
Dividend 2012, resolved in 2013
Purchase/sale of own shares
1.860
-58
-1
-1
90
1.805
4
Total items not reclassified through profit or loss
Equity as of 31.12.2013
91
-58
Change in value of financial assets available for sale
Items reclassified through profit or loss
0
4
-11
-11
-384
-384
9
9
0
0
-375
0
-375
6.394
1.587
5.913
162
14.056
2.198
-103
2.095
Profit after tax
Unrecognised actuarial gains and losses after tax
-324
-324
Change in value of financial assets available for sale
0
0
Share of profit associated companies and joint ventures
5
Total items not reclassified through profit or loss
1.879
Adjusted equity accosiates
Dividend 2013, resolved in 2014
Purchase/sale of own shares
Items reclassified through profit or loss
5
-103
1.776
-19
-19
-409
-409
-1
-1
0
0
-410
0
-410
Equity as of 31.12.2014
6.394
1.587
7.363
59
15.403
SpareBank 1 SR-Bank Group
Unaudited
15
Cash flow statement
Parent bank
Group
01.01.13 - 31.12.13
01.01.14 - 31.12.14
-10.382
-20.812
4.724
5.214
Interest receipts from lending to customers
4.084
9.883
Change in deposits from customers
9.822
4.073
-1.777
-1.760
Interest payments on deposits from customers
-1.734
-1.764
-2.220
-4.602
Change in receivables and deby from credit institutions
-4.129
-2.048
-327
-256
-2.380
5.804
530
480
893
2.076
125
267
-1.376
-1.537
-132
-280
1.530
1.486
-6.708
-4.037
-61
-70
Cash flow statement
Change in gross lending to customers
Interest on receivables and debt to financial institutions
Change in certificates and bonds
Interest receipts from commercial paper and bonds
Commission receipts
Capital gains from sale of trading
Payments for operations
Taxes paid
Other accruals
A Net change in liquidity from operations
Investments in tangible fixed assets
Receipts from sale of tangible fixed assets
15
47
-177
-456
338
870
442
497
Dividends from long-term investments in equities
557
888
B Net cash flow, investments
15.830
15.659
-8.330
-8.292
-820
-1.058
499
44
-694
-1.115
-220
-222
0
0
-384
-409
5.881
4.607
-270
1.458
Change in long-term investments in equities
Receipts from sales of long-term investments in equities
01.01.14 - 31.12.14
01.01.13 - 31.12.13
-21.347
-10.760
5.570
5.116
-438
-501
5.804
-2.388
480
530
2.557
1.405
267
125
-2.084
-1.837
-377
-209
1.563
1.552
-4.046
-6.706
-81
-73
47
15
-466
-203
884
363
509
442
893
544
Debt raised by issuance of securities
15.659
15.830
Repayments - issuance of securities
-8.292
-8.330
Interest payments on securities issued
-1.058
-820
Additional subordinated loan capital issued
44
499
Repayments - additional capital instruments
-1.115
-694
-222
-220
Interest payments on subordinated loans
Issue shares
0
0
-409
-384
C Net cash flow, financing
4.607
5.881
A+B+C Net cash flow during the period
1.454
-281
Dividend to share holders
1.796
1.526
Cash and cash equivalents as at 1 January
1.542
1.823
1.526
2.984
Cash and cash equivalents as at 31 March
2.996
1.542
1.265
1.847
Cash and balances with central banks
1.847
1.265
261
1.137
Balances with credit institutions
1.149
277
1.526
2.984
Cash and cash equivalents
2.996
1.542
Cash and cash equivalents specified
The cash and cash equivalents includes cash and claims on central banks, plus the share of the total of claims on credit institutions that pertains to placement
solely in credit institutions. The cash flow statement shows cash provided and used by Sparebank 1 SR-Bank and Sparebank 1 SR-Bank Group.
SpareBank 1 SR-Bank Group
Unaudited
16
Notes to the financial statements
(in MNOK)
Note 1 Accounting policies
1.1 Basis of preparation
These interim financial statements for SpareBank 1 SR-Bank ASA cover the period 1 January - 31 December 2014. The interim financial statements were prepared in
accordance with IAS 34 Interim Financial Reporting. The interim financial statements are unaudited. These interim financial statements were prepared in accordance with
the applicable IFRS standards and IFRIC interpretations.
The interim financial statements do not include all the information required for full annual financial statements and should be read in conjunction with the annual financial
statements for 2013.
With effect from 1 January 2014, SpareBank 1 SR-Bank ASA implemented IFRS 10, 11 and 12 and associated amendments, IAS 27 (2011), IAS 28 (2011), amendments
to IAS 32, amendments to IAS 39, and IFRIC 21.
IFRS 10 Consolidated Financial Statements is based on the current principle of using the control concept as the key criterion for determining whether a company should
be included in the consolidated financial statements. The standard provides expanded guidance on determining whether control exists in cases where this is difficult.
IFRS 11 Joint Arrangements focuses on the rights and obligations of the parties to the arrangement more than its legal structure. The joint arrangements are divided into
two kinds: jointly controlled operational arrangements and joint ventures. Joint operations occur when participants have rights in relation to the assets and are liable for the
obligations in the arrangement. A participant in a joint operation recognises its share of assets, liabilities, income and costs. Joint ventures occur when participants have
rights in relation to net assets in the arrangement. Such arrangements are recognised using the equity method. The so-called gross method or proportional consolidation is
no longer permitted.
IFRS 12 Disclosure of Interests in Other Entities contains all disclosures about interests in other entities, including joint arrangements, associated companies, structured
entities and other companies that cannot be consolidated.
None of the new accounting standards or interpretations have had a material effect on the financial statements.
1.2 Critical accounting estimates and judgements
The preparation of consolidated financial statements requires management to make judgements, estimates and assumptions that affect the application of policies and
reported amounts of assets and liabilities, income and costs. The annual financial statements for 2013 provide a detailed account of critical estimates and judgements in
relation to the application of accounting policies in note 3.
Note 2
Impairment losses on loans and guarantees recognised in the income statemen
Parent bank
01.01.13 31.12.13
-31
-40
11
101
95
31
-51
116
Group
01.01.14 31.12.14
01.01.14 31.12.14
-103
69
11
217
60
0
-6
248
SpareBank 1 SR-Bank Group
Change in individual impairment losses provisions for the period
Change in collective impairment loss provisions for the period
Amortised cost
Actual loan losses on commitments for which provisions have been made
Actual loan losses on commitments for which no provision has been made
Change in assets taken over for the period
Recoveries on commitments previously written-off
The period's net losses / (reversals) on loans and advances
Unaudited
-124
75
11
228
74
0
-7
257
01.01.13 31.12.13
23
-30
11
111
108
-30
-61
132
17
Note 3
Impairment losses on loans and guarantees recognised in the balance sheet
Parent bank
Group
31.12.13
31.12.14
436
130
-239
179
0
405
42
-35
109
-2
-101
405
196
-217
302
277
Provisions for Individual impairment losses at start of period
Increases in previous provisions for individual impairment losses
Reversal of provisions from previous periods
New provisions for individual impairment losses
Amortised cost
Actual loan losses during the period for which provisions for individual impairment
losses have been made previously
Provisions for Individual impairment losses at period end
Net losses
31.12.14
31.12.13
446
42
-54
118
-2
423
131
-183
186
0
-228
322
302
-111
446
219
Non-performing and impaired loans
Note 4
Parent bank
Group
31.12.13
31.12.14
804
210
594
26 %
395
91
304
23 %
378
195
183
52 %
481
211
270
44 %
Note 5
31.12.14
31.12.13
Non-performing loans and advances
Gross non-performing loans above 90 days
Provisions for Individual impairment losses
Net non-performing loans and advances
Loan loss provision ratio
427
93
334
22 %
830
212
618
26 %
Other problem commitments
Problem commitments
Provisions for Individual impairment losses
Net other problem commitments
Loan loss provision ratio
513
229
284
45 %
439
234
205
53 %
Other assets
Parent bank
Group
31.12.13
31.12.14
0
336
847
22
35
1.599
159
2.998
0
295
29
16
35
1.053
177
1.605
Note 6
Intangible assets
Tangible fixed assets
Income earned but not received from SpareBank 1 Bolig- and Næringskreditt
Prepaid expences
Capital contribution SR-Pensjonskasse
Unsettled trades
Other assets
Total other assets
31.12.14
31.12.13
20
327
29
17
35
1.053
480
1.961
39
362
847
24
35
1.599
315
3.221
Other liabilities
Parent bank
Group
31.12.13
31.12.14
309
707
223
1
280
756
251
2.527
264
855
625
1
102
0
248
2.095
SpareBank 1 SR-Bank Group
Accrued expenses and prepaid revenue
Deferred tax
Pension liabilities
Other specified provisions
Taxes payable
Unsettled trades
Other liabilities
Total other liabilities
Unaudited
31.12.14
31.12.13
363
821
674
1
206
0
296
2.361
391
671
242
1
377
756
308
2.746
18
Note 7
Customer deposits by sector and industry
Parent bank
31.12.13
1.078
265
1.513
1.527
1.915
1.963
1.452
4.954
8.858
12.122
35.647
36.190
3
71.840
Note 8
1.121
252
2.135
1.403
2.030
2.210
1.369
6.883
9.730
15.043
42.176
39.545
2
81.723
Agriculture/forestry
Fishing/Fish farming
Mining/extraction
Industry
Power and water supply/building and construction
Retail trade, hotels and restaurants
Foreign trade shipping, pipeline transport and other transport activities
Real estate
Service industry
Public sector and financial services
Total corporate sector
Retail customers
Accrued interests corporate sector and retail customers
Deposits from customers
1.121
252
2.135
1.403
2.030
2.210
1.369
6.883
9.496
15.043
41.942
39.545
2
81.489
31.12.13
1.078
265
1.513
1.527
1.915
1.963
1.452
4.954
8.685
12.122
35.474
36.190
3
71.667
Loans by sector and industry
Parent bank
31.12.13
31.12.14
4.082
421
2.741
2.674
2.260
2.429
6.733
25.575
5.782
2.277
54.974
58.481
205
304
113.964
-405
-247
113.312
4.225
467
4.210
1.973
2.681
2.174
7.642
27.020
5.845
1.686
57.923
76.107
423
323
134.776
-302
-316
134.158
Note 9
Group
31.12.14
31.12.14
Agriculture/forestry
Fishing/Fish farming
Mining/extraction
Industry
Power and water supply/building and construction
Retail trade, hotels and restaurants
Foreign trade shipping, pipeline transport and other transport activities
Real estate
Service industry
Public sector and financial services
Total corporate sector
Retail customers
Unallocated (excess value fixed interest loans and amort. lending fees)
Accrued interests corporate sector and retail customers
Gross loans
- Individual impairment losses provisions
- Collective impairment losses provisions
Loans to customers
Group
31.12.14
31.12.13
4.458
596
4.341
2.650
3.520
2.529
8.239
27.163
7.860
1.877
63.233
77.651
411
325
141.620
-322
-378
140.920
4.326
541
2.829
3.403
3.100
2.877
7.297
25.740
7.545
2.277
59.935
59.848
209
281
120.273
-446
-302
119.525
Capital adequacy
On 22 August 2014, the Ministry of Finance stipulated amendments to the capital requirements regulations with effect from 30 September 2014. The amendments are
adjustments implemented to comply with the EU's new capital adequacy regulations for banks and securities undertakings (CRD IV/CRR) and entail the minimum
requirement for common equity Tier 1 capital ratio gradually increasing in the run up to 1 July 2016.
SpareBank 1 SR-Bank has permission from the Financial Supervisory Authority of Norway to use internal measurement methods (Internal Rating Based Approach) for
quantifying credit risk. The use of IRB requires the bank to comply with extensive requirements relating to organisation, expertise, risk models and risk management
systems. In June 2013, SpareBank 1 SR-Bank applied for transition to Advanced IRB for the corporate portfolios that are currently reported according to Foundation IRB,
and a response to the application is expected during the first quarter of 2015.
Investments in associated companies and joint ventures are recognised in the group using the equity method and in accordance with the acquisition method in the parent
bank. The investments are treated identically for the purposes of determining the capital adequacy ratio except for the group's investments in SpareBank 1 Boligkreditt,
SpareBank 1 Næringskreditt and BN Bank. A proportionate consolidation is carried out for the group's capital adequacy.
SpareBank 1 SR-Bank Group
Unaudited
19
Parent bank
Group
31.12.13
31.12.14
6.394
1.587
409
162
4.152
12.704
6.394
1.587
512
59
5.245
13.797
0
0
-409
-401
-353
0
0
0
-512
11.541
1.823
13.364
0
2.100
-401
-353
-622
0
-35
12.628
794
13.422
0
2.069
-60
0
1.346
2.009
14.710
15.431
18.771
28.175
8.467
550
5.763
663
8.275
70.663
21.786
30.354
8.429
1.011
14.468
823
6.944
83.815
2.288
675
0
2.525
0
4.738
0
5.400
-800
85.488
2.086
598
0
5.780
524
4.760
0
5.296
0
102.859
4.629
2.571
3.086
5.657
2.342
17,21 %
15,63 %
1,57 %
13,50 %
17,21 %
15,63 %
13,50 %
15,00 %
13,05 %
1,95 %
12,28 %
15,00 %
13,05 %
12,28 %
Share capital
Premium reserve
Allocated to dividend
Reserve for unrealised gains
Other equity
Total book equity
Tier 1 capital
Deferred taxes, goodwill and other intangible assets
Fund for unrealized gains, awailable for sale
Deduction for allocated dividends
50% deduction for subordinated capital in other financial institutions
Deduction for expected losses on IRB, net of write-downs
50 % capital adequacy reserve
Deduction for common equity Tier 1 capital in essential investments in financial institu
Value of derivative liabilities at fair value
Total Common equity Tier 1 capital
Tier 1 capital instruments
Total Tier 1 capital
Tier 2 capital
Tier 2 capital - Tier 1 capital instruments in excess of 15%
Term subordinated loan capital
50% deduction for investment in capital instruments in other financial institutions
50% deduction for expected losses on IRB, net of write-downs
Deduction for essential investments in financial institutions
50 % capital adequacy reserve
Total Tier 2 capital
31.12.14
31.12.13
6.394
1.587
512
59
6.851
15.403
6.394
1.587
409
162
5.504
14.056
-24
0
-512
-43
0
-409
-104
-356
-587
-676
-326
-48
13.817
1.011
14.828
0
2.697
-60
12.557
1.954
14.511
0
2.451
-104
-356
2.637
-587
1.404
Net primary capital
17.465
15.915
Credit risk Basel II
SME exposure
Specialised lending exposure
Other corporations exposure
SME retail exposure
Retail mortage exposure (properties)
Other retail exposure
Equity investments
Total credit risk IRB
21.789
32.685
8.789
1.144
20.661
845
0
85.913
18.771
28.175
8.467
650
10.713
762
0
67.538
1.978
598
0
6.869
1.127
6.220
0
17.484
0
120.189
2.088
675
0
3.675
Debt risk
Equity risk
Currency risk
Participations calculated after other market risk
Credit value adjustment risk (CVA)
Operational risk
Transitional scheme
Participations calculated using standard method
Deductions
Risk weighted balance
Minimum requirement for common equtiy Tier 1 capital ratio 4,5 %
Buffer requirement
Capital conservation buffer 2,5 %
Systemic risk buffer 3 %
Total buffer requirement to common equity Tier 1 capital ratio
Available common equity Tier 1 capital ratio after buffer requirement
Capital ratio
Tier 1 capital ratio
Tier 2 capital ratio
Common equity Tier 1 capital ratio
Capital ratio, IRB
Tier 1 capital ratio, IRB
Common equity Tier 1 capital ratio, IRB
SpareBank 1 SR-Bank Group
Unaudited
5.713
14.487
20.362
-1.463
113.075
5.409
3.005
3.606
6.610
1.798
14,53 %
12,34 %
2,19 %
11,50 %
14,53 %
12,34 %
11,50 %
14,07 %
12,83 %
1,24 %
11,11 %
16,14 %
14,72 %
12,74 %
20
Note 10 Financial derivatives
Contract amount
31.12.14
At fair value through profit and loss
Currency instruments
Currency forward contracts
Currency swaps
Currency options
Total currency instruments
Fair value at 31.12.14
Assets
Liabilities
4.661
32.235
25
36.921
288
1.332
0
1.620
80
498
0
578
Interest rate instruments
Interest rate swaps(including cross-currency)
Other interest rate contracts
Total interest rate instruments
69.404
0
69.404
2.528
0
2.528
2.334
0
2.334
Hedging / Interest rate instruments
Interest rate swaps (including cross currency)
Total hedging / Interest rate instruments
53.065
53.065
2.341
2.341
109
109
851
851
296
296
1.620
4.869
851
7.340
578
2.443
296
3.317
Accrued interests
Accrued interests
Total accrued interests
Total currency and interest rate instruments
Total currency instruments
Total interest rate instruments
Total accrued interests
Total
36.921
122.469
159.390
Counterparty risk associated with derivatives is reduced via ISDA agreements and CSA supplements. The CSA supplement regulates the counterparty risk through payments of
margins in relation to exposure limits. The contract sum and effect of reinvestment costs covered by offsetting agreements amounted to NOK 133,2 billion and NOK 4,0 billion as
of the fourth quarter of 2014.
The note is approximately identical for the Parent Bank and the Group
Note 11 Issuance of unsecured debt and additional capital instruments
Debt raised through issuance of securities
Bonds, nominal amount
Adjustments
Accrued interests
Total debt raised through issuance of securities
Balance as at
31.12.14
59.942
2.468
843
63.253
Change in debt raised through issuance of securities
Bonds, nominal amount
Adjustments
Accrued interests
Total debt raised through issuance of securities
Balance as at
31.12.14
59.942
2.468
843
63.253
Additional Tier 1 and Tier 2 capital instruments
Term subordinated loan capital, nominal amount
Perpetual subordinated loan capital, nominal amount
Tier 1 capital instruments, nominal amount
Adjustments
Accrued interests
Total additional Tier 1 and Tier 2 capital instruments
Change in additional Tier 1 and Tier 2 capital instruments
Term subordinated loan capital, nominal amount
Perpetual subordinated loan capital, nominal amount
Tier 1 capital instruments, nominal amount
Adjustments
Accrued interests
Total additional Tier 1 and Tier 2 capital instruments
Balance as at
31.12.13
49.387
2.261
680
52.328
Issued/ sale
own
2014
15.659
0
0
15.659
Past due/
redeemed
2014
-8.292
0
0
-8.292
FX rate- and
other changes
2014
3.188
207
163
3.558
31.12.14
2.069
0
794
89
12
2.964
Balance as at
31.12.14
2.069
0
794
89
12
2.964
31.12.13
49.387
2.261
680
52.328
31.12.13
2.100
0
1.823
60
21
4.004
Issued/ sale
own
2014
44
0
0
0
0
44
Past due/
redeemed
2014
-75
0
-1.040
0
0
-1.115
FX rate- and
other changes
2014
0
0
11
29
-9
31
31.12.13
2.100
0
1.823
60
21
4.004
The note is approximately identical for the Parent Bank and the Group
SpareBank 1 SR-Bank Group
Unaudited
21
Note 12 Segment reporting
Management has assessed which segments are reportable based on the form of distribution, products and customers. The primary reporting format is based on the risk and return
profile of the assets, and it is divided between the retail market (including self-employed people), the corporate market, the capital market and subsidiaries of considerable siginificance.
The Bank's own investment activities are not a separate reportable segment and they appear under the item "Other activities" together with activities that cannot be allocated to the retail
market, corporate market, capital market or subisidiaries of considerable significance. Staff/support parent bank concists of administration, management, investment services, strategy
and ownership, treasury and finance function. Commision income from SpareBank 1 Boligkreditt and SpareBank 1 Næringskreditt are included under "Net commission and other
income".
Income statement (MNOK)
SpareBank 1 SR-Bank Group 01.01.14 - 31.12.14
Retail
Corporate
Capital
Market
Market
Market
Staff/support
parent bank
Eiendoms-
SR-
Other
Megler 1
Finans
activities
Eliminations
Total
Interest income
2.086
1.651
1.184
997
23
394
2
-200
6.137
Interest expense
1.041
686
1.130
879
19
167
4
-193
3.733
Net interest income 1)
1.045
965
54
118
4
227
-2
-7
2.404
Commission income 1)
937
345
31
6
0
4
100
-53
1.370
Commission expenses
40
27
4
2
0
22
28
-45
78
Other operating income
0
0
0
6
434
0
1
-1
440
1.732
Net commission and other income
897
318
27
10
434
-18
73
-9
Dividend income
0
0
3
21
0
0
12
0
36
Income from investment in associates
0
0
0
473
0
0
0
33
506
Net gains/losses on financial instruments 1)
9
25
8
83
7
0
5
99
236
Net income on investment securities
9
25
11
577
7
0
17
132
778
Personnel expenses
376
175
53
296
249
32
27
-7
1.202
Administrative expenses
108
25
16
264
40
9
7
0
468
97
26
4
117
100
13
19
10
386
581
226
73
677
389
54
53
3
2.056
1.370
1.082
19
28
56
155
35
113
2.858
15
164
0
0
0
3
0
0
182
6
63
0
0
0
6
0
1.349
855
19
28
56
146
35
113
2.601
1.045
965
54
118
-19
-167
-4
412
2.404
0
0
0
0
23
394
2
-419
0
1.045
965
54
118
4
227
-2
-7
2.404
Other operating expenses
Total operating expenses
Operating profit before losses
Change in individual write-downs in the period
Change in group write-downs in the period
Pre-tax profit
75
Net interest income 1)
External net interest income
Internal net interest income
Net interest income
0
Balance sheet (MNOK)
Loans to customers
0
79.727
52.019
671
2.359
0
6.853
0
-9
141.620
Individual loss provisions
-60
-242
0
0
0
-20
0
0
-322
Group loss provisions
-40
-276
0
0
0
-62
0
0
-378
Other assets
163
1.464
9.188
28.321
209
251
573
-6.163
34.006
79.790
52.965
9.859
30.680
209
7.022
573
-6.172
174.926
Total assets
0
Deposits from customers
44.681
32.837
1.700
2.505
0
0
0
-234
81.489
Other debt and equity 2)
35.109
20.128
8.159
28.175
209
7.022
573
-5.938
93.437
Total debt and equity
79.790
52.965
9.859
30.680
209
7.022
573
-6.172
174.926
Loans sold to SpareBank 1 Boligkreditt
and SpareBank 1 Næringskreditt
32.288
584
SpareBank 1 SR-Bank Group
32.872
Unaudited
22
SpareBank 1 SR-Bank Group 01.01.13 - 31.12.13
Income statement (MNOK)
Retail
Corporate
Capital
Market
Market
Market
Staff/support
parent bank
Eiendoms-
SR-
Other
Megler 1
Finans
activities
Eliminations
Total
Interest income
1.920
1.507
923
1.094
15
387
1
-203
5.644
Interest expense
1.016
597
870
1.053
10
171
0
-192
3.525
904
910
53
41
5
216
1
-11
2.119
1.059
308
39
2
0
4
82
-42
1.452
Commission expenses
36
28
4
5
0
19
22
-42
72
Other operating income
0
0
0
12
433
0
0
-1
444
1.824
Net interest income 1)
Commission income 1)
Net commission and other income
1.023
280
35
9
433
-15
60
-1
Dividend income
0
0
3
30
0
0
0
0
33
Income from investment in associates
0
0
0
412
0
0
0
-57
355
Net gains/losses on financial instruments 1)
13
10
83
143
0
0
12
-94
167
Net income on investment securities
13
10
86
585
0
0
12
-151
555
414
115
189
27
53
12
249
227
242
39
32
8
26
3
-9
1
1.196
432
Personnel expenses
Administrative expenses
Other operating expenses
Total operating expenses
Operating profit before losses
Change in individual write-downs in the period
Change in group write-downs in the period
Pre-tax profit
85
25
5
136
115
11
9
5
391
614
241
70
612
396
51
38
-3
2.019
1.326
959
104
23
42
150
35
-160
2.479
17
130
10
0
0
-9
0
15
162
13
-53
0
0
0
10
0
0
-30
1.296
882
95
23
42
149
35
-175
2.347
904
910
53
41
-10
-171
0
392
2.119
0
0
0
0
15
387
1
-403
0
904
910
53
41
5
216
1
-11
2.119
Net interest income 1)
External net interest income
Internal net interest income
Net interest income
Balance sheet (MNOK)
Loans to customers
62.182
49.335
0
2.448
0
6.319
0
-11
120.273
Individual loss provisions
-64
-342
0
0
0
-40
0
0
-446
Group loss provisions
-34
-213
0
0
0
-55
0
0
-302
0
0
545
41.734
186
160
387
-5.552
37.460
62.084
48.780
545
44.182
186
6.384
387
-5.563
156.985
Other assets
Total assets
0
Deposits from customers
41.045
27.002
0
3.793
0
0
0
-173
71.667
Other debt and equity 2)
21.039
21.778
545
40.389
186
6.384
387
-5.390
85.318
Total debt and equity
62.084
48.780
545
44.182
186
6.384
387
-5.563
156.985
Loans sold to SpareBank 1 Boligkreditt
and SpareBank 1 Næringskreditt
45.747
642
1)
46.389
The capital market division serves customers throughout the group. Previously, most of the income this division generates was recognised in the division. From the 1 January
2014, the internal income recognition policy was changed and income is now recognised, in its entirety, in the business area to which the customer belongs. Historical accounting
figures have not been changed as the effect on the accounts are considered to have an insignificant effect.
2)
Other liabilities contain allocated arrangements between the segments.
Interest on intercompany receivables for the retail market division and the corporate market division is determined based on expected observable market interest rates (NIBOR)
plus expected additional costs in connection with the group's long term financing (credit premium). Deviations between the group's actual financing costs and the applied interest
on intercompany receivables are eliminated at the group level.
SpareBank 1 SR-Bank Group
Unaudited
23
Note 13 Reclassification of financial instruments
Due to the extraordinary and negative development in the world's financial markets during 3rd quarter 2008 the IASB 13th October 2008 approved certain changes to IAS 39 and
IFRS 7. The changes permit a reclassification of part of or the whole portfolio of financial assets held for trading retrospectively to 1st July 2008. SpareBank 1 SR-Bank has decided
to adopt this opportunity and has, after due consideration, chosen to reclassify certain parts of the bond portfolio into categories recognised at amortised cost, i.e. "held to maturity" or
"loans and receivables". No reclassifications have been adopted by any of the subsidiaries.
Listed instruments were classified as "held to maturity" while instruments with no observable market value and where the price has been recognised through alternative valuation
methods according to IAS 39 were reclassified as "loans and receivables".
Reclassification was carried through due to the major and abnormal impairments that have arisen during the turbulent financial markets. A major part of the bank's bond portfolio has
normally been kept in custody in Norges Bank and held to maturity. These bonds are normally of superior quality and exceptional changes in price is, according to the bank's
opinion, disturbing the result unnecessarily. There is ability as well as will to keep the reclassified portolio until maturity.
The survey below states the effect a non-reclassification would have in the accounts.
Group
As at 1.7.2008
Book value
Amortising as
interest
Reclassification effect
Fair value
At fair value through profit and loss
Held to maturity 1)
3.041
2.350
0
0
0
0
3.041
2.350
Receivables 1)
Total certificates and bonds
578
5.969
0
0
0
0
578
5.969
As at 31.12.2014
Group
Certificates and bonds recognised as:
At fair value through profit and loss
Book value
15.158
Amortising as
interest this
year
0
Reclassification effect
0
Fair value
15.158
0
0
103
15.261
0
0
0
0
0
0
0
0
0
0
103
15.261
Certificates and bonds recognised as:
Held to maturity
Covered Bonds
Accrued interests
Total certificates and bonds
Group
31.12.13
41
42
41
Bonds reclassified as receivable and hold to maturity
Book value
Nominal value
Observable market value
31.12.14
0
0
0
1) Net urealised losses written back as at 1st July 2008 amounts to NOK 47.3 million. The amounts were amortised during the instruments economic life. Weighted remaining
economic life at the time of reclassification was approximately 2.7 years.
SpareBank 1 SR-Bank Group
Unaudited
24
Note 14 Pensions
The SpareBank 1 SR-Bank group has two types of pension scheme: defined benefit-based and contribution benefit-based pension schemes. For more information about
the accounting treatment of the schemes see note 1 above and note 24 to the annual financial statements for 2013.
On 31 December 2013, SpareBank 1 SR-Bank switched to using the new K2013 mortality table, issued by the Financial Supervisory Authority of Norway on 8 March
2013, as its basis for calculations, adjusted for opening mortality and the decline in the mortality rate. The total gross effect for the 2013 financial year of the transition to a
new mortality table amounted to NOK 125 million for the group, and this was treated in the accounts as a remeasurement and recognised in the comprehensive income
statement.
The following economic assumptions have been used to calculate the obligations for the defined benefit-based pension scheme:
Q4 2013
4,00 %
Q3 2014
3,00 %
Q4 2014
2,30 %
Parent bank and group
Discount rate
Q1 2014
3,70 %
Q2 2014
3,25 %
4,00 %
3,70 %
3,25 %
3,00 %
2,30 %
Expected return on assets
3,75 %
3,75 %
3,75 %
3,25 %
2,75 %
Forecast salary increase
3,50 %
3,50 %
3,50 %
3,00 %
2,50 %
National Insurance scheme's basic amount
2,00 %
2,00 %
2,00 %
2,00 %
2,00 %
Pension adjustment
Change in pension obligations (NOK million):
Parent
bank
01.01.13 - 01.01.14 Q4 2014 31.12.13 31.12.14
2014
Q4 2013
162
191
480
162
223
67
62
-56
-12
24
14
0
-6
149
22
-23
-3
67
62
-56
-12
415
83
-79
-12
0
0
0
0
-5
223
223
625
223
625
Group
01.01.14 - 01.01.13 31.12.14 31.12.13
Q4 2014
Q4
2013
2014
Net obligations opening balance
Actuarial liabilities and losses recognised in
comprehensive income
Net pension cost
Company contributions
Payments from operations
Curtailments and settlements included in the
income statement
242
176
512
208
176
444
88
-82
-13
72
67
-60
-13
165
23
-23
-3
25
16
0
-7
72
67
-60
-13
-5
0
0
0
0
Net pension obligations closing balance
674
242
674
242
242
Note 15 SpareBank 1 Boligkreditt AS and SpareBank 1 Næringskreditt AS
In the 3rd quarter of 2010, in association with the other owners of Sparebank 1 Boligkreditt, Sparebank 1 SR-Bank entered into an agreement to establish a liquidity
facility for SpareBank 1 Boligkreditt. his implies that the banks undertake to buy mortgage bonds limited to a total value equal to 12 months' maturities in SpareBank 1
Boligkreditt. Each owner is primarily liable for its share of the need, secondarily for twice the amount of the primary liability under the same agreement. The bonds
can be deposited with Norges Bank and represent, therefore, no significant increase in the bank's inherent risk.
The bank has concluded agreements concerning the sale of loans with good security and collateral in real estate to SpareBank 1 Boligkreditt and SpareBank 1
Næringskreditt. For more information about the accounting treatment of the agreements see note 2 and note 9 in the 2013 annual financial statements.
Note 16 Liquidity risk
Liquidity risk is the risk that the bank is unable to refinance its debts or is unable to fund an increase in assets. The bank’s framework for liquidity risk management
shall reflect its conservative risk profile. The Board has adopted internal frameworks to ensure that the bank has the best maturity structure possible for its funding. A
stress test is conducted for different maturities for bank-specific crises, system crises and the combination of these, and we have also created an emergency
preparedness plan for the management of liquidity crises. The average term to maturity for the portfolio of senior bond funding was 3.6 years at the end of Q4 2014.
SpareBank 1 SR-Bank Group
Unaudited
25
Note 17 Information about fair value
Group
The table below shows financial instruments at fair value according to their valuation method. The different levels are defined as follows:
Level 1: Listed price in an active market for an identical asset or liability.
Level 2: Valuation based on observable factors other than listed price (used in level 1) either direct (price) or indirect (deduced from prices)
for the asset or liability.
Level 3: Valuation based on factors not obtained from observable markets (non-observable assumptions).
Level 1
Fair value 31.12.14
Assets
Level 2
Net lending to customers
14.203
Commercial paper and bonds at fair value
1.058
Level 3
Total
9.994
7.340
Financial derivatives
217
Equities, units and other equity interests
267
139
22
Operations that will be sold
9.994
15.261
7.340
623
22
Liabilities
3.317
Financial derivatives
3.317
No transfers between levels 1 and 2
Level 1
Fair value 31.12.13
Assets
Level 2
Net lending to customers
Level 3
Total
11.421
Commercial paper and bonds at fair value
11.430
Financial derivatives
4.923
4.923
Equities, units and other equity interests
173
285
Operations that will be sold
11.421
14.228
2.798
473
85
931
85
Liabilities
Financial derivatives
2.013
2.013
No transfers between levels 1 and 2
Change in holding during the financial year of assets valued on the basis of factors other than observab
Shares, ownership stakes and
Loans to customers
other securities
Group
Balance 01.01
Business
available
for sale
11.421
473
Additions
442
0
85
0
Disposals
-2.101
-352
-47
Transferred from or to measurement according to prices in an activ
market or observable market data
Change in value 1)
0
0
0
232
18
-16
Balance 31.12
9.994
139
22
Nominal value/cost price
9.475
80
29
Fair value adjustment
Balance 31.12
519
9.994
59
139
-7
22
SpareBank 1 SR-Bank Group
Unaudited
26
The stakes in Nets Holding, Nordito Property and Bank 1 Oslo Akershus are valued every quarter by SpareBank 1 Gruppen and distributed to all of the alliance banks. A
contract for the sale of the stakes in Nets Holding was signed in the first quarter of 2014. The value according to the sales contract was used in the interim financial
statements and resultet in income of NOK 202 million in the first quarter of 2014. The agreement to sell the stake in Nets Holding was approved and the sales sum was
received in July. Valuations of the stakes in Nordito Property and Bank 1 Oslo Akershus are based on an average of five different methods in which the last known
transaction price, earnings per share, dividends per share and EBITDA are input for the valuations.
Valuations of fixed rate loans are based on the interest rate agreed with the customer discounted by the market interest rate and an assessment of the change in credit
risk at the end of the year.
1)
Value changes are recognised in net income from financial instruments
Note 18 Events after the balance sheet date
In January 2015, the group agreed to acquire Swedbank's branch in Stavanger. In January 2015, the Rogaland branch of SpareBank 1 Regnskapshuset Østlandet AS,
which includes three offices in Stavanger, Sandnes and Ålgård respectively, was acquired. Both acquisitions were effective from the first quarter of 2015.
Otherwise, no material events have been registered after 31 December 2014.
SpareBank 1 SR-Bank Group
Unaudited
27
QUARTERLY INCOME STATEMENT
SpareBank 1 SR-Bank Group, MNOK
Q4
Q3
Q2
Q1
Q4
Q3
Q2
Q1
Q4
2014
2014
2014
2014
2013
2013
2013
2013
2012
1.588
1.568
1.543
1.438
1.466
1.451
1.406
1.321
1.331
Interest expense
933
947
962
891
892
883
880
870
851
Net interest income
655
621
581
547
574
568
526
451
480
Commission income
322
317
333
398
392
386
349
325
330
Commission expenses
19
20
19
20
12
23
18
19
17
Other operating income
102
106
130
102
109
103
134
98
98
Net commission and other income
405
403
444
480
489
466
465
404
411
Interest income
Dividend income
Income from investment in associates
1
10
7
18
-2
3
32
0
0
138
150
137
81
95
130
31
99
22
75
Net gains/losses on financial instrument
-23
-18
57
220
102
4
-1
62
Net income on financial investments
116
142
201
319
195
137
62
161
97
1.176
1.166
1.226
1.346
1.258
1.171
1.053
1.016
988
Personnel expenses
308
307
293
294
323
284
297
292
292
Administrative expenses
128
114
120
106
109
104
118
101
107
94
99
88
105
102
90
102
97
105
Total operating cost
530
520
501
505
534
478
517
490
504
Operating profit before impairment losses
646
646
725
841
724
693
536
526
484
93
69
41
54
50
32
25
25
26
Total income
Other operating costs
Impairment losses on loans and guarantees
Pre-tax profit
553
577
684
787
674
661
511
501
458
Tax expense
105
123
150
128
107
145
128
107
114
Profit after tax
448
454
534
659
567
516
383
394
344
Return on equity per quarter 1)
11,7 %
12,2 %
14,5 %
18,4 %
16,2 %
15,6 %
11,8 %
12,3 %
11,2 %
Cost percentage 2)
45,1 %
44,6 %
40,9 %
37,5 %
42,4 %
40,8 %
49,1 %
48,2 %
51,0 %
Combined weighted total average spread for lending and deposits 3)
1,51 %
1,48 %
1,41 %
1,40 %
1,46 %
1,49 %
1,43 %
1,27 %
1,36 %
Profitability
Balance sheet figures from quarterly accounts
Gross loans to customers
141.620 137.343 135.335 121.723 120.273 116.720 115.214 112.314 109.513
Gross loans to customers including SB1 Boligkreditt og Næringskreditt
174.492 170.270 168.624 166.593 166.662 164.538 162.714 160.445 158.201
Growth in loans over last 12 months 4)
17,7 %
17,7 %
17,5 %
4,7 %
3,5 %
3,6 %
3,8 %
Deposits from customers
81.489
81.228
81.728
Deposit-to-loan ratio
57,5 %
59,1 %
Growth in deposits over last 12 months
13,7 %
14,9 %
Growth in loans incl SB1 Boligkreditt and Næringskreditt
8,4 % -16,8 % -11,2 %
-1,9 %
-8,7 %
5,3 %
5,5 %
6,1 %
7,4 %
8,0 %
7,8 %
74.440
71.667
70.714
73.281
68.605
67.594
60,4 %
61,2 %
59,6 %
60,6 %
63,6 %
61,1 %
61,7 %
11,5 %
8,5 %
6,0 %
2,2 %
2,8 %
2,2 %
5,5 %
Total assets
174.926 168.310 167.273 157.752 156.985 153.639 151.110 146.124 141.543
Average total assets
172.179 166.894 164.949 158.867 155.489 151.683 147.331 144.265 140.555
Losses and non-performing commitments
Impairment losses ratio, annualized 5)
0,27
0,20
0,13
0,18
0,17
0,11
0,09
0,09
0,10
Non-performing commitments as a percentage of total loans
0,30
0,38
0,40
0,52
0,69
0,40
0,37
0,44
0,42
Other doubtful commitments as a percentage of total loans
0,36
0,39
0,41
0,38
0,37
0,69
0,50
0,57
0,54
Solidity
Common equity Tier 1 capital ratio
11,5
11,3
11,4
11,2
11,1
10,5
10,3
10,1
10,0
Tier 1 capital ratio
12,3
13,1
13,2
13,0
12,8
12,2
12,0
12,2
12,1
Capital ratio
Tier 1 capital
Net primary capital
Risk weighted balance
14,5
15,4
14,6
14,5
14,1
13,1
12,9
12,9
13,1
14.828
15.304
14.978
14.691
14.511
13.974
13.691
13.673
13.507
17.465
18.037
16.584
16.407
15.915
15.034
14.721
14.452
14.568
120.189 117.278 113.725 113.413 113.075 115.038 114.188 111.950 111.213
Se next page for definition of key figures
SpareBank 1 SR-Bank Group
Unaudited
28
SpareBank 1 SR-Bank share
Market price at end of quarter
Q4
Q3
Q2
Q1
Q4
Q3
Q2
Q1
Q4
2014
2014
2014
2014
2013
2013
2013
2013
2012
37,20
52,50
61,00
59,75
60,75
60,25
47,70
47,50
50,00
Market capitalisation
13.427
15.601
15.281
15.537
15.409
12.199
12.148
12.788
9.514
Number of shares issued, millions
255,75
255,75
255,75
255,75
255,75
255,75
255,75
255,75
255,75
60,28
59,21
57,63
57,45
55,00
52,87
50,89
50,92
49,48
Earnings per share, NOK (annualised)
1,75
1,78
2,09
2,58
2,22
2,02
1,50
1,54
1,35
Price/earnings per share
7,50
8,57
7,15
5,89
6,78
5,90
7,92
8,12
6,89
Price / Book equity (group)
0,87
1,03
1,04
1,06
1,10
0,90
0,93
0,98
0,75
7,7 %
3,0 %
5,5 %
7,6 %
6,3 %
3,1 %
5,0 %
7,6 %
4,2 %
-13,9 %
2,1 %
1,0 %
0,8 %
26,3 %
0,4 %
-2,0 %
34,4 %
0,8 %
Book equity per share(including dividends)
Annualised turnover rate in quarter 6)
Effective return 7)
Key figure definitions
1)
Operating result as a percentage of average equity
2)
Total operating costs as a percentage of total operating income
3)
Net interest income as a percentage of average total assets
4)
High growth in loans is attributable to a buy-back of loans from SpareBank 1 Boligkreditt AS
5)
Impairment losses on loans as a percentage of average gross loans, annualised
6)
Annualised turnover of the share during the period, measured as a percentage of the number of outstanding shares
7)
Percentage change in the market price in the last period, including paid share dividend
SpareBank 1 SR-Bank Group
Unaudited
29
Contact Information
Address
Bjergsted Terasse 1
Postboks 250
N-4066 Stavanger
Tel. (+47) 915 02 002
www.sr-bank.no
Executive Management
Arne Austreid, CEO
Tel. (+47) 900 77 334
Email: [email protected]
Inge Reinertsen, CFO
Tel. (+47) 909 95 033
Email: [email protected]
Investor Relations
Stian Helgøy, Vice President Investor Relations
Tel. (+47) 906 52 173
Email: [email protected]
2015 Financial Calendar
Preliminary annual results for 2014
Annual General Meeting
Ex-dividend
Q1 2015
Q2 2015
Q3 2015
SpareBank 1 SR-Bank Group
Wednesday 4 February
Tuesday 28 April
Wednesday 29 April
Wednesday 29 April
Wednesday 12 August
Thursday 29 October
Unaudited
30


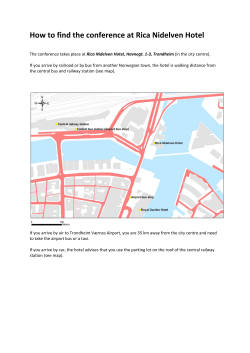


© Copyright 2026