
2014 ANCHORAGE, ALASKA {Cost of Living Index}
2014 ANCHORAGE, ALASKA {Cost of Living Index}
Anchorage Economic Development Corporation collects cost of living data for Anchorage that measures the
relative price of consumer goods and services. The Cost of Living Index (COLI) is measured nationally in 281
areas around the country; the average for all areas equals 100.
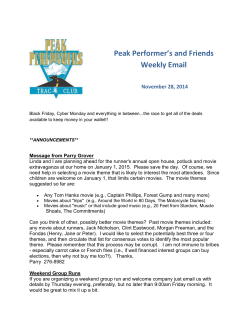
Anchorage’s overall index in 2014 was 128.5, or 128.5 percent of the national average. Another way
of looking at it would be to say that the cost of living in Anchorage is 28.5 percent higher than the
average American city.
Each participant area’s index is a percentage of the weighted average for all prices. This index does not measure the change of
prices over time (inflation), but rather the relative cost of living compared to the national average.
ANCHORAGE COST OF LIVING {128.5
19th}
Anchorage is the 19th most expensive city of the 281 cities that participated in the 2014 COLI survey.
After two years of decreases, the composite index for Anchorage went up in 2014 to 128.5, 2.3 points higher than 2013.
Of the six component indices, four have increased over the last year.
Since 2009, this index has moved between 124.6 and 130.6.
HOUSING {157.8
HEALTH CARE {139.9}
21st}
The relative cost of housing in Anchorage has risen every year since 2009.
At 157.8, the cost of housing in Anchorage ranks 21st highest in
the nation.
The cost of health care in Anchorage is the
fourth highest in the nation behind
Fairbanks, Juneau and Kodiak.
According to the Alaska Multiple Listing Service, the average sales price of a
home in Anchorage was $358,456 in 2014,
a 3.23 percent increase over 2013.
A full vision eye exam in Anchorage
is 69.6 percent higher than the national
average, a physician’s office visit is 62.5
percent higher and a teeth cleaning is
47.6 percent higher.
The Alaska Housing Finance Corporation 2014 Rental Market Survey showed
average rents in Anchorage increased $21, or 1.7 percent from 2013.
GROCERY {123.4
10th}
This index increased significantly from last year’s eight year low, but is still the second lowest reading over this period.
This is a highly volatile index, ranging from 113 to 142.5 since 2007. Some components with the highest relative costs are
bananas (147.5), canned peaches (137.0) and grated parmesan cheese (136.0).
None of the twenty-six items priced were below the national average.
MISCELLANEOUS GOODS & SERVICES
TRANSPORTATION
{122.4 7 }
{105.1 62nd}
This index stayed mostly flat from 2013 to 2014, rising only 0.1 to 122.4.
The transportation index has dropped
for the fourth consecutive year and is
now at 105.1.
th
Anchorage has the 7th highest goods & services index of the 281
communities surveyed.
The highest component index in this category is the price of
a bottle of white wine at 159.6.
The lowest is the cost of a yearly newspaper subscription at 95.9.
UTILITIES {97
Nearly 75 percent of this index is set by
the cost of unleaded gasoline, which is
9.5 percent higher in Anchorage than the
national average.
138th}
This index is the only component below 100 at 97. This is two points lower than 2013 and the second year in
a row it has decreased. Electrical costs in Anchorage are 89 percent of the national average,
and telephone service is 93.8 percent of the average.
Source: 2014, Council for Community and Economic Research (C2ER)
170
Anchorage Annual COLI Values, 2009-2014
Anchorage
Annual COLI
Values,
2009-2014
ANCHORAGE
ANNUAL
COLI
VALUES,
2009-2014
157.8
157.8
170
160
160
150
2014 ANCHORAGE, ALASKA
{Cost of Living Index}
150
140
140
130
130
120
128.5
128.5
139.9
139.9
123.4
123.4
120
110
105.1
105.1
97
97
110
100
100
90
122.4
122.4
90
80
80
Composite
Index
Composite
Index
Grocery Items
Housing
Grocery Items
Housing
2009
2009
2010
2010
Utilities
Utilities
2011
2011
2012
2012
Transportation
Transportation
2013
2013
2014
Health Care
Health Care
Misc. Goods &
Misc.Services
Goods &
Services
2014
2014 ANCHORAGE COST OF LIVING INDEX
POINT
POINT
CHG
CHG
WEIGHT20072008 20092010201120122013 20142007-14 2013-14
COMPONENT
OVERALL INDEX 100% 126 125.5124.6128.3130.6129.6126.2 128.5 2.5
2.3
GROCERY ITEMS 13.48% 129.8142.5129.3134.4137.4129.1113 123.4 -6.4
10.4
HOUSING 26.05% 137.9136.4137 142.5149.8152.8155.1 157.8 19.9
2.7
UTILITIES 9.95% 106.197.7 101.994.3 98.2 100.499 97
-9.1
-2
TRANSPORTATION 12.63% 103.5106.9118.2122 112 108 107.3105.1 1.6
-2.2
HEALTH CARE
4.85% 132.5130.1127.6135.4139.4136.6139.2139.9 7.4
0.7
MISC. 33.01% 126.6123.7120.5124.7126.3126.9122.3122.4 -4.2
0.1
CITY COMPARISONS & ANCHORAGE RANKING
COMPOSITE GROCERY HOUSING UTILITIES TRANSP. HEALTH CARE
MISC.
ANCHORAGE, AK128.5 123.4
157.897 105.1139.9122.4
COLI RANKING*
19th10th21st138th62nd4th7th
FRESNO, CA
106.1 105.2
102.4127.5
109.4102.3102
DENVER, CO
107.5 98.5124.497.7
101.5103.8102.5
HONOLULU, HI 174.9 154.7
267.4214.3
125.9112.1116.9
BOISE, ID
94.7
93.6
86.5
88.6
106.1
103.9
98.8
CHICAGO, IL
116.7 103.5
136.2101.8
125.7100.5108.9
FT. WAYNE, IN
89 92.1
76.493.7
99.492.392.7
BOSTON, MA
137.7
113.9
175
135.6
107.1
120.6
130.1
MINNEAPOLIS, MN107.9 104.1
115.492.6
103.7100.8110.4
BOZEMAN, MT
100.8 102113.28892.5 105.996.1
RENO, NV
97.2 106.1
86.381.5
107.4
94.7104.5
FARGO, ND
94
101.7
83.5
92.1
96.6
111.3
97.2
PORTLAND, OR 125.1 114.4
160.990.8
111.7114.3116.2
PHILADELPHIA, PA
119.5
114.3
135.4
121.8
106.6
98.7
114.8
SEATTLE, WA
126.9 111.7
165.698.3
118.1116.6113.5
MILWAUKEE, WI 102.1101.8
104112.7
98.811696.4
LARAMIE, WY
93.6 98.1
95.19990.698.788.9
*MOST EXPENSIVE = 1ST, LEAST EXPENSIVE = 281ST


© Copyright 2026