
Annual Report 2014
Annual Report 2014
Contents
The year in brief
The year in brief
2
Agrokultura in brief
4
Managing Director’s comments
5
Operational review
7
Crop Production
7
Livestock11
Land12
Organisation13
Corporate Governance
13
Operational Organisation
13
Corporate Social Responsibility
14
Share development
15
Board of Directors’ report
16
Group statements
22
Notes to the Group statements
26
Parent statements
59
Notes to the Parent statements
62
Statement of assurance
66
Auditor’s report
67
Board of Directors
69
Glossary and definitions
70
Addresses71
Financial highlights
■■ Revenue for the period fell by 13 per cent to
SEK 539 million (SEK 617 million) driven by a continued slump in commodity prices and higher
carry over stock
This annual report is a translation of the Swedish version.
In case of discrepancies, the Swedish version shall apply.
Printed in Sweden. Landsten Reklam 2015.
Design Henrik Strömberg.
■■
The profit before depreciation (EBITDA) was
SEK 122 million (loss SEK 129 million) and net
profit was SEK 22 million (net loss SEK 262 million).
■■
On 31 December 2014, Group debt totalled
SEK 96 million (SEK 167 million). Group cash at
the same date was SEK 31 million (SEK 29 million), and unsold inventory amounted to SEK 131
million (SEK 93 million).
■■
All business segments (Ukraine cropping, Russia cropping and Livestock) delivered positive
operating profits coupled with positive cash
generation
■■
Currency weakness in Ukraine and Russia generally positive for operations despite increased
financing rates
■■
48.4m of promissory notes settled through the
issue of 7.3 million new shares at SEK 5.0 per
share and payment of SEK 12.1 million in cash
■■
Profit per share was SEK 0.15 (loss SEK 1.88)
■■
The board proposes that no dividend is paid for
the financial year 2014
Operational highlights
■■ Total harvested hectares totalling 115,400 ha
with total production of 446,200 tonnes of oilseeds and grains
■■
Ukrainian weighted average yields up 20 per
cent driven by the improvement in grain yields
■■
Russian weighted average yields up 1 per cent
on 2013 consolidating 2 years of significant
growth
■■
Implementation of a material cost saving programme focussed on all areas has enabled
Group to turn around profitability despite continued difficult pricing environment
■■
No major negative impact on operations relating
to political events in Ukraine
CHANGES IN OWNERSHIP
The ownership of the Company changed significantly during the year through a purchase of 96% of the
issued share capital in the Company by two controlling shareholders. Since the end of the reporting period the controlling shareholders have joined their
shareholding and the Group’s shares which were
listed on Nasdaq OMX First North have been delisted. The controlling shareholders have expressing
the intention to initiate a squeeze out at a price per
share of SEK 4.5.
UPCOMING REPORTING DATES 2015
■■ Annual General Meeting – 26 May 2015
Agrokultura in brief
BUSINESS CONCEPT AND OPERATIONAL
STRATEGY
The Group’s business concept is to generate an attractive return on invested capital by optimally utilising the Group’s land bank through crop production
and livestock. The Group’s operational strategy is to
operate an efficient modern agricultural business
according to international best practice. In order to
deliver this strategy the Group will make strategic
changes to its land bank in order to deliver the optimum geographical focus and control of operations.
Geographical Organisation
Agrokultura’s crop production is concentrated on
two operational clusters, one in the Central Black
Soil Region in Russia headquartered in Voronezh
and one in Western Ukraine headquartered in Lviv.
Each of these main clusters is subdivided into several production entities. A small Group administrative
office is located in London.
The Group also operates three large dairy farms
in Russia located in Lipetsk and Voronezh oblasts.
There exists also a small meat production facility in
Kursk oblast.
Agrokultura’s areas of operation
LATVIA
MOSCOW
LITHUANIA
RUSSIA
Kaliningrad
BELARUS
Lipetsk
Kursk
POLAND
Lviv
SLOVAKIA
Tambov
Voronezh
KIEV
Ternopil
Ivano-Frankivsk
HUNGARY
UKRAINE
MOLDOVA
ROMANIA
Odessa
Novorossiysk
AGROKULTURA 4 ANNUAL REPORT 2014
Managing Director’s comments
Dear Shareholders,
The financial performance of the Group in 2014 is much improved and begins
to show how the business will develop over the next five year period. Prices
remain well below their 5 year trailing average and the Group is well positioned
to take advantage of any improvements in the pricing environment. Although
there were some improvements on the yield side of the business the majority of
improvement came from the thorough restructuring of the Group’s costs. This in
depth programme commenced in August 2013 with SEK 150 million of savings
being identified. The total positive swing in profitability totalled SEK 283 million.
The most significant areas of improvement came in direct costs through the
complete review of technical crop plans together with some dramatic cuts in
headcount cost and administrative costs. Cost of sales were 21 per cent lower
than in 2013, headcount costs reduced by 28 per cent and administrative costs
by 41 per cent. Despite these cuts, weighted average yields improved by 1 per
cent in Russian and 20 percent in Ukraine which placed Agrokultura very much
in the top quartile of scale farmers in both countries.
In 2014 the Group is reporting it’s first ever operating profit in Ukraine.
The Group’s Ukraine business encountered favourable weather conditions
which have assisted in demonstrating the operation’s yield potential. Western
Ukraine’s advantage lies in the reliable precipitation levels which are central to
delivering strong yields year on year. Although there remain some initiatives to
further improve yields when weather conditions will allow, we expect a majority
of improvements in Ukraine to come from more efficient purchasing of inputs
without expensive trade credit, better timed purchases together with benefits
related to the material weakening of the hryvnia. In the medium term, the Group
will recommence machinery replacement capex in Ukraine which will have the
impact of reducing maintenance cost, diesel costs and improving machinery
downtime metrics.
AGROKULTURA 5 ANNUAL REPORT 2014
Managing Director’s comments
The Group’s Russian cropping business has delivered another year of real progress and development resulting in positive operating profits and cash
generation despite the continued weakness in commodity prices. Although weighted average yields
increased by just 1 per cent, this followed increases
of 34 per cent in 2013 and material increases in 2012.
Weather conditions were far from ideal with very dry
conditions for most of the growing season for the
spring crops. This hit yields for crops such as corn
and soya and limited the yield potential for other
crops such as sunflower and sugar beet. Operations
are well organised and we benefit from the advantage of a strong and stable operating management
team. Modest machinery investments have been
made which are expected to de-risk the Russian operation further.
Administrative expenses have been another
key area of action. Being generally non-yield driving, the goal has been to reduce such expenses
to a minimum without damaging operations. Total
administrative expenses fell 41 per cent to SEK 63
million (SEK 550 per cultivated ha). This has led to
changes to how the management team works and
has required significant change and discomfort within the organisation. There remains the opportunity
to make further cuts (together with benefits from
weakening currencies), and the Group will continue
to seek ways to reduce administrative costs.
Both the Russian and Ukrainian economies have
their difficulties which is mostly evident in the weakness of their currencies with the associated increase
in local currency financing rates. A large proportion
of the Group’s revenues in Russia and Ukraine are directly linked to hard currencies such as USD and Euros whereas a significant costs are in local currencies
and therefore the devaluations are expected to have
a generally positive impact. This positive impact is
more defined in Ukraine than in Russia largely due to
the often looser correlations with international sales
prices.
During 2014, the Group saw the emergence of
new shareholders who ultimately made an offer for
the Group. Following the offer at SEK 4.5, which
delivered the new shareholders over 90 per cent
of the shares of the Group, a new Board was proposed and elected. Given the limited free float, it
was subsequently proposed to delist Agrokultura
in order to better reflect the shareholder structure.
On 27 February 2015, the Group was delisted. The
Shareholders will initiate a compulsory acquisition
process to buy out the remaining shareholders. Operationally there are very limited changes following
the new ownership with the shareholders assisting
the management team to continue the positive improvements made in the past 18 months. Agrokultura is to remain an independent business focused on
maximising its profitability and creating value for
shareholders.
The management team which came together
in the fourth quarter 2013 is committed to further
improving performance through further cost savings
and operational improvement. At the same time we
await improved commodity pricing and will benefit
from weakness in local currencies. Over the coming year the Group will focus on ensuring that costs
remain under control whilst exerting strict business
controls and procedures, and building upon the operating successes. We will continue to investigate
ways delivering an improved land bank most likely
through land swaps. We have in place a small, focused management team with significant experience in the sector who are well placed to work towards the delivery of these goals.
In Russia we are looking to make step by step
changes to the crop rotation to reflect the strong
margins delivered by sugar beet production. A long
term sugar beet sales contract will be signed on favourable terms with related party Prodimex which
is a clear demonstration of the potential benefits of
the new shareholder structure.
Stephen Pickup
Group Managing Director
AGROKULTURA 6 ANNUAL REPORT 2014
Operational review
Crop Production
The Group crops a mix of winter and spring crops
in order to balance weather risk with working capital and machinery constraints. Rapeseed, sunflower,
corn and sugar beet are the most profitable crops
and the Group seeks or will seek to maximise cropping of these crops within established agronomic
rotations. Generally there is balanced mix of winter
and spring crops. The Group’s Russian business, following recent success, is continuing to implement
no-till technology in its CBS (Central Black Soil)
farms. New, larger seeding machinery that was purchased in 2013 was complemented in 2014 by more
high capacity self-propelled sprayers and a tractor
replacement programme was initiated for the 2015
season. No till farming reduces diesel, labour and
machinery maintenance costs whilst also preserv-
AGROKULTURA 7 ing ground moisture. In 2014 approximately 13,000
ha were cultivated “no-til” and this is expected to
remain largely flat in 2015. Ukraine is less suited to
no-till production given the smaller field sizes and
the more plentiful rainfall. With Ukraine now better
organised and controlled, machinery replacement
investments and other positive investment decisions
can now be made with confidence.
Harvest 2014
Weather conditions were reasonable throughout the
year in the Company’s areas of operations. Given the
lack of material global weather events, global supply
for agricultural commodities was again high in 2014
which depressed pricing. The harvest of the winter
planted crops in Russia saw dry weather which led to
little or no drying being required. Ukraine saw nor-
ANNUAL REPORT 2014
Operational review
mal harvesting conditions with rainfall occasionally
holding up operations.
In Russia, the weighted average improvement in
yields was just 1 per cent compared to 2014 although
these results successfully consolidated the improvements of 34 per cent in 2013. Overall weighted average improvements would have been greater were it
not for the extremely dry weather in the second half
of the year which restricted yield of spring planted
crops such as corn, sunflower and soya. Winter wheat
was successful delivering a yield of 4.1 tonnes per ha
despite the poor seeding conditions in the autumn
2013 and a drier than usual growing season.
In Ukraine, weighted average yields were up 20
per cent compared to 2013 which in itself was a material improvement over 2012. Rapeseed continued
to show strong performance and now has a good
track record of strong, profitable yields. Corn yields
recovered to 7.1 tonnes per ha following operational
issues in 2013. All crops other than sunflower showed
an increase in yield and met management targets
given the cost structure.
Ukraine
Crop
Winter Rapeseed
Winter Wheat
Winter Barley
Corn
Sunflower
Total
Harvested Ha
12,214
8,199
4,089
7,926
12,044
44,472
Gross Yield
3.5
5.8
5.7
9.4
2.1
4.8
Estimated
Net Yield
3.4
5.6
5.5
7.6
1.9
4.4
Change on
2013
16%
49%
49%
34%
-12%
Harvested Ha
16,239
16,667
1,338
11,147
4,392
5,124
7,227
4,600
1,934
2,236
70,904
Gross Yield
4.2
2.1
47.6
3.8
4.8
0.7
1.5
2.9
1.2
2.5
3.7
Estimated
Net Yield
4.1
2.0
43.7
3.7
4.3
0.7
1.4
2.8
1.1
2.2
3.6
Change on
2013
9%
-15%
-9%
40%
-30%
-42%
32%
n.a.
-31%
-8%
Russia
Crop
Winter wheat
Sunflower
Sugarbeet
Spring barley
Corn
Soybean
Spring rape
Spring wheat
Buckwheat
Other
Total Russia CBS
AGROKULTURA 8 ANNUAL REPORT 2014
Operational review
2015 harvest
The Group’s continuing operations planted a total
of 52,000 ha equally split between Ukraine and Russia. Ukrainian planting was maintained at the level of
the previous year to concentrate on replicating the
improved performance of 2014 rather than aiming
for significant expansion. Russian planting increased
back to more normal levels due to the drier weather
conditions in the sowing season which enabled full
operating targets to be achieved.
Winter planting for 2015 harvest:
Region
Ukraine
Russia CBS
Total
Winter Wheat
7,350
26,375
33,725
Winter Barley
7,350
–
7,350
PLANNED SPRING PLANTING 2015
A total of 74,000 ha are planned to be planted
across Russia and Ukraine this spring to bring the
total land available for harvest to over 120,000 which
is at a level comparable to 2014. Russia’s proportion
of planted land to total land bank continues to increase and in Ukraine the Group will both increase
planting and further rationalise the land bank to increase the proportion of land cultivated.
Average price (ex VAT)
USD per tonne for
selling season
Rapeseed
Corn
Wheat
Sunflower
2014 harvest
Ukraine
381
113
121
287
Winter Rapeseed
10,850
–
10,850
SALES
2014 saw a continuation of relatively depressed pricing for all commodities compared to the period
2009 to 2012. The Group’s sales strategy for Ukraine
extends the sales windows for crops through forward sales to reputable counterparties. Prices for
Ukrainian produced goods are generally closely
correlated to the international prices taking into
account hryvnia exchange rates. Average prices to
date in USD on selected major crops for the 2014
harvest are set out below. Forward sales made in the
first half of 2014 in corn, rapeseed and barley enabled materially higher prices to be achieved than
had the Group sought to sell only after the harvest.
No forward sales have been made to date for the
2015 harvest although the Group intends to make
such contracts at the appropriate time.
2013 harvest
Ukraine
430
159
187
333
The Russian market is more domestically focused
which causes it to be influenced more by the local
environment which in the 2014 selling season has
included certain tariffs on the export of wheat. Given the greater distance from export ports and the
Groups limited silo capacity all Russian crop is sold
domestically.
AGROKULTURA 9 Total
25,550
26,375
51,925
ANNUAL REPORT 2014
2014 harvest
Russia
283
121
137
297
2013 harvest
Russia
299
108
163
273
Operational review
STORAGE
Storage is an important part of the Group’s infrastructure, providing flexibility around crop harvest
and sales as well as reducing operating costs and
maintaining security over the harvested commodity.
The Group has around 228,000 tonnes of storage
located across Russia and Ukraine and expects to
make selected further investments where cash resources permit.
The table below shows the type and location of
the Group’s storage which will be available for use in
the 2015 harvest.
Storage
Grain silo
Flat bed
Other temporary
Total
Russia
10,000
115,000
15,000
140,000
Ukraine
53,000
15,000
20,000
88,000
Total
63,000
130,000
35,000
228,000
Ukraine is expecting to cover approximately 75 per
cent of its storage requirements using own storage facilities. Russia will cover approximately 80 per
cent. Future storage priorities include improving the
quality of Russian storage facilities to reduce wastage as well as adding a third silo in western Ukraine
to reduce logistics costs. Expansion of an additional
10,000 tonnes of in an existing site in Ukraine has
been started and the expanded storage is expected
to be ready for the 2015 harvest.
The Group has contracted external silo capacity
to take harvest in locations where the Group does
not have logistically efficient owned storage facilities. In the medium term, the Group plans to reduce
third party storage usage to minimal levels.
Harvesting winter wheat in Dina, Tambov
AGROKULTURA 10 ANNUAL REPORT 2014
Operational review
Livestock
2014 has shown significant operating improvement
in the Livestock business coming from a very difficult period between 2010 and 2013. It is a more long
term business than the cropping segment with business disruption taking years to come through due to
the birth and milking cycle. In 2014, the Group has
seen more realistic feed costs and availability. This
has permitted changes in feed mix which together
with certain limited investments has led to increased
pregnancy rates and milking metrics.
Average milk production in 2014 was up 14 per
cent to 580 litres per cow per month. Overall production totalled 1,012,000 litres per month. Profitability for the unit improved given the sustained higher milk prices of the past year and the decreased
cost of feed. In 2014 the direct and indirect costs of
production of a litre of milk were SEK 4.1 which compared to revenue and gains of SEK 4.7.
Milk revenue
Meat revenue
Biological asset gain
Total revenue and gain
Per litre (SEK)
3.7
0.3
0.7
4.7
Per litre (USD)
0.54
0.05
0.11
0.70
Direct cost
Indirect cost
Total production costs
2.1
2.0
4.1
0.30
0.29
0.59
Achieved milk prices in 2014 have averaged SEK 3.7
(USD 0.54). Increases in milk price (11 per cent up in
2014 compared to 2013) are partly related to market dynamics but also due to the improved quality
of milk which enables the Group to supply to international brands operating in Russia and charge
premium pricing. Sales of meat have continued to
fall due to the holding back of meat sales due to depressed pricing and the expectation of higher meat
prices due to international meat import restrictions.
This fall should be reversed in the future. Given the
domestic nature of the livestock business with both
costs and revenues being linked to the domestic
market, the recent devaluation of the rouble will
cause a decrease in the segment’s contribution in
2015 compared to the cropping segment where revenues are ultimately correlated to dollar prices not
roubles.
At December 31 2014, the Group’s Russian livestock herd amounted to approximately 5,050 animals, consisting of 1,750 milking cows, 650 dry cows,
2,100 heifers and 550 bulls, calves and meat animals.
Freshly cut forage for the dairy cows
AGROKULTURA 11 ANNUAL REPORT 2014
Operational review
Land
The financial crisis in Ukraine has hindered the
Group’s ability to carry out cost effective restructuring of the land bank. Fortunately a majority of
the most important restructuring was completed
in 2013. The Group still controls too much land in
Ukraine and given the material land rental costs
will seek to either cultivate or dispose of the land.
The new shareholder structure has the potential to
provide financing to support this expansion should
expected returns meet required levels. In addition,
considerable efforts have been placed in develop-
ing an integrated land database in both Russia and
Ukraine to interact operations, land and accounting
to ensure a single point of information within the
Group. In Russia this will be combined with a thorough review of the land in the land bank to conclude
if it meets the long term goals of the Group. The
purpose of integrated land database is to improve
management of the land bank and thereby improve
its security. At 31 December 2014, the land bank extends to 216,600 ha, of which 145,800 are in Russia
and 70,800 are in Ukraine.
31 December
2014
31 December
2013
47,600
44,000
17,300
1,700
11,400
23,800
145,800
48,500
45,900
17,300
–
11,400
23,800
146,900
47,000
45,900
18,000
15,000
9,900
25,200
161,000
70,800
–
70,800
69,600
–
69,600
67,100
26,300
93,400
216,600
216,500
254,400
31 December
2014
31 December
2013
87,400
2,300
56,100
145,800
83,000
5,000
58,900
146,900
87,500
10,000
63,500
161,000
Ukraine
Leased land
Total Ukraine
70,800
70,800
69,600
69,600
93,400
93,400
Total Group
216,600
216,500
254,400
Land bank by cluster (ha)
Russia
North Voronezh (Ertil & Dina)
Kursk
Lipetsk
Kaliningrad
South Voronezh (Vorobievka)
Russia other
Total Russia
Ukraine
Western Ukraine
Ukraine other
Total Ukraine
Total Group
Land bank by category (ha)
Russia
Registered owned land
Land in process of registration
Leased land
Total Russia
AGROKULTURA 12 ANNUAL REPORT 2014
31 December
2012
31 December
2012
Organisation
Corporate Governance
The corporate governance structure of Agrokultura
is as follows
General Meeting of Shareholders
The General Meeting of Shareholders is Agrokultura’s highest decision-making body.
Board of Directors
The Board of Directors is elected by the General
Meeting of Shareholders and presently consists of
four non-executive directors and the Group managing director. The Board of Directors has the ultimate
responsibility for the management of the Group.
Executive Management
The Board of Directors has delegated the day-today management of the business to the executive
management team led by the Managing Director.
The Group Managing Director has appointed local
managing directors for each of the three operating
business units, namely Russia CBS arable, Livestock,
and Ukraine arable. Local operations report to the
local managing directors. In addition the Group
CFO reports to the Group Managing Director. Local
CFO’s report to the Group CFO.
Regular formal and informal meetings of the
executive management team occur and the Group
Managing Director keeps the Board updated
through at least biweekly written reports.
Operational Organisation
Agrokultura’s crop production is concentrated on
two operational clusters, one in the Central Black
Soil Region in Russia headquartered in Voronezh
and one in Western Ukraine headquartered in Lviv.
Each of these main clusters is subdivided into several production entities. A small Group administrative
office is located in London.
The Company also operates three large dairy
farms in Russia located in Lipetsk and Voronezh
oblasts. There exists also a small meat production
facility in Kursk oblast.
Employees
The average number of employees in the Group
during the year was 1,489 (1,788). Payroll and direct
costs were a main area of focus in the cost reduction
targets, especially in the Ukrainian business. The
Ukraine payroll for 2014 was reduced by approximately 45 per cent compared to 2013 in USD terms
and 20% in local currency terms. The Group operates with a lean senior management team providing
a co-ordinated and efficient decision making unit. In
total, payroll costs fell by approximately 28 per cent
across the Group in 2014 in SEK terms.
Governance Principles
In its work, the Group is managed in accordance
with the Swedish Companies Act (Sw: Aktiebolagslagen). The Group is not formally obliged to comply with the Swedish Corporate Governance Code
(Sw: Svensk kod for bolagsstyrning) but has stated
the ambition to be in line with the code to the greatest extent possible.
AGROKULTURA 13 ANNUAL REPORT 2014
Corporate Social Responsibility
CSR WORK
Agrokultura aims to be a responsible corporate citizen in the regions where it operates. This is achieved
through
■■ adherence to state and local regulations
■■
having strong company policies on ethics
■■
maintaining good relationships with all stakeholders and local communities in which the
Group operates
The Group’s objective is to contribute to the principal of environmental sustainability. For this purpose,
the Group is in the process of establishing a policy
for environmental work. The objective of the policy
is to be implemented and integrated into the operations. This is achieved by the development and
follow-ups of environmental related objectives in
the areas of chemicals, water, land, biodiversity and
soil erosion. The reporting of this work is under development with the purpose to establish qualitative
as well as quantitative targets in relation to environmental issues. Already today, environmental assessments are always taken into account before the purchase of agricultural property and when considering
crop rotation.
ENVIRONMENT
Due to the extensive scale of Agrokultura’s cropping
and livestock businesses, the Group has a significant
impact on the locations of its operations. The Group
has identified the following areas as particularly important to monitor for the management of environment and the related business impact:
■■ Use of chemicals (fertilizer, pesticides, herbicides
and fungicides)
■■
Animal health
■■
Disposal of animal manure
■■
Soil erosion
■■
Water use
■■
Carbon footprint
The Group’s strategy is to introduce modern efficient farming practices into its operations in Russia and Ukraine in a social and environmentally responsible way. In many cases these new agricultural
AGROKULTURA 14 methods mean significant improvements in terms of
environmental impact compared to current farming
in the region. Among the practices used are:
■■ Seeding in the stubble and banning the burning
of straw which conserves humidity and nutrients
as well as prevents the release of carbon dioxide
into the atmosphere.
■■
Precision farming – through the use of the latest
application technologies of fertiliser and plant
protection, the risks of contamination and overuse are reduced.
■■
The Group is in the process of introducing no-til
farming into the Russian business. No-til farming
is a way of cropping from year to year without
disturbing the soil through tillage. Through notil, organic matter is concentrated in the soil surface which prevents evaporation and minimises
soil erosion. The fact that the soil is not cultivated and the increase of organic matter in the soil
reduces the emission of carbon dioxide. No-til
farming reduces field works and thereby reduces
fuel costs and fossil fuel usage.
Thanks to the fertile soil in the regions where the
Group operates, the amount of fertiliser used is significantly lower than on most Western farms on a per
hectare basis. Application of all crop inputs takes
place only after careful monitoring and consideration as the exact crop needs. The Group does not
use groundwater for infield irrigation.
The Group is actively taking on measures to
minimise the usage of fossil fuels, the risk of erosion
and chemical pollution. On all these parameters, the
interests of the Group coincide with the most environmentally friendly way of operating.
CHARITY AND SOCIAL WORK
Agrokultura is active with investments in social projects which allow the Group to maintain good relationships with the communities in which our operations are located. Examples of the type of social
work carried out in the year include projects such
as the purchase of computers for schools, repair of
school buildings and buses. Projects tend to be of
limited monetary value but are of high local impact.
ANNUAL REPORT 2014
Share development
Since the end of the reporting period the Group’s
shares which were listed on Nasdaq OMX First North
have been delisted with the controlling shareholders expressing the intention to initiate a squeeze out
Shareholder
Magna Finance Investments Limited
Other
Total
at a price per share of SEK 4.5. At 20 March 2015
the Group had approximately 188 shareholders. The
Group has decided not to pay a dividend.
The main shareholders at 26 March 2015 were:
Number of shares
140,369,428
5,893,700
146,263,128
AGROKULTURA 15 ANNUAL REPORT 2014
Capital and votes
96.0%
4.0%
100%
Board of Directors’ report
Income Statement
Revenues
Revenues for the year were SEK 539 million (SEK 617
million), a drop of 13 per cent. This reduction was
driven by a weighted average 12 per cent reduction
in commodity prices compared to 2013 together
with an increase of grain inventories held over the
year end. The increase in grain inventories was intended to increase the average price received by
selling less crop in the period immediately after
harvest. These were partially offset by a 9 per cent
improvement in yield. 91 per cent of revenues were
derived from the cropping business with the remainder from Livestock which is located in Russia. Of the
cropping revenues, 45 per cent were derived from
Russia and 55 per cent from Ukraine. At the period
end, the Group had unsold 2014 harvested crop valued at SEK 131 million which is included in inventory
on the balance sheet. These inventories were mostly
sold at around carrying value in quarter 1 2015.
The Group has recognised a profit from changes
in the fair value of biological assets of SEK 160 million. This reflects the current pricing together with
the average 3 year track record of yields. The profit
is arrived through a combination of predominately
realised profits for harvested 2014 crops of SEK 131
million, unrealised profits for crops in the ground at
the period end of SEK 24 million and livestock gains
of SEK 9 million.
Costs
Costs of sales fell by 21 per cent despite a largely
flat level of planting. This is impacted most significantly by the material cost cutting programme following the review of all crop technical cards and the
considered replacement in some cases of branded
31 December 2014
Seed
Fertiliser
Chemical
Total seed, fertiliser & chemical
Other direct & Indirect costs
Land costs
Administration allocation
Other costs / income
Subtotal
Depreciation & amortisation
Total cost
chemicals with generics. Improved controls ensured
that the investment made in inputs was delivered in
full to the fields. Reduced head count costs and devaluation of the Ukrainian hryvnia helped to further
reduce costs.
Livestock feed costs are again on the rise in local
currency which will impact future profitability due to
the domestic nature of the livestock business.
Milk revenues are locally priced whereas bought
in feed costs are loosely correlated with foreign
currency commodity prices. Other than third party
harvest costs which are higher given the higher tonnages which have been harvested thanks to continuously improving yields, most elements of direct
costs have been reduced.
Land costs which are predominantly Ukrainian
are reduced by 21 per cent following the disposal
underutilised land and due to the weakening currency. The effects of the employee reductions is
shown through the 27 per cent decrease in direct
labour costs.
Reductions in direct labour costs have many follow on improvements with cost reductions associated with having to support less employees. For the
cropping business in Russia, the Group is targeting
further reductions in payroll costs from the SEK 580
($82) per cultivated ha in 2014. In Ukraine our initial
target is to deliver improvements on 2014’s SEK 890
($120) per cultivated ha which in the short term will
be aided by the recent currency devaluations. If
achieved, these metrics will compare favourably to
the listed peer group.
Whilst administration expenses fell by 41 per
cent compared to 2013 the Group still sees the potential for further improvements.
Cost per ha analysis is outlined below:
Ukraine – SEK per Ha
SunRape- Winter
seed
wheat
flower
295
217
382
1,380
1,274
225
1,135
528
416
2,810
2,019
1,022
2,440
2,645
2,306
736
736
736
412
412
412
(16)
(16)
(16)
6,382
5,797
4,460
524
524
524
6,906
6,321
4,984
AGROKULTURA 16 Corn
1,031
1,220
535
2,786
3,018
736
412
(16)
6,936
524
7,460
ANNUAL REPORT 2014
Russia CBS – SEK per Ha
SunBarley
Wheat
flower
248
251
345
148
399
182
124
190
249
520
840
776
1,237
1,308
1,351
160
160
160
308
308
308
62
62
62
2,287
2,678
2,657
486
486
486
2,773
3,164
3,143
Soya
299
12
426
737
1,264
160
308
62
2,531
486
3,017
Board of Directors’ report
31 December 2014
Seed
Fertiliser
Chemical
Total seed, fertiliser & chemical
Other direct & Indirect costs
Land costs
Administration allocation
Other costs / income
Subtotal
Depreciation & amortisation
Total cost
31 December 2013
Seed
Fertiliser
Chemical
Total seed, fertiliser & chemical
Other direct & Indirect costs
Land costs
Administration allocation
Other costs / income
Subtotal
Depreciation & amortisation
Total cost
Ukraine – USD per Ha
SunRape- Winter
seed
wheat
flower
43
32
56
201
186
33
165
77
61
409
295
150
356
386
336
107
107
107
60
60
60
(2)
(2)
(2)
930
846
651
76
76
76
1,006
922
727
Ukraine – USD per Ha
SunRape- Winter
seed
wheat
flower
63
47
82
297
274
48
244
114
90
604
435
220
421
404
343
135
135
135
110
110
110
(4)
(4)
(4)
1,266
1,080
804
106
106
106
1,372
1,186
910
When compared to 2013 data the cost per ha information shows the impact of cost reductions and currency devaluations. Much improved input efficiency
in Ukraine can be seen together with lower overhead costs. Targeted yields are now being achieved
at the same time as costs are being materially reduced. Land rental costs remain high in Ukraine due
to the high proportion of unplanted land and due to
the fact that all land is rented in Ukraine compared
to a majority of owned land in Russia. A number of
crops including winter wheat, sunflower, sugar beet
and soya provided positive net profit margins.
Results
The profit before interest, tax, depreciation and amortisation (EBITDA) was SEK 122 million (loss SEK 129
million). Depreciation and amortisation was SEK 65
million (SEK 96 million). Net profit was SEK 22 million (loss 262 million). The net profit was the first net
profit in the Group’s history with each business unit
making a positive net profit contribution.
AGROKULTURA 17 Corn
150
178
78
406
440
107
60
(2)
1,011
76
1,087
Russia CBS – USD per Ha
SunBarley
Wheat
flower
36
37
50
22
58
27
18
28
36
76
123
113
180
191
197
23
23
23
45
45
45
9
9
9
333
391
387
71
71
71
404
462
458
Corn
222
262
115
599
678
135
110
(4)
1,518
106
1,624
Russia CBS – USD per Ha
SunBarley
Wheat
flower
Soya
61
42
55
46
45
72
32
40
30
26
45
64
136
140
132
150
230
254
240
204
23
23
23
23
58
58
58
58
32
32
32
32
479
507
485
467
113
113
113
113
592
620
598
580
Soya
44
2
62
108
184
23
45
9
369
71
440
Other expenses are mainly made up of foreign
currency exchange losses, and losses on disposal
of property plant and equipment. Foreign currency
exchange losses of SEK 55 million were incurred on
the Group’s foreign currency working capital and
finance lease debts. Whilst these losses are significant they are offset by corresponding gains on
agricultural commodities which are predominantly
priced in USD or Euros.
2014 exceptional items mostly related to a small
exceptional gain on the disposal of the Group’s operations in Kaliningrad which overlapped 2013 and
2014. The profit from continuing operations was
SEK 44 million (loss SEK 257 million). Excluding exceptional items, this profit was SEK 40 million (loss
SEK 251 million).
The breakdown of the result shows that all business segments within the Group contributed positively to the reported positive net profit despite the
weak pricing environment.
ANNUAL REPORT 2014
Board of Directors’ report
Operating result by segment
SEK million
Year ended 31 December 2014
EBITDA
Operating loss
Russia cropping
Ukraine
Russia Livestock
75.5
41.0
46.5
23.2
16.3
9.6
47.6
(7.7)
(120.3)
(155.7)
(3.2)
(13.2)
Year ended 31 December 2013
EBITDA
Operating result
Balance Sheet
Non-current assets
Non-current assets have fallen by 34% to 517 million SEK mainly due to a devaluation of the Ukrainian hryvnia and Russian rouble which had fallen by
63% and 44% respectively by 31 December 2014
when compared to 31 December 2013. Certain noncurrent assets were not impacted by the currency
falls due to their foreign currency carrying value and
the Russian business saw some investments in the
form of new spraying capacity and other equipment
which added to non-current asset values.
Current assets
Inventories incorporating work in progress, finished
agricultural produce and raw materials amounted
to SEK 192 million. Finished agricultural produce
amounted to SEK 131 million of this figure and will
be sold in the first quarter of 2015 at a level around
book value.
Biological Assets
The fair value of cropping biological assets is SEK 101
million. This is higher than 2013 given higher levels
of planting carried out in Russia and Ukraine due to
the exceptionally wet weather in Autumn 2013 but
also due to the improved 3 year historic yield trend
due to substantially improved operational and financial performance.
The table below shows the main assumptions
which have been made in the valuation of the crops
in the ground at December 31 2014.
Russia
Crop
Rapeseed
Winter Wheat
Winter Barley
Biological Asset
assumed yield
n.a.
3.5
n.a.
Ukraine
Biological Asset
assumed price
SEK / tonne
n.a.
982
n.a.
Liquid resources and indebtedness
Group financial indebtedness from continued operations has reduced to SEK 96 million compared to
SEK 167 million a year before. This is due to the satisfaction of the debt to former fund manager Alpcot
Capital Management together with certain operational debt reductions linked to the increased cost
of borrowing in both Russia and Ukraine. Cash and
equivalents at the period end were SEK 31 million
giving a net debt of SEK 65 million.
AGROKULTURA 18 Biological Asset
assumed yield
2.8
4.4
4.1
SEK Thousands
Debt
Cash and cash
equivalents
Net debt
ANNUAL REPORT 2014
Biological Asset
assumed price
SEK / tonne
2,494
988
1,130
31 December
2014
(95,812)
30,832
31 December
2013
(166,847)
28,790
(64,980)
(138,057)
Board of Directors’ report
Key ratios
The Group
Operating margin %
Equity / assets ratio %
Shareholders equity MSEK
Average number of shares
Number of shares at end of year
Earnings per share, SEK
Equity per share, SEK
2014
10.7%
80.0%
724
140,221,049
146,263,128
0.2
5.0
2013
(36.5%)
75.6%
941
139,008,658
139,008,658
(1.9)
6.8
PARENT COMPANY
Revenues and results
The parent company provides management services
and production expertise to the subsidiaries, as well
as loan and equity financing for investments and
operations. Revenues in the parent company consisted of sales of services to other group companies
amounting to SEK 5.0 million (SEK 9.1 million). The
operating result amounted to a loss of SEK 14.5 million (loss SEK 34.3 million). The result for the period
amounted to a loss of SEK 140.8 million (loss of SEK
315.0 million). Included in the results for the period
are dividends from Group companies amounting to
SEK 283 million which are included in income from
group companies. The company also made impairments to its investments and loans to Group companies, amounting to SEK 473 million which are included in finance expense.
Important balance items and cash
Other liabilities were reduced during the year
through settlement of promissory notes amounting
to SEK 48.4 million through the issue of 7,254,471
new shares at a subscription price of 5 SEK per share
and through the payment of SEK 12.1 million. The
solidity of the parent company was at year end 99.5
per cent (91.9 per cent). As of 31 December 2014,
cash and cash equivalents in the parent company
amounted to SEK 5.9 million (SEK 3.4 million).
Employees
The average number of employees in the parent
company was 3 (9).
FINANCING AND HEDGING
Due to the political and economic situation in
Ukraine short term working capital financing has
become more scarce and difficult to obtain in hard
currencies. As a result in 2015 the Group has entered
into $12 million of short term working capital loan
AGROKULTURA 19 2012
(10.1%)
80.9%
1,257
134,124,104
139,008,658
(0.8)
9.0
2011
(27.3%)
81.4%
1,100
84,656,369
99,197,472
(1.4)
11.1
2010
(54.9%)
74.5%
951
48,005,758
49,591,892
(4.0)
19.2
facilities with its two controlling shareholders. These
facilities, which are on favourable terms, will be used
to finance the spring farming operations in Ukraine.
Positive cash flow during 2014 has meant that
the Russian business is not expected to require any
significant working capital facilities to finance operations during 2015. Limited investments in machinery
will continue to be made where a positive return on
investment can be made.
When appropriate, the Group uses financial
instruments such as forward offtake contracts or financial derivatives to hedge commodity prices. The
purpose of the Group’s hedging strategy is to hedge
and reduce business risk rather than to speculate.
Over the period, the Russian rouble and Ukrainian
hryvnia have weakened significantly. Since the period end, both the Russian rouble and Ukrainian
hryvnia have fallen further against major currencies.
Ukrainian bank debt was denominated mostly in US
dollars which naturally matches its production which
is priced off US dollar dominated markets. Russian
bank debt is denominated in Russian roubles which
matches the principal that Russian sales prices do
not follow international prices in the same way and
therefore are Russian rouble dominated. Weakening
of local currencies in the short term is not considered disruptive for the Group’s local operations.
INTERNAL CONTROL AND RISK MANAGEMENT
Business processes within the Group are designed
to ensure that potential errors and misstatements
in the financial reporting process prevented, discovered and corrected. These processes include
strict financial operating rules to prevent and detect
fraud. The rules are communicated to new employees and existing employees on regular occasions
and enforced through regular follow up internal audit reviews. Internal audit findings are discussed with
management and staff to ensure that recommendations are understood and implemented.
ANNUAL REPORT 2014
Board of Directors’ report
At various levels of management the Group also
carries out a monthly review of the financial performance and position together with a comparison to
budget.
POLITICAL AND ECONOMIC ENVIRONMENT
The future stability of the Russian economy is largely
dependent upon the effectiveness of economic, financial and monetary measures undertaken by the
government together with the international perceptive of actions carried out by the government.
In 2014, the Russian economy was negatively impacted by a significant drop in crude oil prices and
a significant devaluation of the Russian rouble, as
well as sanctions imposed on Russia by many western economies. In December 2014, rouble interest
rates increased significantly after the Central Bank
of Russia raised its key rate to 17%.The combination
of the above resulted in reduced access to capital,
a higher cost of capital and uncertainty regarding
economic growth, which if in place for an extended
period of time could negatively affect the Group’s
future financial position, results of operations and
business prospects. In the short term, the reduction in local currency denominated costs more than
offsets the increase in financing costs and management believes it is taking appropriate measures to
support the sustainability of the Group’s business in
the current circumstances.
In 2014, the economic and political situation in
Ukraine also deteriorated significantly. As a result,
Ukraine has experienced a fall in gross domestic
product, a significant negative balance of payments
and a sharp reduction in foreign currency reserves.
Furthermore, between 1 January 2014 and 31 December 2014, the Ukrainian hryvnia devalued to major foreign currencies by approximately 63%, and the
National Bank of Ukraine imposed certain restrictions
on foreign currency operations. Restrictions have
also been introduced for certain cross-border settlements. International rating agencies have downgraded sovereign debt ratings for Ukraine. Currently,
a loan programme extension, which may necessitate
certain austerity measures, is being negotiated by
Ukraine with the International Monetary Fund. The
combination of the above events has resulted in a
deterioration of liquidity and much tighter credit
conditions where credit is available. Again management has seen a material decrease in locally driven
costs (in SEK terms) which offsets the raised levels of
AGROKULTURA 20 inflation and interest costs. Problems with the extension of credit facilities have been met with the support of shareholder loans after the reporting date.
WORK OF THE BOARD
The Group’s Board of Directors has during the year
consisted of four members, including the Chairman,
elected at the Annual General Meeting. During the
year, the Board convened 21 board meetings. It is
proposed that following the AGM there will be a
total of five members of the Board due to the appointments made on 26 March 2015. The Board of
Directors are responsible for determining the remuneration of the executive management team and in
doing so consider factors such as the market rate for
such roles and key performance indicators. Board
members are appointed at the Company’s annual
general meeting or Extraordinary general meeting.
ANNUAL GENERAL MEETING
The Group’s Board of Directors has convened an Annual General Meeting on 26 May 2015 at 10.00 am.
The Group’s articles of association contain a record
clause and the Group’s share register is kept by Euroclear Sweden AB. No share certificates are issued.
Dividend Policy
Agrokultura may distribute future profits to the
shareholders. The Group’s ambition is that the dividend over time shall amount to at least 30 per cent
of the result after tax. When proposing the allocation
of the Group’s results, the Board will consider the investment needs to guarantee the Group’s development and financial situation in general. Agrokultura
has not, since the Group was incorporated in 2006,
paid any dividends.
Proposed distribution of the Parent Company’s
retained earnings
Share premium reserve
Reserve for fair value
Retained earnings
Loss for the year
Retained earnings and reserves of
the parent company
SEK
1,461,126,147
(779,443)
(1,258,639,650)
(204,699,908)
(2,993,000)
The Board of Directors proposes that the share
premium reserve, reserve for the fair value, retained earnings, and loss for the year, amounting to
-2,993,000 be carried forward.
ANNUAL REPORT 2014
AGROKULTURA 21 ANNUAL REPORT 2014
Group statements
CONSOLIDATED STATEMENT OF COMPREHENSIVE INCOME
SEK thousands
Note
Continuing operations
Revenue
Gain or loss on biological assets
Cost of sales
Gross profit
Year ended 31
December 2014
5
18
6
Distribution costs
Other income
Other expense
Administrative expenses
Exceptional items
Operating result
7
8
9,10
11
Year ended 31
December 2013
539,384
160,395
(513,634)
186,145
617,393
(30,701)
(648,833)
(62,141)
(14,667)
7,879
(62,645)
(63,062)
4,206
57,856
(23,339)
11,466
(39,492)
(106,317)
(5,648)
(225,471)
Finance income
Finance expense
Result before tax
12
13
637
(16,611)
41,882
345
(22,173)
(247,299)
Income tax
14
2,138
(9,491)
44,020
(256,790)
(22,304)
(4,734)
21,716
(261,524)
Currency translation differences
(292,688)
(54,633)
Total comprehensive loss for the year
(270,972)
(316,157)
20,725
991
(268,862)
7,338
(271,595)
623
(323,515)
7,358
0.15
0.31
(0.16)
140,221,049
146,263,128
(1.88)
(1.85)
(0.03)
139,008,658
139,008,658
Result for the year from continuing operations
Loss for the year from discontinued operations
22
Result for the year
Result for the year attributable to:
Equity holders of the Company
Non-controlling interests
Total comprehensive loss attributable to:
Equity holders of the Company
Non-controlling interests
Earnings per share:
Basic and diluted earnings per share
Basic and diluted earnings per share from continuing operations
Basic and diluted earnings per share from discontinued operations
Weighted average number of shares
Number of shares at the end of the period
AGROKULTURA 22 ANNUAL REPORT 2014
Group statements
CONSOLIDATED STATEMENT OF FINANCIAL POSITION
SEK thousands
Note
ASSETS
Non-current assets
Property, plant and equipment
Intangible assets
Land in process for registration
Other non-current financial assets
Non-current biological assets
Deferred tax assets
Other non-current assets
Total non-current assets
31 December 2014
15
16
410,017
37,102
6,745
79
50,701
11,564
361
516,569
629,726
53,796
22,083
11,779
57,401
9,271
1,811
785,867
191,624
101,755
46,735
479
7,731
30,832
379,156
9,574
183,284
72,922
71,917
997
3,197
28,790
361,107
98,341
905,299
1,245,315
26
26
26
731,315
1,463,126
(561,089)
(909,319)
724,033
303
724,336
695,043
1,463,126
(285,437)
(929,785)
942,947
(1,917)
941,030
24
14
52,511
3,183
55,694
73,313
509
73,822
23
24
79,146
43,301
24
122,471
2,798
126,932
93,534
–
220,466
9,997
905,299
1,245,315
17
18
14
Current assets
Inventories
Biological assets
Trade and other receivables
Income tax receivable
Other financial assets
Cash and cash equivalents
Total current assets
Assets in disposal groups classified as held for sale
31 December 2013
19
18
20
17
21
22
TOTAL ASSETS
EQUITY AND LIABILITIES
EQUITY
Equity share capital
Other paid in capital
Foreign currency translation reserve
Accumulated deficit
Equity attributable to owners of the parent Company
Non-controlling interests
Total equity
Non-current liabilities
Other non-current financial liabilities
Deferred tax liabilities
Total non-current liabilities
Current liabilities
Trade and other payables
Other current financial liabilities
Income tax payable
Total current liabilities
Liabilities in disposal groups classified as held for sale
22
TOTAL LIABILITIES AND EQUITY
AGROKULTURA 23 ANNUAL REPORT 2014
Group statements
CONSOLIDATED STATEMENT OF CHANGES IN EQUITY
SEK thousands
Equity
share
capital
Balance at 31 December 2012 695,043
Net result for the year
–
Other comprehensive loss
–
Total comprehensive loss
–
Purchase of shares from noncontrolling interests
–
Disposal of subsidiary
–
Balance at 31 December 2013 695,043
Net result for the year
–
Other comprehensive loss
–
Total comprehensive loss
–
Direct share issue
36,272
Dilution on interest in subsidiary
–
Disposal of subsidiary
–
Balance at 31 December 2014 731,315
Foreign
Other
currency
paid in translation Accumulated
capital
reserve
deficit
Attributable
to owners of
Nonthe parent controlling
company interests
Total
equity
1,463,126
–
–
–
(222,968)
–
(54,653)
(54,653)
(679,316)
(268,862)
–
(268,862)
1,255,885
(268,862)
(54,653)
(323,515)
1,270 1,257,155
7,338 (261,524)
20
(54,633)
7,358 (316,157)
–
–
1,463,126
–
–
–
–
–
–
1,463,126
479
(8,295)
(285,437)
–
(293,311)
(293,311)
–
–
17,659
(561,089)
18,393
–
(929,785)
20,725
–
20,725
–
(259)
–
(909,319)
18,872
(8,295)
942,947
20,725
(293,311)
(272,586)
36,272
(259)
17,659
724,033
(20,838)
(1,966)
10,293
1,998
(1,917) 941,030
991
21,716
623 (292,688)
1,614 (270,972)
347
36,619
259
–
–
17,659
303 724,336
AGROKULTURA 24 ANNUAL REPORT 2014
Group statements
CONSOLIDATED CASH FLOW STATEMENT
Year ended
31 December 2014
SEK thousands
Year ended
31 December 2013
Operating activities
Cash received from customers
Cash received from government grants
Cash paid to suppliers and personnel
Cash flow used in operations
618,292
16,116
(634,432)
(24)
679,681
22,009
(697,638)
4,052
Interest paid
Interest received
Income tax paid
Net cash used in operating activities
(16,466)
376
(4,888)
(21,002)
(20,082)
145
(3,350)
(19,235)
Investing activities
Acquisition of subsidiaries, net of cash acquired
Acquisition of tangible fixed assets
Acquisition of intangible assets
Disposal of subsidiaries
Sale of fixed assets and intangible assets
Loans granted
Repayment of loans granted
Net cash used in investing activities
(163)
(28,106)
(7,778)
53,495
33,848
–
–
51,296
–
(49,996)
–
19,526
26,052
(9,546)
25,388
11,424
110,964
(137,170)
(26,206)
126,270
(129,265)
(2,995)
Net cash flow for the year
Cash at the beginning of the year
Exchange difference on cash
Cash at the end of the year
4,088
30,902
(4,143)
30,847
(10,806)
43,628
(1,920)
30,902
Less cash included in assets held for sale
Cash in continued operations
(15)
30,832
(2,112)
28,790
Financing activities
Loans received
Repayment of loans
Net cash generated from financing activities
AGROKULTURA 25 ANNUAL REPORT 2014
Notes to the Group statements
1.GENERAL INFORMATION
Agrokultura AB (“the Company”) is a Swedish
limited liability company, incorporated in 2006.
Agrokultura invests in farmland and agricultural operations in Russia and other CIS states. The Company has subsidiaries in Sweden, Russia, Ukraine, Cyprus, United Kingdom, Isle of Man and Luxembourg
(“the Group”).
Until 27 February 2015 the Company’s shares
were traded on NASDAQ OMX First North in Stockholm with the ticker name AGRA. The majority ultimate beneficial owners of the Company are Nikolay
Fartushnuak and Igor Khydokormov who together
own 96% of the Company. The Company’s domicile
is Stockholm with the address Artillerigatan 6, SE114 51 Stockholm, Sweden.
2. ACCOUNTING PRINCIPLES
(a) Principles applied in preparing the financial
statements
The consolidated financial statements are prepared
on the historical cost basis, except for biological assets which are recognised at fair value less cost to
sell in accordance with IAS 41 “Agriculture”, and
certain financial instruments which are recognised at
fair value in accordance with IAS 39 “Financial instruments, recognition and measurement”. All amounts
are in thousands of Swedish kronor, SEK thousands,
unless otherwise indicated.
The Group has prepared a cash flow forecast
which takes into account reasonably possible cash
inflows and outflows from its operations and external
funding. The forecast has been prepared through to
June 2016 and supports the conclusion of the Directors that the Group will be able to operate as a
going concern with its current resources and those
anticipated in the future. The cash flow forecast is
dependent on key assumptions including:
■■ Achieving a successful 2015 harvest with
yields and prices in line with managements
expectations.
■■
The refinancing in 2015 and 2016 of debts in
both Russia and Ukraine.
The Directors have concluded that these are uncertainties that may cast doubt over the Group’s ability
to continue as a going concern. Nevertheless after
considering the uncertainties, the Directors remain
confident that the Group will continue to have adequate resources to continue in operation for the
AGROKULTURA 26 foreseeable future. For this reason, the financial
statements of the Group have been prepared on a
going concern basis.
Accordingly, these financial statements do not
include any adjustments to the carrying amount or
classification of assets and liabilities that would result if the Group were unable to continue as a going
concern.
(b) Statement on compliance with the rules in
force
The consolidated financial statements have been
prepared in compliance with International Financial
Reporting Standards (IFRS) and interpretations from
the IFRS Interpretations Committee, as adopted
by EU. The consolidated financial statements have
also been prepared in compliance with the Swedish Annual Accounts Act and RFR 1 ‘Supplementary
Accounting Rules for Groups issued by the Swedish Financial Reporting Board. The parent company
Agrokultura AB’s separate financial statements have
been prepared according to the Swedish Annual Accounts Act and recommendation RFR 2 ‘Accounting
for legal entities’ issued by the Swedish Financial
Reporting Board.
(c) Standards, amendments and interpretations
that came into effect on 1 January 2014
The following revised and amended IFRS standards
and IFRIC interpretations issued by the International
Accounting Standards Board (IASB) have been applied from 2014 and have had no material effect on
the consolidated financial statements.
■■ Amendments to IAS 32 – Financial instruments:
Presentation. Clarifies some of the requirements
for offsetting financial assets and financial liabilities in the statement of financial position
■■
Amendments to IAS 36 – Impairment of Assets.
Requirement for additional disclosures when
the recoverable amount for an impaired asset is
based on its fair value less costs of disposal.
■■
Amendments to IAS 39 – Novation of Derivatives and Continuation of Hedge Accounting.
The amendment introduces a relief for hedge
accounting by permitting continued hedge accounting also when a derivative is transferred to
a central counterparty.
ANNUAL REPORT 2014
Notes to the Group statements
(d) New and revised IFRSs in Issue but not yet
effective
The following new standards and interpretations are
effective from 2015 or later and which the Group has
not early adopted:
■■ IFRS 9 – Financial Instruments. The standard will
replace IAS 39 Financial Instruments: Recognition and Measurement. It contains rules for classification and measurement of financial assets
and liabilities, impairment of financial instruments, and hedge accounting. The standard is
effective as from 2018 but is not yet endorsed by
the European Union.
■■
IFRS 15 – Revenue from Contracts with Customers. The standard deals with the accounting for
revenues from contracts and for sales of certain
non-financial assets. It will replace IAS 11 Construction Contracts and IAS 18 Revenue as well
as adherent interpretations. The standard is effective as from 2017 but is not yet endorsed by
the European Union.
The Group Intends to adopt these standards from
the date when they will become effective and is currently assessing the impact of adoption.
IFRIC 21– Levies. The interpretation clarifies
when a liability for a levy shall be recognized. Levies
are imposed by governments and governmental organizations in accordance with laws and/or regulations other than income taxes, fines and other penalties. The interpretation is effective as from 2015
but has no material effect on the Group’s financial
statements.
(e) Basis of consolidation
The financial statements for the parent company
and the subsidiaries that are included in the consolidated financial statements pertain to the same period and are prepared according to the accounting
principles that apply for the Group. All intra-group
transactions, balances and any unrealised profits
or losses arising from intra-group transactions are
eliminated in full on consolidation. The consolidated financial statements incorporate financial statements of the parent company and its subsidiaries,
from the date that control effectively commenced
until the date that control effectively ceased. Control is present when the parent company is exposed
AGROKULTURA 27 to the variable returns from its involvement in the
subsidiary, and may affect those returns through its
influence.
Acquisition-related costs are generally recognized in profit or loss as incurred.
Income and expenses of subsidiaries acquired or
disposed of during the year are included in the consolidated statement of comprehensive income from
the effective date of acquisition and up to the effective date of disposal, as appropriate. Total comprehensive income of subsidiaries is attributed to the
owners of the Company and to the non-controlling
interests even if this results in the non-controlling interests having a deficit balance.
Assets (or disposal groups) that are classified as
held for sale in accordance with IFRS 5 Non-current
Assets Held for Sale and Discontinued Operations
are measured in accordance with that Standard.
Subsidiaries
The subsidiaries are consolidated according to the
purchase method. The purchase method means,
among other things, that the cost of an acquisition
is allocated to the acquired assets, liabilities and
contingent liabilities based on their fair values at the
date of acquisition. If the cost of the acquisition exceeds the acquired assets, liabilities and contingent
liabilities, the difference is recognised as goodwill. If
the cost of the acquisition is less than the net assets
of the acquired subsidiary, the difference is recognised directly in profit and loss.
Non-controlling interests are presented within
the equity of the Group in the Statement of financial position. The proportionate shares of profit or
loss attributable to non-controlling interests and to
equity holders of the parent company are presented
below the statement of comprehensive income.
Transactions between non-controlling interests and
Group shareholders are transactions within equity
and are thus shown in the statement of changes in
equity. Non-controlling interest is recognized at the
date of acquisition either as the proportionate share
of the net assets or at fair value which is decided
separately for each acquisition.
ANNUAL REPORT 2014
Notes to the Group statements
(f) Segment reporting
Operating segments are reported in a manner consistent with the internal reporting provided to the
Board of Directors, Managing Director and top management. The management considers the business
primarily from the perspective of different business
areas. Segments are presented to the management
on a regional basis, and the dairy farming business is
presented and reviewed as a separate business area.
Please see Note 4 – Segment reporting for details.
(g) Translation of foreign currencies
The Group’s consolidated financial statements are
presented in Swedish kronor, SEK, which is the functional currency of the parent company and the reporting currency of the Group. The functional currency for each entity in the Group is determined
based on the economic environment in which it
operates, which largely corresponds to the local currency in the respective country – RUR for Russia and
UAH for Ukraine. Assets and liabilities in foreign operations are translated into SEK at the exchange rate
prevailing at the balance date. Income statements in
foreign operations are translated using the average
Equivalent SEK for:
1 United States Dollar
1 EURO
1 British Pound
1 Ukrainian Hryvnia
100 Russian Rouble
monthly exchange rate. Translation differences that
arise on the translation of foreign operations are recognized in Other comprehensive income together
with foreign currency borrowings accounted for as
a hedge of a net investment in a foreign operation.
These are accumulated in equity until the disposal
of a net investment, at which time they are recognised in profit and loss.
In preparing the financial statements of each
individual group entity, transactions in currencies
other than the entity’s functional currency (foreign
currencies) are recognised at the official rates of
exchange at the dates of the transactions. At the
end of each reporting period, monetary items denominated in foreign currencies are retranslated at
the official rates at that date. Non-monetary items
carried at fair value that are denominated in foreign
currencies are retranslated at the official rates at the
date when the fair value was determined. Non-monetary items that are measured in terms of historical
cost in a foreign currency are not retranslated.
The following exchange rates have been used in
connection with the preparation of the consolidated
financial statements:
Closing rate at
31 December 2014
Average rate
2014
Closing rate at
31 December 2013
Average rate
2013
7.8117
9.5155
12.1388
0.5004
13.8848
6.8577
9.0968
11.2917
0.5816
17.8732
6.5084
8.9430
10.7329
0.8131
19.9421
6.5140
8.6494
10.1863
0.8150
20.4208
(h) Tangible fixed assets
Property, plant and equipment
Property, plant and equipment are recognised at
historical cost less accumulated depreciation and
any impairment losses. Assets arising on the acquisition of a new subsidiary are stated at fair value at
the date of acquisition. Property, plant and equipment are recognized as such when all related risks &
economic benefits are transferred to the Group and
when they are ready for their intended use. When an
asset is not ready for its intended use but risks and
economic benefits are transferred to the Group, this
item is recognized within property, plant and equipment as a part of construction in progress. Interest
costs on borrowings to finance the construction of
these assets are capitalised as part of the cost during the construction period.
AGROKULTURA 28 Depreciation is recognised so as to write off the
cost (other than land) less their residual values over
their useful lives, using the straight-line method. The
estimated useful lives, residual values and depreciation method are reviewed at the end of each reporting period, with the effect of any changes in estimate
accounted for on a prospective basis. See also construction in progress. The review is based on the current condition of the assets and estimated period
during which they will continue to bring economic
benefit to the Group.
The depreciation of property, plant and equipment is based on the following estimated useful lives:
Buildings
Capitalised land improvements
Agricultural equipment
Vehicles
Other assets
ANNUAL REPORT 2014
20–50 years
25 years
5–20 years
4–10 years
3–5 years
Notes to the Group statements
The carrying amount of property, plant and equipment is removed from the statement of financial position upon retirement or sale of the asset, or when
no future economic benefits can be expected from
the use of the asset. The gain or loss that arises when
a tangible fixed asset is removed from the statement
of financial position is recognised in the statement
of comprehensive income.
Land
Land is initially recognised at cost. Land has an unlimited useful life and is therefore not depreciated. If
the cost of land includes the costs of site dismantlement, removal and restoration, that cost portion of
the land asset is depreciated over the period which
it is considered that the Group will gain benefits by
incurring those costs.
Construction in progress
Construction-in-progress comprises costs directly
related to construction of property plant and equipment including an appropriate allocation of directly
attributable variable overheads that are incurred in
construction. If construction-in-progress is related
to qualified assets, cost also includes finance costs
capitalised during the exploration, development
and construction periods where such costs are financed by borrowings. Depreciation and depletion
of these assets commences when commercial use of
the related assets has commenced.
Intangible assets
Intangible assets with finite useful lives that are acquired separately are carried at cost less accumulated amortisation and accumulated impairment
losses. Amortisation is recognised on a straight-line
basis over their estimated useful lives. The estimated useful life and amortisation method are reviewed
at the end of each reporting period, with the effect
of any changes in estimate being accounted for on a
prospective basis. The estimated useful lives for the
different groups of intangible fixed assets are:
Land rights
Software
1–49 years
5 years
Depending on when the contracts for land usage
rights are acquired or taken control of the remaining
useful life varies. The average remaining useful life
for the Group’s land usage rights is 7 years.
AGROKULTURA 29 (i) Impairment of property, plant and equipment
and intangible assets
The Group tests its property, plant and equipment
and intangible assets for possible impairment if, as
a result of an event or changed circumstance, there
is an indication that the assets’ carrying amount cannot be justified by comparing the carrying amount
of the asset to their respective recoverable amount.
When it is not possible to estimate the recoverable
amount of an individual asset, the Group estimates
the recoverable amount of the cash-generating unit
to which the asset belongs.
The recoverable amount is the higher of fair
value less cost to sell and value in use. If the recoverable amount of an asset (or cash-generating unit) is
estimated to be less than its carrying amount, the
carrying amount of the asset (or cash-generating
unit) is reduced to its recoverable amount. An impairment loss is recognised in the statement of comprehensive income immediately.
Where an impairment loss subsequently reverses, the carrying amount of the asset (or cash-generating unit) is increased to the revised estimate of
its recoverable amount, but only to the extent that
the increased carrying amount does not exceed the
original carrying amount that would have been determined had no impairment loss been recognised
in prior periods. A reversal of an impairment loss is
recognized in the profit or loss.
(j) Biological assets and agriculture
Agricultural activity is defined by the management
as the biological transformation of biological assets
for sale into agricultural produce or into additional
biological assets. Agricultural produce is defined
as the harvested product of the Group’s biological
assets and a biological asset is defined as a living
animal or plant. The Group has determined the
groups of its biological assets to be livestock (bearer
biological assets) and growing crops (consumable
biological assets).
Biological assets are measured on initial recognition and at each reporting date at its fair value less
estimated point-of-sale cost, except for the case
where the fair value cannot be measured reliably on
initial recognition. Agricultural produce harvested
from the Group’s biological assets is measured at
its fair value less estimated point-of-sale costs at
the point of harvest and is subsequently recorded
as inventories.
ANNUAL REPORT 2014
Notes to the Group statements
If an active market exists for a biological asset or
agricultural produce, the quoted price in that market is the appropriate basis for determining the fair
value of that asset. If an active market does not exist
the most recent market transaction price or the forecast from the independent advisor is used in determining fair value. Cost is used as an approximation
of fair value when little biological transformation has
taken place since initial cost incurrence, e.g. within
short time after seeding the crop.
A gain or loss arising on initial recognition of a
biological asset at fair value less estimated pointof-sale costs and from a subsequent change in fair
value less estimated point-of-sale costs of a biological asset is included in profit or loss for the period
in which it arises as “Gain or loss on biological assets”. The biological assets are recorded as current
and non-current biological assets based on the operational cycle of the respective biological assets.
In general, biological assets growing crops are recognised as current assets, because the operational
cycle is less than 12 months. Dairy herd is recorded
as non-current biological assets because the operational cycle lasts more than 12 months.
Livestock and dairy herd
Livestock are measured at their fair value less estimated point-of-sale costs. The fair value of livestock
is determined based on the quoted prices on active
markets for producing and non-producing livestock
and deems this to represent fair value.
Crops – cereals and grassland
Crops are measured at their fair value less estimated
point-of-sale costs. At initial recognition (after seeding) the crops are measured at cost as the marketdetermined values are not available for such biological assets. The crops are measured at fair value once
the biological transformation started and the fair
value becomes reliably measurable.
The Group recognises fallow land costs related
to the next period seeding at the amount of expenses incurred to date on the balance sheet as a part of
biological assets.
(k) Accounting for government grants
An unconditional government grant related to a
biological asset is recognized as income when, and
only when, the government grant is paid. If a government grant related to a biological asset is condi-
AGROKULTURA 30 tional, including where a government grant requires
an enterprise not to engage in specified agricultural
activity, the grant is recognized as income when, and
only when, the conditions attached to the government grant are met.
Government grants, related to assets other
than biological assets, are recognised as deferred
income and released to the statement of comprehensive income over the expected useful life of the
related asset.
Interest expense is presented net of subsidies in
the statement of comprehensive income. Subsidies
on the loss of harvest decrease the amount of the
related losses included to other operating expenses
in the statement of comprehensive income.
(l) Inventories
Agricultural produce following harvest is classified
as inventories. The initial cost of the agricultural produce is equal to the fair value of biological assets at
the time of harvest.
Inventories are measured at the lower of cost
and net realisable value. If net realizable value is less
than the cost of inventory, the carrying amount is reduced to the net realizable value and the difference
is recognized in the statement of comprehensive
income as loss from impairment of inventories. Net
realisable value is the fair value of inventories (when
an active market exists) which can be obtained from
open sources, less the estimated costs to sell.
If no active market for inventories exists, a professional appraisal of the most significant items of
the inventories is made to determine the net realizable value.
The cost of inventories (which are not agricultural produce) is based on the weighted average principle and comprises all costs of purchase, costs of
conversion and other costs incurred in bringing the
inventories to their present location and condition.
(m) Financial assets and liabilities
Financial instruments recognised in the Group’s
statement of financial position include investments,
loans and promissory notes receivable, trade and
other receivables, cash and cash equivalents, borrowings and promissory notes payable, trade and
other payables. Financial instruments are initially
measured at cost, including transaction costs, when
the Group has become a party to the contractual arrangement of the instrument.
ANNUAL REPORT 2014
Notes to the Group statements
Financial assets, other than those at fair value
through profit or loss (FVTPL), are assessed for indicators of impairment at the end of each reporting period. Financial assets are considered to be
impaired when there is objective evidence that, as
a result of one or more events that occurred after
the initial recognition of the financial asset, the estimated future cash flows of the investment have
been affected.
For available for sale (AFS) equity investments, a
significant or prolonged decline in the fair value of
the security below its cost is considered to be objective evidence of impairment.
For all other financial assets, objective evidence
of impairment could include:
■■ Significant financial difficulty of the issuer or
counterparty; or
■■
Breach of contract, such as a default or delinquency in interest or principal payments; or
■■
It becoming probable that the borrower will enter bankruptcy or financial re-organisation; or
■■
The disappearance of an active market for that
financial asset because of financial difficulties.
A financial instrument or a portion of a financial instrument is derecognised, when the Group loses
its contractual rights or extinguishes the obligation
associated with such an instrument. On de-recognition of a financial asset, the difference between the
proceeds received or receivable and the carrying
amount of the asset is included in the statement of
comprehensive income.
On de-recognition of a financial liability the difference between the carrying amount of the liability
extinguished or transferred to another party and the
amount paid is included in the statement of comprehensive income.
Investments
The Group classifies its investments in marketable
debt, equity securities, and investments in unlisted
equity securities, into three categories, being, trading, held-to-maturity and available-for-sale. Investments acquired principally for the purpose of generating a profit from short-term fluctuations in price are
classified as trading investments and are therefore
fair valued through the income statement and presented as current assets. Investments with fixed maturity, which management has the intent and ability
AGROKULTURA 31 to hold to maturity, are classified as held-to-maturity,
to be disclosed in non-current assets. Investments in
listed and unlisted shares as well as payment-in-kind
(PIK) notes are classified as available-for-sale. Management determines the classification of its investments at the time of the purchase and re-evaluates
such designation on a regular basis.
Available-for-sale investments are initially recognised at fair value and subsequent gains and losses
are booked to equity in other comprehensive income and, when they are sold, the accumulated fair
value adjustments are then included in the income
statement. The values of all investments for which
the market value has been below the carrying value
for more than a year are reviewed at least annually
for impairment. If management believes that the diminuation of value is permanent, then that part of
the fair value reserve represented by the impairment
is transferred to the income statement.
Loans given and receivables
Loans, accounts receivable, and other receivables
are initially recognised at their fair value and subsequently at their amortised cost less any bad debt
allowances made. Provisions for probable bad debt
losses/uncertain receivables are made after an individual evaluation of each customer based on ability
to pay, anticipated future risk and the value of any
guarantees received.
Objective evidence for making provision could
include:
■■ Significant financial difficulty of the counterparty;
■■
Breach of contract, such as a default or delinquency in interest or principal payments;
■■
It becoming probable that the counterparty will
enter bankruptcy or financial reconstruction.
Cash and cash equivalents
Cash and cash equivalents comprise cash balances,
bank deposits as well as short term highly liquid investments with maturities of 90 days or less, which
are readily convertible to known amounts of cash
and are subject to an insignificant risk of changes in
value. Short term investments consist of investments
with a maturity of more than 90 days.
ANNUAL REPORT 2014
Notes to the Group statements
Borrowings
Loans and borrowings are initially recognised at fair
value, which is the equivalent of proceeds received
less any transaction costs, and subsequently at
amortised cost. Premiums or discounts at the time
a loan is issued are recognised over the period of
the loan using the effective interest method in net
financial items in the statement of comprehensive
income.
Accounts payable
Accounts payable and other payables are initially
recognised at fair value and subsequently at amortised cost using the effective interest method.
Employee benefits
In Russia and Ukraine the Group pays contributions to the State Pension Fund of the respective
countries. The Group has determined that these
constitute defined contribution plans since the only
obligation of the Group is to pay in the periods in
which they arise. Contributions are recognised as an
expense in the statement of comprehensive income
in the respective period.
(o) Taxes
The current tax expense is calculated applying the
tax rules that are enacted or practically enacted as
of the closing date in the countries where the parent
company, its subsidiaries and associated companies
operate and generate taxable income. Management assesses on a regular basis the claims made
in income tax returns with respect to the situations
where applicable tax rules are subject to interpretation and, if it is deemed necessary, makes provisions
for probable payments to the tax authorities.
Deferred tax is accounted for in accordance with
the balance sheet method on all temporary differences between the tax and book values of all assets and liabilities. Deferred tax is not recognised,
however, if it arises as a result of a transaction that
is the initial recognition of an asset or liability that
is not a business combination and that, at the time
of the transaction, affects neither the book nor the
tax base. Deferred income tax is calculated using
the tax rates (and rules) that have been decided or
announced as of the closing date and that are expected to be in effect when the deferred tax asset
or liability is settled. Deferred tax is recognised in
AGROKULTURA 32 the profit or loss, except when the tax effect is attributable to items recognised in other comprehensive income or directly in equity. In these cases the
deferred tax effect is recognised together with the
underlying item in other comprehensive income or
directly in equity. Deferred tax assets are recognised
to the extent it is probable that future taxable profits
will be available against which the temporary differences can be used.
Deferred tax is calculated on temporary differences that arise in interests in subsidiaries and associated companies, except when the timing of the
reversal of the temporary difference cannot be controlled by the Group and it is likely that the temporary difference will not be reversed within the foreseeable future.
(p) Revenue recognition
Sales comprise agriculture produce, other products,
raw materials and services less indirect sales tax and
discounts, and are adjusted for exchange differences on sales in foreign currency. Sales are recognised after the Group has transferred the risks and
rewards of ownership to the buyer and the Group
retains neither a continuing right to dispose of the
goods, nor effective control of those goods; usually,
this means that sales are recorded upon delivery
of goods to customers in accordance with agreed
terms of delivery.
(q) Provisions
Provisions for restoration of the environment, restructuring costs and legal claims are recognised
when the Group has a legal or informal obligation as
a result of a previous event, it is likely that an outflow
of economic resources will be required to settle the
obligation and a reliable estimate of the amount can
be made. Restructuring provisions are costs for terminations of leasing contracts and redundancy payments. Provisions are not made for future operating
losses.
If there are several similar obligations, the probability of outflow of economic resources at the settlement of these obligations is assessed for the obligations as a group. A provision is recognised even if
the probability for an outflow of economic resources
for a particular item in the group of obligations is
remote.
The provisions are carried at the present value of
the amount that is expected to be required to settle
ANNUAL REPORT 2014
Notes to the Group statements
the obligation. A discount rate before tax reflecting
the current market assessment of the time value of
money and the risks associated with the provision is
used. An increase in a provision due to the passage
of time is accounted for as interest expense.
(r) Interest expenses
Interest on borrowings related to major qualifying
capital projects under construction is capitalised
during the construction period in which they are incurred. Interest on borrowings related to operating
activities is expensed in the statement of comprehensive income as and when incurred.
(s) Leases
Leases where a significant portion of the risks and
rewards associated with ownership are retained by
the lessor are classified as operating leases. Payments made during the lease period (less any incentives from the lessor) are expensed in the statement
of comprehensive income on a straight line basis
over the term of the lease.
Finance leases, which transfer to the Group
substantially all the risks and benefits incidental to
ownership of the leased item, are capitalised at the
commencement of the lease at the fair value of the
leased property or, if lower, at the present value of
the minimum lease payments. Lease payments are
apportioned between finance charges and reduction of the lease liability so as to achieve a constant
rate of interest on the remaining balance of the liability. Finance charges are recognised in the statement of comprehensive income.
Leased assets are depreciated over the useful
life of the asset. However, if there is no reasonable
certainty that the Group will obtain ownership by the
end of the lease term, the asset is depreciated over
the shorter of the estimated useful life of the asset
and the lease term.
(t) Earnings per share
Basic earnings per share, applicable to owners of
the parent, is calculated by dividing the net profit attributable to shareholders by the weighted average
number of ordinary shares in issue during the year,
excluding ordinary shares purchased by the Group
and held as treasury shares. Diluted earnings per
share is computed by applying the “treasury stock”
method, under which earnings per share data is
computed as if the warrants and options were exer-
AGROKULTURA 33 cised at the beginning of the period, or if later, on
issue and as if the funds obtained thereby were used
to purchase common stock at the average market
price during the period. In addition to the weighted average number of shares outstanding, the denominator includes the incremental shares obtained
through the assumed exercise of the warrants and
options.
The assumption of exercise is not reflected in
earnings per share when the exercise price of the
warrants and options exceeds the average market
price of the common stock during the period. The
warrants and options have a dilutive effect only
when the average market price of the common
stock during the period exceeds the exercise price
of the warrants and options.
(u) Non-current assets held for sale and discontinued operations
Non-current assets and disposal groups are classified as held for sale if their carrying amount will
be recovered principally through a sale transaction
rather than through continuing use. This condition is
regarded as met only when the sale is highly probable and the non-current asset (or disposal group)
is available for immediate sale in its present condition. Management must be committed to the sale,
which should be expected to qualify for recognition
as a completed sale within one year from the date
of classification.
When the Group is committed to a sale plan involving loss of control of a subsidiary, all of the assets and liabilities of that subsidiary are classified as
held for sale when the criteria described above are
met, regardless of whether the Group will retain a
non-controlling interest in its former subsidiary after
the sale.
Non-current assets (and disposal groups) classified as held for sale are measured at the lower of
their previous carrying amount and fair value less
costs to sell.
A disposal group qualifies as discontinued operation if it is:
■■ A component of the Group that is a CGU or a
group of CGUs
■■
Classified as held for sale or distribution or already disposed in such a way, or
■■
A major line of business or major geographical
area
ANNUAL REPORT 2014
Notes to the Group statements
Discontinued operations are excluded from the results of continuing operations and are presented as
a single amount as profit or loss after tax from discontinued operations in the statement of profit or
loss.
Notes to the financial statements mainly include
amounts for continuing operations, unless otherwise
mentioned.
(v) Fair value measurement
The Group measures its biological assets at fair value at each balance sheet date.
Fair value is the price that would be received
to sell an asset or paid to transfer a liability in an
orderly transaction between market participants at
the measurement date. The fair value measurement
is based on the presumption that the transaction
to sell the asset or transfer the liability takes place
either:
■■ In the principal market for the asset or liability, or
■■
In the absence of a principal market, in the most
advantageous market for the asset or liability
The principal or the most advantageous market must
be accessible by the Group. The fair value of an asset or a liability is measured using the assumptions
that market participants would use when pricing the
asset or liability, assuming that market participants
act in their economic best interest.
A fair value measurement of a non-financial asset
takes into account a market participant’s ability to
generate economic benefits by using the asset in its
highest and best use or by selling it to another market participant that would use the asset in its highest
and best use.
The Group uses valuation techniques that are
appropriate in the circumstances and for which sufficient data are available to measure fair value, maximising the use of relevant observable inputs and
minimising the use of unobservable inputs.
All assets and liabilities for which fair value is
measured or disclosed in the financial statements
are categorised within the fair value hierarchy, described as follows, based on the lowest level input
that is significant to the fair value measurement as
a whole:
■■ Level 1 — Quoted (unadjusted) market prices in
active markets for identical assets or liabilities
AGROKULTURA 34 ■■
Level 2 — Valuation techniques for which the lowest level input that is significant to the fair value
measurement is directly or indirectly observable
■■
Level 3 — Valuation techniques for which the
lowest level input that is significant to the fair
value measurement is unobservable
For assets and liabilities that are recognised in the
financial statements on a recurring basis, the Group
determines whether transfers have occurred between Levels in the hierarchy by re-assessing categorisation (based on the lowest level input that is
significant to the fair value measurement as a whole)
at the end of each reporting period.
The Group uses valuation models (which are described in further detail in the biological asset note)
to value its biological assets at each reporting date.
The assumptions used in these valuation models are
discussed internally with heads of production and
the Group and Country Managing Directors before
presenting the valuation results to the audit -committee and independent auditors.
3.ESTIMATES AND JUDGEMENTS
The preparation of Consolidated Financial Statements conforming to IFRS requires management
to make estimates and assumptions that affect the
reported amounts of assets and liabilities, the disclosure of contingent assets and liabilities at the
dates of the financial statements and the reported
amounts of revenues and expenses during the period. The estimates are based on historical experience and various other assumptions that are believed to be reasonable, though actual results and
timing could differ from the estimates. Management
believes that the accounting policies below represent those matters requiring the exercise of judgement where a different opinion could result in the
substantial changes to reported results.
a. Useful life of property, plant and equipment
For material property, plant and equipment in an
acquisition, an external advisor makes a fair valuation of the acquired fixed assets and assists in determining their remaining useful lives. Management
believes that the assigned values and useful lives,
as well as the underlying assumptions, are reasonable, though different assumptions and assigned
lives could have a significant impact on the reported
amounts.
ANNUAL REPORT 2014
Notes to the Group statements
b. Impairment
The Group reviews the carrying amounts of its property, plant and equipment and intangible assets to
determine whether there is any indication that those
assets are impaired. In making the assessment for
impairment, assets that do not generate independent cash flows are allocated to an appropriate cashgenerating unit. Management necessarily applies
its judgment in allocating assets that do not generate independent cash flows to appropriate cashgenerating units, and also in estimating the timing
and value of underlying cash flows within the value
in use calculation. Subsequent changes to the cashgenerating unit allocation or to the timing of cash
flows could impact the carrying value of the respective assets.
c. Fair value of land usage rights
The Group’s agricultural land usage activity is subject to various laws and regulations governing the
protection of the environment. The Group estimates
fair value of land usage rights at the moment of acquisition of subsidiaries, which has operational land
lease agreements, based on the management’s understanding of the current legal requirements in the
various jurisdictions, terms of the land lease agreements and internally generated estimates.
d. Biological assets
Under IAS 41, the Group’s biological assets are
measured at fair value less point-of-sale costs at
each reporting date. Due to the specifics of the agricultural production, fair value of some crops and animals cannot be determined reliably in their present
status. In addition to that, the biological assets in
the countries where the Group operates are not frequently traded on active market. Therefore the fair
value is determined using the alternative methods.
The use of alternative methods of fair value estimation requires management to refer to latest transactions or use price averages and price forecasts prepared by independent advisors.
AGROKULTURA 35 e. Net realisable value and fair value less costs
to sell of inventories
The Group has its agricultural produce in inventory
as of the year end. The agricultural produce has
been valued at the point of harvest at its fair value
less costs to sell. The fair value of the grain is determined based on the market reports of independent
market analysts and market statistics published by
Ministries of Agriculture of Russia and Ukraine. Then
inventory are impaired to net realisable value at the
reporting date if the prices have fallen since point of
harvest. The net realisable value is estimated based
on the available data from the sources mentioned
above and management’s estimate on future probable sales prices.
f. Tax risk
A high degree of estimation is involved in determining the provisions needed for income tax. There are
many transactions and calculations where the final
tax is not known with certainty at the time of the
transactions and calculations are made. The Group
recognises liabilities for anticipated tax audit issues
based on estimates of whether additional taxes will
be due. Where the final tax outcome of these matters is different from the amounts that were initially
recorded, such differences will impact the amount of
current and deferred tax provisions in the period in
which such determination is made.
g. Contingencies
By their nature, contingencies will only be resolved
when one or more future events occur or fail to occur. The assessment of such contingencies inherently involves the exercise of significant judgement and
estimates of the outcome of future events.
4.SEGMENT INFORMATION
The business is managed, and reports internally,
principally on a geographical basis with the exception to this being it’s livestock operations which are
managed and reported separately to the arable
farming business. This basis has been used to determine the Group’s operating segments.
ANNUAL REPORT 2014
Notes to the Group statements
Russia
CBS
Kaliningrad
arable
221,748
14,424
84,377
(221,068)
99,481
12,040
–
(3,255)
(20,433)
(11,648)
268,157
(1)
67,193
(244,284)
91,065
Distribution costs
Other income
Other expense
Intersegment costs
Administration expenses
Exceptional items
Operating profit
(1,538)
6,135
(24,585)
(16,047)
(22,419)
–
41,027
(337)
118
(9,308)
(97)
(214)
–
(21,486)
Intersegment finance income
Intersegment finance cost
Finance income
Finance expense
Profit before tax
1,922
(11,731)
497
(8,422)
23,293
Assets
Liabilities
Net assets
SEK Thousands
Year ended 31 December 2014:
External revenue
Intersegment revenue
Gain or loss on bio assets
Cost of sales
Gross profit
SEK Thousands
Year ended 31 December 2013:
External revenue
Intersegment revenue
Gain or loss on bio assets
Cost of sales
Gross profit
Segment Managetotal
ment
Eliminations
Total
Group
47,933
337
8,825
(43,880)
13,215
549,878
14,760
157,140
(529,665)
192,113
1,546
5,040
–
(4,402)
2,184
(12,040)
(19,800)
3,255
20,433
(8,152)
539,384
–
160,395
(513,634)
186,145
(13,065)
490
(34,124)
(1,952)
(19,205)
–
23,209
(64)
1,187
(935)
(1,702)
(2,141)
–
9,560
(15,004)
7,930
(68,952)
(19,798)
(43,979)
–
52,310
–
67
(3,001)
–
(19,297)
4,206
(15,841)
337
(118)
9,308
19,798
214
–
21,387
(14,667)
7,879
(62,645)
–
(63,062)
4,206
57,856
667
(3,576)
–
(79)
(24,474)
–
(16,565)
122
(7,391)
(625)
–
(862)
2
2,564
11,264
2,589
(32,734)
621
(13,328)
9,458
30,143
–
16
(3,362)
10,956
(32,732)
32,734
–
79
21,468
–
–
637
(16,611)
41,882
464,407
(61,814)
402,593
9,575
(2,798)
6,777
317,389
(77,761)
239,628
96,989
(29,668)
67,321
888,360
(172,041)
716,319
16,940
(8,922)
8,018
(9,575)
2,798
(6,777)
895,725
(178,165)
717,560
Russia
CBS
arable
Kaliningrad
arable
Ukraine
Segment Managearable Livestock
total
ment
Eliminations
Total
Group
239,160
23,401
33,186
(258,237)
37,510
41,440
–
(14,418)
(38,428)
(11,406)
(54,472)
(36,173)
13,512
47,604
(29,529)
617,393
–
(30,701)
(648,833)
(62,141)
Ukraine Livestock
334,798
2,660
(76,641)
(335,425)
(74,608)
56,078
1,050
13,660
(61,884)
8,904
671,476
27,111
(44,213)
(693,974)
(39,600)
389
9,062
–
(2,463)
6,988
Distribution costs
Other income
Other expense
Intersegment costs
Administration expenses
Exceptional items
Operating profit
(3,888)
7,539
(15,084)
(12,292)
(28,092)
6,617
(7,690)
(204)
(19,403)
1,836
72
2,330
(23,708)
(556)
(4,669)
(514)
(38,555)
(13,071)
5,131
(21,585) (155,740)
(56)
(23,551)
5,156
14,603
(707)
(37,169)
(18,654)
(36,171)
(2,756)
(69,917)
(5,052)
(6,375)
(13,165) (198,180)
–
–
(356)
–
(36,981)
727
(29,622)
212
(23,339)
(3,137)
11,466
(1,967)
(39,492)
36,171
–
581 (106,317)
–
(5,648)
2,331 (225,471)
Intersegment finance income
Intersegment finance cost
Finance income
Finance expense
Profit before tax
18,438
(15,275)
306
(5,045)
(9,266)
18,211
–
(5,891)
(13,916)
74
44
(1,515)
(8,136)
(10,706) (177,748)
–
36,649
(855)
(35,937)
–
424
(5,038)
(19,734)
(19,058) (216,778)
33,846
(34,560)
(5)
(3,954)
(34,295)
(70,495)
–
70,497
–
(74)
345
1,515
(22,173)
3,774 (247,299)
Assets
Liabilities
Net assets
584,733
(65,368)
519,365
132,257 1,218,514
(49,862) (247,227)
82,395 971,287
26,801
(57,058)
(30,257)
(98,341) 1,146,974
9,997 (294,288)
(88,344) 852,686
94,148
(9,985)
84,163
AGROKULTURA 407,376
(122,012)
285,364
36 ANNUAL REPORT 2014
Notes to the Group statements
The following table shows the geographical split of revenue and net assets for items based outside the parent
companies country of domicile. The revenue information is based on the registration country of the customer.
SEK thousands
Russia
Ukraine
31 December 2014
External revenue
Net assets
281,721
476,691
268,157
239,628
31 December 2013
External revenue
Net assets
336,678
685,923
334,798
285,364
No single customer represented greater than 10% of revenue
5.REVENUE
Year ended
31 December 2014
Year ended
31 December 2013
128,747
95,624
59,366
121,092
6,989
50,360
20,800
2,558
82
–
463
486,081
127,473
151,795
31,937
103,782
20,892
98,240
18,811
12,772
66
41
142
565,951
Livestock revenue
Milk
Meat
Other livestock sales
Total livestock revenue
43,555
5,588
48
49,191
37,987
8,896
–
46,883
Other goods sold
Other services provided
2,680
1,432
666
3,893
539,384
617,393
SEK Thousands
Crop revenue
Rapeseed
Wheat
Barley
Sunflower
Soya
Corn
Sugarbeet
Buckwheat
Oats
Rye
Other crops
Total crop revenue
Total revenue
AGROKULTURA 37 ANNUAL REPORT 2014
Notes to the Group statements
6.COST OF SALES
SEK thousands
Year ended
31 December 2014
Year ended
31 December 2013
54,254
66,680
48,407
24,901
63,234
67,776
44,557
36,472
44,478
3,700
21,624
837
63,072
(26,358)
513,634
47,553
89,908
69,980
30,196
68,595
92,978
40,720
46,527
56,477
(160)
24,573
8,817
93,670
(21,001)
648,833
Year ended
31 December 2014
Year ended
31 December 2013
7,334
67
478
7,879
11,466
–
–
11,466
Seed
Fertilisers
Chemicals
Animal feed, medicine and genetics
Fuel
Salaries
External harvest costs
Spare parts and maintenance services
Land costs
Agricultural VAT & export VAT
Other production costs
Inventory provisions
Depreciation and amortisation
Movement in inventory and biological assets
Total cost of sales
7. OTHER INCOME
SEK thousands
Government grants
Other gains and losses
Insurance receipts
Total other income
Governmental grants and subsidies amounting to
SEK 7,334 thousand (2013: SEK 11,466 thousand)
were received in Russia for the purchase of heifers,
seeds, fertilizers and other materials for crop production. These grants are related to biological assets and recognized as income according to IAS 41.
There are no unfulfilled conditions or contingencies
attached to these grants. The Group also receives
interest rate subsidies to compensate for bank interest charges. These subsidies have been netted in
the income statement with finance costs.
8. OTHER EXPENSE
SEK thousands
Year ended
31 December 2014
Year ended
31 December 2013
3,246
734
3,334
55,338
(7)
62,645
29,399
6,755
1,786
2,038
(486)
39,492
Loss on disposal of property plant and equipment
Bad debt provisions and write downs
Fines and penalties
Foreign exchange loss
Other operating expenses
Total other expenses
AGROKULTURA 38 ANNUAL REPORT 2014
Notes to the Group statements
9. ADMINISTRATIVE EXPENSES
SEK thousands
Year ended
31 December 2014
Year ended
31 December 2013
37,381
183
4,741
328
1,364
2,571
–
2,951
3,314
5,175
209
1,152
2,219
1,474
63,062
53,954
296
8,373
395
1,869
3,791
14,230
5,739
3,816
6,771
257
1,275
2,775
2,776
106,317
Salaries and taxes
Other staff costs
Travel and transport
Public relations
Communication
Office costs
Management fees
Audit
Legal
Other professional
Listing costs
Bank charges
Other
Depreciation and amortisation
Total administrative expenses
10.AUDIT FEES
Fees for audit assignments and other assignments expensed during the year from the Company’s auditors
are as follows:
SEK thousands
Year ended
31 December 2014
Year ended
31 December 2013
2,491
235
209
16
2,951
2,440
2,186
1,507
7
6,140
–
–
(401)
(401)
Year ended
31 December 2014
Year ended
31 December 2013
–
–
23,889
102
85
(19,870)
4,206
3,856
1,456
(19,255)
–
–
8,295
(5,648)
Paid to Ernst & Young
Audit Assignment
Audit work not related to ordinary audit assignment
Tax advice
Other assignments
Total
Paid to Deloitte
Audit Assignment
Total
11.EXCEPTIONAL ITEMS
SEK thousands
Profit on disposal of Ukrainian farms
Profit on disposal of Russia CBS farms
Profit / (loss) on disposal of Kaliningrad farms
Profit on liquidation of other entities
Other items
Currency translation (loss) / profit on disposal of entities
Total
During 2013 and 2014 the Group has been in a process of disposing of its entire operations in Kaliningrad resulting in a profit of SEK 23,889 thousand
in 2014 (2013: loss SEK 19,255 thousand). Currency
translation losses of SEK 19,870 thousand on these
AGROKULTURA 39 foreign investments were realised upon disposal of
the assets in Kaliningrad and liquidation of other
Group companies and therefore transferred from
the foreign currency translation reserve to the income statement.
ANNUAL REPORT 2014
Notes to the Group statements
12.FINANCE INCOME
SEK thousands
Year ended
31 December 2014
Year ended
31 December 2013
Interest income
Total
637
637
345
345
Year ended
31 December 2014
Year ended
31 December 2013
21,609
3,650
(8,648)
16,611
22,770
4,151
(4,748)
22,173
13.FINANCE EXPENSE
SEK thousands
Interest expense
Finance lease expense
Less interest rate subsidies
Total
Subsidies amounting to SEK 8.6 million (2013: SEK 4.7 million) were received in Russia to compensate for bank
interest charges. These subsidies have been netted in the income statement with finance costs.
14.INCOME TAX
Year ended
31 December 2014
Year ended
31 December 2013
(1,043)
(1,043)
(2,927)
(2,927)
Deferred tax (expense) / benefit origination and reversal
Total deferred tax (expense) / benefit
2,345
2,345
(7,524)
(7,524)
Total tax (expense) / benefit
1,302
(10,451)
Tax expense in the income statement includes:
Tax (expense) / benefit on continuing operations
Tax (expense) / benefit on discontinued operations
Total tax income / (expense)
2,138
(836)
1,302
(9,491)
(960)
(10,451)
41,882
(21,468)
20,414
(247,299)
(3,774)
(251,073)
(4,083)
(115,946)
278,719
(569)
(156,819)
1,302
50,215
16,638
–
(36,542)
(40,762)
(10,451)
SEK thousands
A. Tax charged to the income statement
Current tax (expense) / income
Total current tax
Reconciliation of total tax charge
Result from continuing operations before tax
Result from discontinued operations before tax
Accounting profit before income tax
Tax benefit / (expense) calculated at Russian tax rate of 20%
Impact of specific tax rates
Non-taxable income
Tax losses not recognised as deferred tax assets
Expenses not deductible for tax purposes
Income tax benefit / (expense) at effective rate
AGROKULTURA 40 ANNUAL REPORT 2014
Notes to the Group statements
The Group has unused tax losses in several nonoperating holding and management companies for
which no deferred tax asset has been recognised.
The total unrecognised deferred tax asset amounts
to SEK 21,441 thousand (2013 SEK 28,744 thousand).
The Groups operations in Russia and Ukraine benefit from special taxation rules for agricultural entities.
Operating entities which meet the requirements of
these schemes benefit from a 0% tax rate in Russia
and a low level of tax in Ukraine which is determined
based on the number of hectares of land farmed.
The Groups deferred tax assets are made up of the following:
SEK thousands
PP&E
Balance at 31 December 2012
Charge to income statement due to recognition /
reversal of temporary differences
Effect of translation
Balance at 31 December 2013
Charge to income statement due to changes in tax rates
Charge to income statement due to recognition /
reversal of temporary differences
Effect of translation
Balance at 31 December 2014
SEK thousands
AGROKULTURA Total assets
111
640
18,409
(9,763)
1,369
(493)
19,889
(9,616)
(1)
750
81
(618)
(957)
7,689
84
6,814
(44)
832
–
(112)
(1,002)
9,271
165
6,084
(213)
–
(3,438)
11,149
(305)
415
(3,956)
11,564
Deferred tax liabilities
Biological assets
Other
Total liabilities
PP&E
Balance at 31 December 2012
Charge to income statement due to recognition /
reversal of temporary differences
Effect of translation
Balance at 31 December 2013
Charge to income statement due to recognition /
reversal of temporary differences
Effect of translation
Balance at 31 December 2014
Deferred tax assets
Tax losses
Other
–
–
–
(421)
(857)
730
(857)
309
–
–
(3,724)
1
(420)
301
38
(89)
89
39
(509)
(3,334)
540
(3,184)
120
–
–
–
660
(3,183)
41 ANNUAL REPORT 2014
Notes to the Group statements
15.PROPERTY, PLANT AND EQUIPMENT
SEK thousands
Buildings
Land
Agricultural
equipment
Construction
in progress
Vehicles
and unand other
installed
assets
equipment
Total
Cost or valuation
At 31 December 2012
Additions
Transfers from land in process of
registration
Transfers
Disposals
Disposal of subsidiaries
Effect of translation
At 31 December 2013
Additions
Transfers
Disposals
Effect of translation
At 31 December 2014
172,217
4,303
–
205,315
7,163
11,643
343,108
10,114
–
144,208
1,195
–
27,245
7,708
–
892,093
30,483
11,643
10,793
(594)
(600)
(7,814)
178,305
15
3,337
(1,027)
(60,428)
120,202
–
(464)
–
(15,057)
208,600
9,618
–
(3)
(65,507)
152,708
3,502
(13,598)
(355)
(18,172)
324,599
31,518
272
(13,720)
(109,482)
233,186
674
(17,378)
(291)
(1,959)
126,449
605
8,465
(1,841)
(47,802)
85,876
(14,969)
(2,145)
(388)
(680)
16,771
9,408
(12,073)
(911)
(5,223)
7,971
–
(34,179)
(1,634)
(43,682)
854,724
51,164
–
(17,502)
(288,443)
599,943
Depreciation & impairment
At 31 December 2012
Depreciation for period
Transfers
Disposals
Disposal of subsidiary
Effect of translation
At 31 December 2014
Depreciation for period
Transfers
Disposals
Effect of translation
At 31 December 2014
(15,918)
(8,845)
(584)
291
149
447
(24,460)
(7,550)
58
195
9,390
(22,367)
–
–
–
–
–
–
–
(32,677)
(16,543)
(418)
2,555
118
3,730
(43,235)
(11,982)
(2,614)
674
17,664
(39,493)
–
–
–
–
–
–
–
(11)
–
(146,683)
(43,159)
1,002
12,903
–
18,634
(157,303)
(38,374)
2,367
8,011
57,241
(128,058)
3
(8)
(195,278)
(68,547)
–
15,749
267
22,811
(224,998)
(57,916)
(189)
8,880
84,297
(189,926)
Accumulated depreciation
At 31 December 2013
At 31 December 2014
(24,460)
(22,367)
–
–
(157,303)
(126,169)
(43,235)
(39,405)
–
–
(224,998)
(189,926)
–
–
–
–
–
(1,889)
–
(88)
–
(8)
–
–
153,845
97,835
208,600
152,708
167,296
105,128
83,214
46,383
16,771
7,963
629,726
410,017
Accumulated impairment
At 31 December 2013
At 31 December 2014
Net book value
At 31 December 2013
At 31 December 2014
Leased property plant and equipment
Agricultural machinery includes equipment purchased on finance lease with a net book value of
SEK 33,687 thousand (2013: SEK 43,693 thousand).
The leases are classified as finance lease because
the ownership of the leased assets passes to the
Group at the end of lease term.
AGROKULTURA 42 Pledged assets
As of 31 December 2014 farming equipment, storage
facilities and land with a book value of SEK 179,717
thousand (2013: SEK 205,323 thousand) were pledged
as security for the Groups bank loans. All the expenses related to property maintenance are borne by the
Group. The Group is required to insure the pledged
ANNUAL REPORT 2014
Notes to the Group statements
property. The type, amount and term of insurance
shall meet pledge holders requirements. The pledge
holders have an obligation to return the securities to
the Group. There are no other significant terms and
conditions associated with the pledges.
Contractual commitments
As at 31 December 2014 the Group has made contractual commitments to purchase property plant
and equipment amounting to SEK 2,244 thousand
(2013: SEK 6,939 thousand).
Co-owned land
As at 31 December 2014 the Group has 13,184 hectares (2013: 20,845 hectares) of land plots with a book
value of SEK 19,943 thousand (2013: SEK 41,058
thousand) which are classified as co-owned. Coowned land plots exist where the Group has less
than 100% ownership of a land plot. The Group has
majority control over co-owned land in most cases.
Co-owners have preferential acquisition rights when
either party wishes to dispose of their share in coowned land.
16.INTANGIBLE ASSETS
SEK thousands
Land usage rights
Other
Total
Cost or valuation
At 31 December 2012
Purchases
Disposals
Disposal of subsidiary
Reclassification to property, plant, and equipment
Currency translation effect
At 31 December 2013
Purchases
Disposals
Currency translation effect
At 31 December 2014
119,103
1,962
(39,588)
(9,153)
24
(1,333)
71,015
10,363
(940)
(27,287)
53,151
1,063
828
(2)
(29)
–
(18)
1,842
292
(5)
(698)
1,431
120,166
2,790
(39,590)
(9,182)
24
(1,351)
72,857
10,655
(945)
(27,985)
54,582
Accumulated amortisation
At 31 December 2012
Amortisation charge
Disposals
Disposal of subsidiary
Currency translation effect
At 31 December 2013
Amortisation charge
Disposals
Currency translation effect
At 31 December 2014
(19,545)
(12,306)
11,995
1,175
481
(18,200)
(6,153)
202
7,443
(16,708)
(460)
(425)
(3)
24
3
(861)
(376)
80
385
(772)
(20,005)
(12,731)
11,992
1,199
484
(19,061)
(6,529)
282
7,828
(17,480)
Accumulated amortisation
At 31 December 2013
At 31 December 2014
(17,135)
(15,967)
(861)
(772)
(17,996)
(16,739)
Accumulated impairment
At 31 December 2013
At 31 December 2014
(1,165)
(742)
–
–
(1,165)
(742)
Net book value
At 31 December 2013
At 31 December 2014
52,815
36,442
981
659
53,796
37,102
AGROKULTURA 43 ANNUAL REPORT 2014
Notes to the Group statements
Intangible fixed assets have determined useful lives
over which they are amortised. Land rights are amortised over the term of the lease, which averages 10
years. If ownership of the land is transferred to the
Group they are reclassified to property, plant and
equipment and included within land which is not
amortised or depreciated. The average amortisation
period for other intangible assets, mainly software,
is 5 years.
Amortisation charges relating to intangible assets is included within cost of sales.
Unclaimed land plots
Included within land usage rights is SEK 2,913
thousand (2013: SEK 4,850 thousand) relating to
amounts paid to acquire land leases on unclaimed
land plots in Russia. Until the legal registration of
the unclaimed land plots is complete, the Group is
only able to sign 11 month lease agreements with
the local authority owners. The Group has received
written assurances from the local authorities that
once registration is complete, 10 year leases will be
signed. The Group therefore amortises these costs
over a 10 year period.
17.FINANCIAL ASSETS
SEK thousands
31 December 2014
31 December 2013
79
–
79
64
11,715
11,779
7,398
333
7,731
2,663
534
3,197
Other non-current financial assets
Deposits
Long term loans and receivables
Total
Current other financial assets
Short term loans
Short term investments
Total
18.BIOLOGICAL ASSETS
The Group has two types of biological assets, cropping and livestock.
Cropping biological assets at year-end are primarily winter wheat and winter rapeseed, which is
presented as current assets in the statement of financial position, as they are normally transferred to
agricultural produce within one year.
Livestock biological assets are animal livestock,
primarily cattle. These normally generate income for
4–8 year periods.
In line with IAS 41 Agriculture, biological assets
are measured on initial recognition and at each reporting date at fair value less estimated point-ofsale costs. Any changes in fair value are recognised
in the statement of comprehensive income in the
year in which they arise.
The fair value of the crops in the fields is calculated using a discounted cash flow method. Potential net yields (based on historical Group yields),
independently (adjusted to local conditions where
necessary) sourced market prices for the time of
delivery, together with expected costs to the point
of harvest, are discounted to give a fair value at the
period end. To the extent that the fair value is in
AGROKULTURA 44 excess or below the costs incurred, there will be a
positive or negative impact in the income statement
line “Gain or loss on biological assets”. The valuation of cropping biological assets are highly sensitive to changes in the market value of the finished
products and harvest yield. The finished products
are principally traded on active markets which have
5 year volatility in excess of 100%. Harvest yields are
sensitive to unpredictable weather. Where available
the Group uses 5 year historic average yields to take
into account this sensitivity.
The fair value of livestock is based on market
prices of livestock of similar age, breed, gender and
genetics. This market price is adjusted to take into
account the age and productivity of individual animals. The valuation of livestock is sensitive to changes in productivity of animals which is measured on a
regular basis.
In accordance with the fair value hierarchy described in note 2v cropping and livestock biological assets are categorised within level 3 at the start
and end of the current and comparative reporting
period. This categorisation is determined as certain
inputs into the fair value calculation are unobservable in active markets.
ANNUAL REPORT 2014
Notes to the Group statements
2012
harvest
2013
harvest
2014
harvest
Fair value at 31 December 2012
3,574
Purchases and costs incurred in production
386
Gain or loss from changes in fair value
651
Change due to harvest
(4,622)
Disposal
–
Currency translation effect
11
Fair value at 31 December 2013
–
Purchases and costs incurred in production
–
Gain or loss from changes in fair value
–
Change due to harvest
–
Disposal
–
Currency translation effect
–
Fair value at 31 December 2014
–
94,603
510,029
(13,985)
(582,616)
(1,937)
(1,378)
4,716
347
(3,929)
(639)
–
(489)
6
–
98,796
(30,069)
–
–
(521)
68,206
366,221
130,852
(541,215)
(747)
(16,143)
7,174
Gains and losses relating to 2012, 2013 harvest have
been realised in full. Gains relating to 2014 harvest
have been realised to the extent that the 2014 harvest has been sold. Gains relating to 2015 harvest
and livestock are unrealised.
2015
harvest
Total current Total non-curbio asset rent bio asset
– Cropping
– Livestock
89,742
24,248
–
–
(19,415)
94,575
98,177
609,211
(43,403)
(587,238)
(1,937)
(1,888)
72,922
456,310
151,171
(541,854)
(747)
(36,047)
101,755
45,461
27,787
12,702
–
(25,103)
(3,446)
57,401
23,035
9,224
–
(18,314)
(20,645)
50,701
Productive cattle with fair value of SEK 16,233
thousand (2013: SEK 22,537 thousand) are pledged
as security for a part of the long-term bank loans of
the Group.
The assumptions used in the calculation of cropping biological assets are as follows:
SEK thousands (where applicable)
31 December 2014
Level 2 assumptions:
Average Russia CBS finished product market value
Average Ukraine finished product market value
Level 3 assumptions:
Average Russia CBS yield (metric tonnes per hectare)
Average Ukraine yield (metric tonnes per hectare)
Factual assumptions:
Hectares cultivated – Russia CBS
Hectares cultivated – Ukraine
Output data:
Fair value per hectare – Russia CBS
Fair value per hectare – Ukraine
Discount factor:
Discount factor – Russia CBS
Discount factor – Ukraine
AGROKULTURA 45 Winter rapeseed
Winter wheat
Winter barley
n.a.
2,494
982
988
n.a.
1,130
n.a.
2.8
3.5
4.4
n.a.
4.1
n.a.
10,846
24,837
7,326
n.a.
7,342
n.a.
4,053
1,309
887
n.a.
1,580
n.a.
9%
13%
9%
n.a.
9%
ANNUAL REPORT 2014
Notes to the Group statements
SEK thousands (where applicable)
31 December 2013
Level 2 assumptions:
Average Russia CBS finished product market value ex works
Average Ukraine finished product market value ex works
Average Kaliningrad finished product market value ex works
Level 3 assumptions:
Average Russia CBS yield (metric tonnes per hectare)
Average Ukraine yield (metric tonnes per hectare)
Average Kaliningrad yield (metric tonnes per hectare)
Factual assumptions:
Hectares cultivated – Russia CBS
Hectares cultivated – Ukraine
Hectares cultivated – Kaliningrad
Output data:
Fair value per hectare – Russia CBS
Fair value per hectare – Ukraine
Fair value per hectare – Kaliningrad
Discount factor
Discount factor – Russia CBS
Discount factor – Ukraine
Discount factor – Kaliningrad
Winter rapeseed
Winter wheat
Winter barley
n.a.
2,911
2,393
1,050
1,134
1,445
n.a.
1,173
n.a.
n.a.
2.6
2.1
2.7
3.7
3.5
n.a.
3.5
n.a.
n.a.
12,407
2,100
16,157
8,213
3,300
n.a.
4,089
n.a.
n.a.
3,179
1,681
1,046
851
1,883
n.a.
1,193
n.a.
12%
11%
12%
12%
11%
12%
12%
11%
12%
Total net production from cropping biological, using estimated cleaning and drying rates amounted to:
Metric Tonnes
Year ended
31 December 2014
Year ended
31 December 2013
51,310
124,995
63,892
58,512
57,032
3,489
79,606
2,105
5,233
446,174
50,826
157,110
43,600
61,453
53,282
6,268
65,950
6,045
3,308
447,842
Rapeseed
Wheat
Barley
Sugar beet
Sunflower
Soya
Corn
Buckwheat
Other crops
Total
The principle assumptions used in the calculation of the livestock biological asset value are as follows:
SEK thousands
31 December 2014
31 December 2013
21.0
2.3
23.6
2.5
High productivity heifer valuation
New born cow valuation
AGROKULTURA 46 ANNUAL REPORT 2014
Notes to the Group statements
Subsequent valuations were made based upon the age and productivity of the animal using the following
principles:
SEK thousands per animal
Productivity (litres per annum) /
Lactation cycles
3,000 – 4,000
4,000 – 6,000
6,000 – 8,000
> 8,000
4.0
4.0
4.0
4.0
4.0
4.0
4.0
4.0
5.5
7.0
8.5
10.0
11.6
13.1
4.0
6.4
8.8
11.2
13.5
15.9
18.3
4.0
6.8
9.6
12.5
15.3
18.1
21.0
7
6
5
4
3
2
1
The livestock biological assets are made up of the following animals:
Number of animals
31 December 2014
31 December 2013
1,699
612
79
2,088
195
101
364
5,138
1,583
964
84
1,974
–
19
510
5,134
Milking cows
Dry cows
Pregnant heifers
Heifers
Meat cows
Bulls
Bull calves
Total animals
Total milk production during the period amounted to 12,138,000 litres (2013: 11,576,401 litres).
19.INVENTORIES
SEK thousands
31 December 2014
31 December 2013
Raw materials at cost
Work in progress
Agricultural inventories
Total
40,186
20,115
131,323
191,624
56,693
33,481
93,110
183,284
Metric tonnes of agricultural produce
Average book value of agricultural produce SEK / metric tonne
140,820
933
90,133
1,033
(6,437)
(12)
(6,449)
(9,570)
(22)
(9,592)
31 December 2014
31 December 2013
5,751
22,472
3,624
31,847
742
13,303
843
46,735
28,351
12,177
5,756
46,284
578
23,171
1,884
71,917
Included above are net realisable value provisions relating to:
Raw materials at cost
Agricultural inventories
Total
20.TRADE AND OTHER RECEIVABLES
SEK thousands
Trade receivables
Advances to suppliers
Other receivables
Subtotal
Prepayments and accrued income
VAT receivable
Other taxes receivable
Total trade and other receivables
AGROKULTURA 47 ANNUAL REPORT 2014
Notes to the Group statements
Movements in provision for impairment which is included in the above:
Brought forward at start of period
Transfer to assets held for sale
Charge for the year
Amounts written off
Unused provision reversed
Currency translation effect
Carried forward at end of period
16,855
–
3,810
(2,292)
(3,294)
(5,210)
9,869
18,891
(6,059)
8,307
(634)
(2,947)
(703)
16,855
The following table shows the ageing profile of the total trade receivables, advances to suppliers and other
receivables:
2014
2013
Total
Neither past due
nor impaired
< 30 days
9,375
34,107
3,529
29,596
3,167
972
Past due but not impaired
30–60 days
61–90 days 91–120 days
988
332
0
34
–
116
> 120 days
1,691
3,057
21.CASH AND CASH EQUIVALENTS
SEK thousands
31 December 2014
31 December 2013
7
25,965
4,860
30,832
16
28,774
–
28,790
Cash in hand
Current bank accounts
Short term bank deposits
Total
22.DISCONTINUED OPERATIONS & ASSETS HELD FOR SALE
within 12 months of the reporting date. The KalinAssets held for sale include the Groups operations
in Kaliningrad and two legal entities which contain
ingrad operations are included in the Kaliningrad
agricultural land parcels as their main asset. The
cropping segment and Livestock segment and the
management is in the process of disposing of its Katwo legal entities are included in the Russia CBS arliningrad operations and actively marketing the two
able reporting segment.
legal entities for sale which is expected to complete
The results of discontinued operations were as follows:
SEK thousands
31 December 2014
31 December 2013
Revenue
Gain or loss on biological assets
Cost of sales
Gross profit
12,040
(3,255)
(20,433)
(11,648)
54,472
(13,512)
(47,604)
(6,644)
Distribution costs
Other income
Other expense
Administration expenses
Operating loss
(337)
118
(9,308)
(214)
(21,389)
(212)
3,137
1,967
(581)
(2,333)
–
(79)
74
(1,515)
(21,468)
(3,774)
(836)
(960)
(22,304)
(4,734)
Finance income
Finance expense
Loss before tax
Tax expense
Loss for the year from discontinued operations
AGROKULTURA 48 ANNUAL REPORT 2014
Notes to the Group statements
The major classes of assets and liabilities included within assets held for sale are shown below:
SEK thousands
31 December 2014
31 December 2013
7,272
(1)
243
14
15
–
1,481
520
14
16
9,574
65,787
2
482
17
12,821
6,504
8,991
118
1,505
2,114
98,341
(2,776)
–
–
(22)
(2,798)
(2,827)
(5,767)
(1,371)
(32)
(9,997)
6,776
88,344
31 December 2014
31 December 2013
4,910
11,939
(4,016)
12,833
(4,140)
(2,219)
(2,086)
(8,445)
31 December 2014
31 December 2013
18,925
–
582
16,444
7,130
36,065
79,146
56,762
3,072
3,622
20,629
9,638
33,209
126,932
31 December 2014
31 December 2013
Non-current financial liabilities
Long term loans and borrowings
Long term lease liabilities
Total non-current financial liabilities
35,802
16,709
52,511
55,606
17,707
73,313
Current financial liabilities
Short term portion of long term loans
Short term loans and borrowings
Short term portion of long term lease liabilities
Other short term liabilities
Total current financial liabilities
8,611
24,014
10,676
–
43,301
9,528
18,964
15,294
49,748
93,534
Property, plant and equipment
Intangible assets
Land in process for registration
Deferred tax assets
Inventories
Biological assets
Trade and other receivables
Income tax receivable
Other financial assets
Cash and cash equivalents
Total assets in disposal groups classified as held for sale
Trade and other payables
Other current financial liabilities
Income tax payable
Deferred tax liabilities
Total liabilities in disposal groups classified as held for sale
Net assets / liabilities of disposal groups
Net cash flows of discontinued operations are as follows:
SEK thousands
Operating cash flows
Investing cash flows
Financing cash flows
Net cash outflow
23.TRADE AND OTHER PAYABLES
SEK thousands
Trade payables – third parties
Trade payables – related parties
Employee withholding tax
Accrued expenses
VAT payable
Other payables
Total
24.FINANCIAL LIABILITIES
SEK thousands
AGROKULTURA 49 ANNUAL REPORT 2014
Notes to the Group statements
SEK thousands
31 December 2014
31 December 2013
Long term loan repayment schedule
Within one year
Due in second year
Due in third year
Due in fourth year
Due thereafter
Total
8,611
24,258
7,156
4,388
–
44,413
9,528
10,599
33,078
7,525
4,404
65,134
Finance lease liability schedule
Within one year
Due in second year
Due in third year
Due in fourth year
Due thereafter
Total
10,676
9,235
2,919
2,385
2,170
27,385
15,294
9,738
5,852
1,560
557
33,001
–
–
–
–
–
–
49,748
–
–
–
–
49,748
Other liabilities schedule
Within one year
Due in second year
Due in third year
Due in fourth year
Due thereafter
Total
of leased assets passes to the Group at the end of
lease term. For further details on operating lease
payments please refer to Note 27.
Property plant and equipment and biological assets have been pledged as security against financial
liabilities. For further details see notes 15 and 18.
There is no unused credit limit at the year end.
All the loan and lease arrangements have been
concluded under regular terms in the respective
country. Lease agreements are related to the purchase of machinery and equipment. All leases are
classified as finance lease because the ownership
25.CLASSIFICATION OF FINANCIAL INSTRUMENTS
SEK thousands
31 December 2014
31 December 2013
91
91
11,779
11,779
Other financial assets
Cash and cash equivalents
Trade and other receivables
Total current financial assets classified as loans and receivables
Total financial assets
7,702
30,832
9,375
47,909
48,000
3,197
28,790
34,107
66,094
77,873
Financial liabilities measured at amortised cost
Other non-current financial liabilities
Total non-current financial liabilities measured at amortised cost
52,511
52,511
73,313
73,313
45,284
43,301
88,585
141,096
93,427
93,534
186,961
260,274
Financial assets
Loans and receivables:
Other non-current financial asset
Total non-current financial assets classified as loans and receivables
Trade and other payables
Other current financial liabilities
Total current financial liabilities measured at amortised cost
Total financial liabilities
The fair value of financial assets and liabilities is deemed not to differ from the carrying value.
AGROKULTURA 50 ANNUAL REPORT 2014
Notes to the Group statements
26.ISSUED CAPITAL AND RESERVES
Share capital
Number of shares
Total quota value
139,008,658
139,008,658
7,254,470
146,263,128
695,043,290
695,043,290
36,272,350
731,315,640
Shares at 31 December 2012 with quota value of 5 SEK per share
Shares at 31 December 2013 with quota value of 5 SEK per share
Direct share issue to Promissory Note holders
Shares at 31 December 2013 with quota value of 5 SEK per share
During the year the Company issued 7,254,470 new
shares at SEK 5.0 per share as part settlement of
promissory notes issued to the Group’s former investment advisory, Alpcot Capital Management. At
31 December 2014 the Company had 146,263,128
outstanding shares with equal voting rights and approximately 320 shareholders. All shares issued are
fully paid and none of the shares issued are held by
the Company or any of its subsidiaries. No shares
are reserved for issue under an option scheme.
Share premium
SEK thousands
Total value
Share premium at 31 December 2012
Share premium at 31 December 2013
Share premium at 31 December 2014
1,463,126
1,463,126
1,463,126
Foreign currency translation reserve
SEK thousands
Total value
Foreign currency translation reserve at 31 December 2012
Other comprehensive loss
Purchase of shares from Non-controlling interest
Disposal of subsidiary
Foreign currency translation reserve at 31 December 2013
Other comprehensive loss
Disposal of subsidiary
Foreign currency translation reserve at 31 December 2014
(222,968)
(54,653)
479
(8,295)
(285,437)
(293,311)
17,659
(561,089)
Translation differences at year end are recognised
directly in the statement of comprehensive income
under “Other comprehensive income”. Translation
difference are accumulated in the Foreign currency
translation reserve.
Translation differences arise upon translation of
foreign operations’ statement of financial position
and income statement when assets and liabilities
are translated at the exchange rate prevailing at the
reporting date and when revenue and expenses are
translated at the average exchange rate for the year.
Translation differences also arise when translating monetary assets and liabilities denominated in
foreign currencies at the exchange rate prevailing
at the reporting date. Those differences are recognised within “profit or loss for the year” with the
exception of translation differences on loans as an
investment in a foreign operation where the differences are included in “Other comprehensive income”. Translation differences mainly arise on loans
given to Russian and Ukrainian subsidiaries of the
Group. The inter-company loans to subsidiaries in
Russia are denominated in RUR and loans to subsidiaries in Ukraine are denominated in USD.
27.OPERATING LEASES
Part of the land where Group’s production facilities
are located is owned by state and local government
and other individuals. The Group has entered into
operating leases to use this land. These leases have
a term of between 1–49 years with renewal options in-
cluded in the contracts. Total minimum lease payments
recognised in the statement of comprehensive income
amount to SEK 36,619 thousand (2013: SEK 48,057
thousand).
Some operating lease agreements have paymentin-kind conditions such as part of harvest from the land.
AGROKULTURA 51 ANNUAL REPORT 2014
Notes to the Group statements
Future annual minimum lease payments due under non-cancellable operating lease agreements at 31 December are as follows:
SEK thousands
31 December 2014
31 December 2013
29,528
81,043
51,830
162,401
38,742
157,354
71,404
267,500
31 December 2014
31 December 2013
84,425
20,732
–
105,157
116,380
29,668
884
146,932
31 December 2014
31 December 2013
644
15
599
227
4
1,489
623
77
878
205
5
1,788
31 December 2014
31 December 2013
358
1,131
1,489
430
1,358
1,788
31 December 2014
31 December 2013
Russia mainland arable
Kaliningrad arable
Ukraine
Livestock
Sweden and UK
Sub total
36,311
828
31,579
9,620
6,915
85,253
42,207
5,668
54,858
11,210
8,889
122,832
Less discontinued operations
Total
(828)
84,425
(6,452)
116,380
31 December 2014
31 December 2013
77
38
38
302
–
850
190
–
141
140
1,776
–
–
–
140
50
800
240
65
78
78
1,451
Not more than 1 year
More than 1 year but less than 5 years
5 years and more
Total
28.PERSONNEL
SEK thousands
Wages and salaries
Social security costs
Termination benefits
Total
Average number of employees
Russia mainland arable
Kaliningrad arable
Ukraine
Livestock
Sweden and UK
Total
Average number of employees
Male
Female
Total
Total salary costs
Remuneration to the Board and Managing Directors
Achim Lukas
Werner Kuester
Klaus John
Simon Hallqvist
Sven Dahlin
Mikael Nachemson
Michael Rosenlew
Katre Saard
Sture Gustavsson
Niclas Eriksson
Total Board
AGROKULTURA 52 ANNUAL REPORT 2014
Notes to the Group statements
31 December 2014
31 December 2013
Ulf Scholander
Stephen Pickup
Total MD
–
2,020
2,020
2,512
207
2,719
Total Board and MD
3,796
4,170
No board members or MD’s were entitled to pension contributions or other benefits. MD Pickup is entitled
to 6 months notice of contract termination.
29.BUSINESS COMBINATIONS
Disposal of subsidiaries
The Group disposed of several Russian and Ukrainian subsidiaries. The net profit on disposal of these entities was 4,121 thousand SEK (2013: loss 5,648 thousand SEK). The classes of assets and liabilities disposed of
were as follows:
Year ended
31 December 2014
Year ended
31 December 2013
Assets and liabilities disposed of:
Property, plant and equipment
Intangible assets
Land in process for registration
Non-current biological assets
Other non-current financial assets
Investments accounted for using the equity method
Biological assets
Inventories
Trade and other receivables
Cash and cash equivalents
Other financial assets
Other non-current financial liabilities
Deferred tax liabilities
Trade and other payables
Other current financial liabilities
Income tax receivable
Net assets / (liabilities) disposed of
Non-controlling interests share of net asset disposed
Currency translation on disposed subsidiaries
25,635
2
–
–
(106)
–
3,463
643
4,832
259
–
–
–
(5,001)
(1)
36
29,762
–
19,871
30,045
7,991
201
18,758
8
325
4,732
13,694
7,987
2,103
5,875
(4,472)
(1,218)
(44,046)
(14,558)
–
27,425
10,293
(8,295)
Costs and revenues on disposal
Assignment of Group receivables to acquirer
Disposal proceeds
Total disposals proceeds / (costs)
–
53,754
53,754
643
23,132
23,775
4,121
(5,648)
53,754
–
(259)
53,495
23,132
(1,503)
(2,103)
19,526
SEK thousands
Result on disposal
Net cash flow effect on disposal of subsidiary
Consideration received in cash and cash equivalents
Less: cash due to be paid in 2014
Less: cash and cash equivalents balances disposed
Total cash effect
AGROKULTURA 53 ANNUAL REPORT 2014
Notes to the Group statements
30.CONTINGENT LIABILITIES
Litigation
The Group has a number of small claims and litigation relating to its operating activities. Management
believes that none of these claims, individually or in
aggregate, will have a material adverse impact on
the Group.
Contingent liabilities relating to tax
The taxation regimes both in the Russian Federation
and in Ukraine is at a relatively early stage of development, and are characterised by numerous taxes,
frequent changes and inconsistent enforcement at
federal, regional and local levels.
Tax laws rely heavily on the interpretation of local
tax officials and fail to address many existing problems. Many issues associated with practical implication of tax legislation are unclear and complicate the
Group’s tax planning and related business decisions.
Changes in the tax system that may be applied retroactively by authorities could affect the Group’s
previously submitted and assessed tax declarations.
While management believes that it has adequately provided for tax liabilities based on its in31.RELATED PARTY TRANSACTIONS
Key management remuneration
Remuneration to key management personnel (including amounts paid under consultancy agreements to service companies) is as shown below. Key
management personnel include heads of departSEK thousands
terpretation of current and previous legislation, the
risk remains that tax authorities could take differing
positions with regard to interpretative issues. This
uncertainty may expose the Group to additional taxation, fines and penalties that could be significant.
Agriculture-related contingent liabilities
The Group is subject to extensive federal and local
agricultural controls and regulations. The Group’s
management believes that its agricultural practices
are in compliance with all current existing agricultural legislation in the Russian Federation and Ukraine.
However, agricultural laws and regulations continue
to evolve. The Group is unable to predict the timing or extent to which those laws and regulations
may change. Such change, if it occurs, may require
that the Group modernise technology to meet more
stringent standards.
Management assesses on a regular basis possible agriculture-related obligations relating to the
Group’s operations. These assessments are based
on the management’s understanding of the current
legal requirements and the term of the land leases.
ment and deputy heads of department at a Group
level and heads of finance and operations in Russia and Ukraine. No post-employment benefits,
other long term benefits or share based payments
were made during the year to key management
personnel.
31 December 2014
31 December 2013
1,776
3,321
5,139
3,994
14,230
1,450
6,190
5,138
5,737
18,515
–
–
884
884
Short term employee benefits:
Board of Directors
Group management
Russia management
Ukraine management
Total
Termination benefits:
Group management
Total
Settlement of Promissory Notes
Between 2011 and 2013 the Company issued transferable Promissory Notes to its former investment
advisors “Alpcot Capital Management” amounting to 48,363,140 SEK. The Promissory Notes were
due for settlement on 31 October 2014. Prior to this
date some of the Promissory Notes amounting to
AGROKULTURA 54 37,976,168 SEK were transferred to the Company’s
major shareholder, Steenord Corp who owned 49% of
the Company’s outstanding shares. Settlement took
place in November 2014 by issuing 7,254,470 shares
at an issue price of SEK 5.0 per share and paying
12,090,790 SEK in cash of which 5,696,425 shares and
9,494,043 SEK in cash were paid to Steenord Corp.
ANNUAL REPORT 2014
Notes to the Group statements
Other board remuneration
Sture Gustavsson entered into a consultancy agreement with the Group to provide agronomical advice
over and above his role as a Director. Total remuneration under the consultancy agreement amounted
to SEK 225 thousand (2013: SEK 120 thousand).
Transactions with major shareholder
During 2014 the company sold part of its sugar beet
production to a companies under the control of a
major shareholder. The transactions were negotiated
and agreed under an arms length basis and were on
similar terms to other customers. Revenue amounted
to SEK 8,356 thousand and trade receivables at 31
December 2014 amounted to SEK 2,995 thousand.
32.RISK MANAGEMENT
(a) Business specific risks
Price risk
The Group management believes that its diversified
geographic production base, its crop rotation system and its combination of cereal production and
dairy farming provide its business with sufficient operational stability.
A long-term deterioration in grain prices could
negatively affect the Group’s operational results.
Prices of agricultural commodities are influenced by
a variety of unpredictable factors beyond the control of the Group, such as global weather conditions,
harvests and changes in global supply and demand.
The following table shows the sensitivity to changes
in commodity prices:
SEK Thousands
Effect on profit and equity:
10% increase in crop prices
10% increase in input costs
31 December 31 December
2014
2013
48,608
(16,934)
56,595
(27,604)
Agricultural infrastructure deficiency
An important factor for the Group’s success and stability
is its ability to safely treat and store the production after
harvest. The Group has made significant investments
in storage infrastructure and has adequate capacity to
cover most of its storage needs in a normal year.
Poor or unexpected weather conditions
Weather conditions are a significant operating risk affecting the Group. Poor weather conditions and unpredictable climate changes may adversely affect farm
output which, in turn, may negatively affect financial
results of the Group.
AGROKULTURA 55 Animal diseases
Livestock such as cows are vulnerable to virus infections and other infectious diseases, including foot and
mouth disease. Animal diseases may result in costs or
losses which could adversely affect the Group’s business, financial condition and results of operations.
In addition to general business risks, the Group’s
operations are exposed to credit, currency, liquidity
and interest rate risks. The Group has implemented a
risk management structure and has adopted a series
of risk management and control procedures to facilitate the measurement, evaluation and control of these
exposures and related risk management activities.
(b)Concentration of credit risk
Credit risk is the risk that a customer or supplier may
default or not meet its obligations to the Group on
a timely basis, leading to financial loss to the Group.
The Group has adopted a policy of only dealing with
creditworthy counterparties and obtaining sufficient
collateral, where appropriate, as a means of mitigating the risk of financial loss from defaults. The Group’s
credit exposure is continuously monitored and the
aggregate value of transactions concluded is spread
amongst approved counterparties. Trade receivables
consist of a large number of customers, spread across
diverse industries and geographical areas. On-going
credit evaluation is performed on the financial condition of accounts receivable and, where appropriate,
credit guarantee insurance cover is purchased. The
Group does not have any significant credit risk exposure to any single counterparty or any group of counterparties having similar characteristics. The Group defines counterparties as having similar characteristics if
they are related entities. The credit risk on liquid funds
is limited because the counterparties are banks with
high credit-ratings assigned by international creditrating agencies.
At the reporting date there are no significant
concentrations of credit risk for loans and receivables. The carrying amount reflected above represents the Group’s maximum exposure to credit risk
for such loans and receivables.
(c)Currency risk
Currency risk is the risk that the financial results and
cash flows of the Group will be adversely impacted by
changes in exchange rates. Exchange fluctuations also
affect the Group’s net income and balance sheet in the
following ways:
Net income is affected when revenues and
costs in foreign currencies are translated to Swedish
kronor.
ANNUAL REPORT 2014
Notes to the Group statements
The balance sheet is affected when assets and liabilities in foreign currencies are translated into Swedish
kronor.
The following table details the distribution of the Group’s financial assets and liabilities between different
currencies.
SEK thousands
RUB
EUR
SEK
UAH
USD
GBP
–
129
12,593
8,339
21,061
–
7,147
977
–
8,124
6
–
1,392
284
1,682
0
345
5,712
519
6,576
–
57
8,859
231
9,147
85
24
1,300
–
1,409
(38,496)
(16,946)
(17,472)
(72,914)
–
(3,036)
–
(3,036)
–
(2,922)
–
(2,922)
–
(19,833)
(18)
(19,851)
(14,014)
(378)
(25,811)
(40,203)
–
(2,167)
–
(2,167)
–
2,504
6,955
14,005
23,464
11,734
–
66
–
11,800
–
–
3,405
68
3,473
0
693
3,441
17,033
21,167
–
–
14,805
3,000
17,805
64
–
118
–
182
(61,496)
(22,093)
(15,113)
(98,702)
–
(2,460)
–
(2,460)
–
(7,873)
(45,013)
(52,886)
(11,817)
(59,217)
(29,378)
(100,412)
–
(1,571)
(4,030)
(5,601)
–
(213)
–
(213)
31 December 2014
Other non-current financial assets
Other financial assets
Cash and cash equivalents
Trade and other receivables
Total financial assets
Other non-current financial
liabilities
Trade and other payables
Other current financial liabilities
Total financial liabilities
31 December 2013
Other non-current financial assets
Other financial assets
Cash and cash equivalents
Trade and other receivables
Total financial assets
Other non-current financial
liabilities
Trade and other payables
Other current financial liabilities
Total financial liabilities
The Group’s Ukrainian produce is valued in currencies such as US dollars or Euro’s, or closely linked
to hard currencies. Crop inputs and fuel prices are
also often priced with reference to hard currencies.
This therefore reduces the Group’s operational exposure to hyrvnia foreign exchange movements.
Where possible the Group maintains minimum cash
balances in hyrvnia by holding agricultural inventory.
AGROKULTURA 56 (d)Liquidity risk
Liquidity risk is the risk that the Group will not be
able to settle all liabilities as they fall due. The
Group’s liquidity position is carefully monitored and
managed. The Group has in place a detailed budgeting and cash forecasting process to help ensure
that it has adequate cash available to meet its payment obligations.
At year’s end there were no unused credit limit.
ANNUAL REPORT 2014
Notes to the Group statements
The following table details the Group’s expected maturity for its non-derivative financial liabilities.
SEK thousands
31 December 2014
Trade and other payables
Other financial liabilities
Interest payments on loans,
borrowings and finance lease
liabilities
Total
31 December 2013
Trade and other payables
Other financial liabilities
Interest payments on loans,
borrowings and finance lease
liabilities
Total
On demand
or overdue
Less than
3 months
3–12
months
1–5
years
Over 5
years
Total
(23,064)
(171)
(9,518)
(28,928)
(4,568)
(14,200)
(3,923)
(52,513)
–
–
(41,073)
(95,812)
(24)
(23,258)
(4,050)
(42,496)
(1,988)
(20,757)
(7,352)
(63,788)
–
–
(13,414)
(150,299)
(51,939)
(15,617)
(31,624)
(15,853)
(5,447)
(61,585)
(3,769)
(73,792)
–
–
(92,779)
(166,847)
(1,896)
(69,452)
(2,530)
(50,007)
(7,390)
(74,422)
(8,855)
(86,416)
–
–
(20,671)
(280,297)
Seasonality
Crop production is a seasonal business with a production cycle (from soil preparation to sales of harvested
crops) of approximately eighteen months. The initial
costs for winter crops are incurred in July to September, while the harvesting taking place in July to August
of the following year. Sale of the agricultural produce
continues until the spring of the following year. Such
long production cycle implies significant fluctuations
in cash flow and investments in working capital.
The Group manages the seasonality through diversification of its business. The Livestock business
is the most important such initiative, that provides
cash flow all year round.
(e)Interest rate risk
Interest rate risk is the risk that changes in interest
rates will adversely impact the financial results of
the Group. The management does not consider this
risk to be material due to the modest level of the
Group’s external borrowing.
(f)Capital risk
The Group’s objective with respect to capital risk is
to secure its ability to continue its operations so that
it can generate returns for the shareholders and value for other stakeholders, and maintain an optimal
capital structure to keep the cost of capital down.
The Group makes use of short term borrowing facilities and trade finance to finance approximately 40%
of its season cost of production. These short term
facilities are drawn down in the spring and repaid
with harvest proceeds in the autumn and winter.
Long term facilities are used to finance up to 80% of
the cost of new equipment purchases.
The following table shows the Group’s gearing ratio:
SEK thousands
31 December 2014
31 December 2013
(95,812)
30,832
(64,980)
724,336
9%
(166,847)
28,790
(138,057)
941,030
15%
Debt *
Cash and cash equivalents
Net debt
Equity **
Net debt to equity ratio
* Debt is defined as long and short term borrowings as detailed in note 24
** Equity includes all capital and reserves of the Group
AGROKULTURA 57 ANNUAL REPORT 2014
Notes to the Group statements
(g)Legal risk / regulatory risk
Russia
In Russia, the acquisition of farmland is permitted
as long as the acquiring company does not have
a majority of foreign owners. The Group, as a foreign investor in Russia, manages its land ownership
through a legal structure which was developed by
the Company’s legal advisors and which is also customary in the market. If changes would take place in
the political climate or legal system in Russia, there
is a risk that the company’s holding structure could
be subject to criticism from the Russian authorities
with possible negative consequences.
Ukraine
In Ukraine a moratorium on the acquisition of agricultural land has applied since the collapse of the
Soviet Union. Current legislation only allows for
the lease of land or for barter of similar land plots.
Should the moratorium be lifted the lessee will have
pre-emptive acquisition rights. This applies both to
national and foreign companies alike and the route
taken by the Group has to date been to take control
of land through lease agreements. In the present
political climate it is uncertain whether the moratorium will be lifted in the foreseeable future and even
if it would be it cannot be ruled out that there may
be restrictions regarding foreign ownership of agricultural land.
(h) Fair value of financial assets and liabilities
A number of the Group’s accounting policies and
disclosures require the determination of fair value,
for both financial and non-financial assets and liabilities. When applicable further information about the
assumptions made in determining fair values is disclosed in the notes specific to that asset or liability.
33.GROUP INFORMATION
The below list includes group entities with material operations
Company name
Country of
incorporation
Nature of business
LLC Agrofirma Pervomayskoe
LLC Agrokultura Ertil
LLC Agrokultura Vorobievskoe
CJSC Enisey
CJSC Agrokultura
LLC UK Agrokultura
LLC Dina
LLC Agrofirma Kolos
LLC Agrokultura Kursk
LLC Agrofirma Kolybelskoe
LLC Agrokultura Livestock
LLC Agrokultura Zakhid
LLC Agrokultura Rogatyn
LLC Agrokultura Ivano-Frankivsk
LK Ukraine Group LLC
LLC Agrokultura Mostyska
Landkom UA LLC
Russia
Russia
Russia
Russia
Russia
Russia
Russia
Russia
Russia
Russia
Russia
Ukraine
Ukraine
Ukraine
Ukraine
Ukraine
Ukraine
Asset holding
Crop production
Crop production
Holding company
Holding company
Management company
Crop production
Crop production
Crop production
Livestock
Livestock
Crop production
Crop production
Crop production
Asset holding
Crop production
Crop production
Control % as of
31 December 2014
100
100
100
100
100
100
100
100
100
100
100
100
100
100
100
100
100
The Group has land where the Group has less than
100% ownership of land areas, see Note 15 for additional information.
34.EVENTS AFTER THE REPORTING DATE
On 27 February 2015 the Company’s shares were delisted from the Nasdaq First North stock exchange.
AGROKULTURA 58 In February 2015 the Group signed loan agreements
with its two major shareholders to provide working
capital finance to the Group to finance its spring
planting campaign in Ukraine. The loans are denominated in USD and carry interest at 10% per annum.
ANNUAL REPORT 2014
Parent statements
Statement of comprehensive income of Parent company
SEK thousands
Note
Operating Income
Revenue
2
Operating costs
Cost of sales
Administrative expenses
Other income
Operating result
Year ended
31 December 2014
2, 3
Income from Group Companies
Finance income
Finance expense
Result before tax
5
6
7
Income tax
Result for the year
Year ended
31 December 2013
5,040
9,062
(4,738)
(16,383)
1,534
(14,547)
(8,630)
(35,041)
304
(34,305)
284,175
3,328
(477,418)
(204,462)
–
22,972
(303,656)
(314,989)
–
(204,462)
–
(314,989)
(204,462
(238)
(204,700)
(314,989)
(113)
(315,102)
Total comprehensive result
Result for year
Translation difference on loans to subsidiaries
Total comprehensive loss for the year
AGROKULTURA 59 ANNUAL REPORT 2014
Parent statements
Parent company statement of financial position
SEK thousands
Note
ASSETS
Non-current assets
Investment in Group companies
Receivables from Group companies'
Other receivables'
Total non-current assets
Year ended
31 December 2014
Year ended
31 December 2013
8
9
374,389
31,787
6
406,182
563,896
317,339
6,994
888,229
9
286,559
7,840
25,748
5,897
326,044
1,654
5,391
77,113
3,403
87,561
TOTAL ASSETS
732,226
975,790
SHAREHOLDERS' EQUITY AND LIABILITIES
Equity share capital
731,316
695,043
1,461,126
(779)
(1,258,640)
(204,700)
728,323
1,461,126
(779)
(943,538)
(315,102)
896,750
–
–
–
–
1,532
–
10
2,361
3,903
4,889
24,213
45,205
4,733
79,040
732,226
975,790
–
117,176
–
97,626
Current assets
Receivables from Group companies
Other receivables
Prepaid expenses and accrued income
Cash and cash equivalents
Total current assets
10
Free reserves
Other paid in capital
Reserve for fair value
Retained earnings
Result for the year
Total shareholders' equity
Non-current liabilities
Other long term debts
Total long term liabilities
Current liabilities
Accounts payable
Payables to Group companies
Other liabilities
Accrued expenses and deferred income
Total current liabilities
11
12
TOTAL SHAREHOLDERS' EQUITY AND LIABILITIES
Off balance sheet items
Pledged assets
Guarantees
13
AGROKULTURA 60 ANNUAL REPORT 2014
Parent statements
Parent company changes in equity
SEK thousands
Balance on 31 December 2012
Appropriation of result
Result for year
Balance on 31 December 2013
Direct share issue
Appropriation of result
Result for year
Balance on 31 December 2014
Share
capital
Share
premium
reserve
Retained
earnings
Reserve
for fair
value
Current
year’s
result
695,043
–
–
695,043
36,273
–
–
731,316
1,461,126
–
–
1,461,126
–
–
–
1,461,126
(779)
–
–
(779)
–
–
–
(779)
66,959
(1,010,497)
–
(943,538)
–
(315,102)
–
(1,258,640)
(1,010,497)
1,010,497
(315,102)
(315,102)
–
315,102
(204,700)
(204,700)
Total
equity
1,211,852
–
(315,102)
896,750
36,273
–
(204,700)
728,323
Parent company Cash flow statement
Year ended
31 December 2014
SEK thousands
Operating activities
Payments to suppliers and employees
Other receipts/payments
Interest received
Cash flow from operating activities
Investment activity
Acquisition of Group companies
Loans provided to Group companies in year
Loans/Interest repaid by Group companies in Year
Short term loans provided to group companies in year
Loans/interest repaid by Third parties
Cash flow from investing activities
Financing activity
Repayment of loans
Cash flow from financing activities
Change in cash and cash equivalents
Exchange difference on cash
Cash and cash equivalents at the beginning of the year
Cash and cash equivalents at the year end
AGROKULTURA 61 ANNUAL REPORT 2014
Year ended
31 December 2013
(29,458)
3,031
11
(26,416)
(39,458)
–
37,311
(2,147)
(185)
(2,359)
38,713
(451)
4,740
40,458
–
(10,234)
2,510
(306)
13,121
5,091
(12,091)
(12,091)
–
–
1,951
541
3,403
5,895
2,944
(272)
731
3,403
Notes to the Parent statements
1.PARENT COMPANY ACCOUNTING PRINCIPLES
The parent company uses the same accounting
principles as the Group except in cases where the
parent company’s ability to apply IFRS is limited by
provisions in the Annual Accounts Act (Sw: Årsredovisningslagen”) and in certain cases for tax reasons. In addition, the recommendation of the Swedish Financial Accounting Standards Council RFR 2
Accounting for legal entities has been applied.
Investments are accounted for according to the
acquisition cost method. Investments are carried at
2.GROUP INTERNAL SALES AND PURCHASES
One hundred per cent of the sales during the year
pertain to sales to Group companies. The Company
received management services from its subsidiary
cost and only dividends are accounted for in the income statement. An impairment test is performed
and write-downs are made when a permanent decline in value is established. Contributions to and
from subsidiaries and shareholder’s contribution are
accounted for according to RFR 2. Group contributions from subsidiaries are accounted for as financial income and group contributions to subsidiaries
from parent company and shareholder’s contribution increases the parent company’s investment.
Agrokultura Farming UK Limited amounting to SEK
5,833 thousand (2013: 4,106 thousand).
3. AUDIT FEES
Paid to Ernst & Young,
SEK thousands
Year ended
31 December 2014
Year ended
31 December 2013
1,600
249
–
193
2,042
1,330
1,415
–
1,507
4,252
Year ended
31 December 2014
Year ended
31 December 2013
–
–
(401)
(401)
Audit assignment
Audit work not related to ordinary audit assignment
Other services
Tax advice
Total
Paid to Deloitte,
SEK thousands
Audit assignment
Total
Audit assignment fees relates to the legally required
audit of the annual report as well as of the administration of the Company by the Board of Directors
and Managing Director. Audit work not related to
ordinary audit assignment relates to review of the
administration of the company or of economic information, that has be carried out in accordance with
AGROKULTURA 62 law, with the charter of the Company, with other legal requirements or with agreements and that is not
part of the yearly annual audit work, and that shall
result in a report or certification or other act that is
intended for others than Agrokultura. Tax advice implies consultancy work regarding tax related issues.
ANNUAL REPORT 2014
Notes to the Parent statements
4.PERSONNEL
Year ended
31 December 2014
Year ended
31 December 2013
3
–
9
–
Year ended
31 December 2014
Year ended
31 December 2013
1,181
–
–
1,450
4,556
181
1,729
2,910
169
3,079
5,857
12,045
1,375
13,420
4
–
6
1
Average number of employees
of which women
Salaries and other remuneration,
SEK thousands
Board members
MD and deputy MD
Pension costs
Other staff:
Salaries and other remuneration
Total
Social security costs
Total salaries and other remuneration
Gender distribution in board
Number of board members
Of which women
Contracted CEO fee relates to fees paid to Nordic Interim for Ulf Scholander covering the period of January
2013 to July 2013.
5.INCOME FROM GROUP COMPANIES
SEK thousands
Year ended
31 December 2014
Year ended
31 December 2013
171,876
(12,814)
112,563
12,550
284,175
–
–
–
–
–
Year ended
31 December 2014
Year ended
31 December 2013
14
3,314
3,328
651
22,321
22,972
Year ended
31 December 2014
Year ended
31 December 2013
(736,651)
1,209,175
59
265
3,362
70
1,114
24
477,418
299,511
–
1
Dividend Income
BBAH investment write off
BBAH asset transfer
BBAH impairment write off
Total
6. FINANCE INCOME
SEK thousands
Interest income
Interest income – Group companies
Total
7. FINANCE EXPENSE
SEK thousands
Reversal of impairment of receivables from Group Companies
Impairment of investments in Group companies
Write off of receivables from Group companies
Profit/loss from disposal of subsidiaries
Interest expense
Interest expense – Group companies
Exchange differences
Other financial expenses
Total
AGROKULTURA 63 ANNUAL REPORT 2014
–
–
190
3,954
303,656
Notes to the Parent statements
8.INVESTMENT IN GROUP COMPANIES
Company
Jurisdiction
Registration
number
Larontas Ltd
ARLF Agrokultura Ltd
BBAH Sweden AB
Rusar Agro S.A.
Landkom International PLC
Total
Cyprus
Cyprus
Sweden
Luxembourg
Isle of Man
HE219305
HE194878
556713-1379
B144169
000737V
Holding %
Book value
SEK thousands,
SEK thousands,
31 December 2014
31 December 2013
100
100
100*
100
100
–
374,389
–
–
–
374,389
628
399,790
12,814
339
150,325
563,896
31 December 2014
31 December 2013
318,993
1,557,931
(66,922)
756,137
(6,974)
(2,234,586)
(6,232)
318,347
903,017
11,888
(2,510)
–
(193,818)
(399,473)
(111)
318,993
* BBAH Sweden AB was liquidated in December 2014
9. RECEIVABLES FROM GROUP COMPANIES
SEK thousands
Opening balance
Loans advanced during period
Loans repaid/cleared during period
Reversal of Impairment of receivables
Impairment of receivables
Investment contribution
Exchange differences
Closing balance
Receivables from group companies relate mainly
to loans extended to subsidiaries in Luxembourg,
Ukraine, Sweden, and Isle of Man. The loans to the
subsidiaries in Luxembourg and Sweden are denominated in SEK and those to Ukraine and Isle of
Man in USD.
In 2014 and 2013 the Company carried out a review of its receivables from Group companies and
AGROKULTURA 64 identified an impairment. It was considered that the
total value of receivables and investments in Group
companies should not exceed the net asset value of
the Group.
In January 2015 the Company made a contribution to its subsidiary in Luxembourg which was settled through an offset with intercompany loans due
to the parent.
ANNUAL REPORT 2014
Notes to the Parent statements
10.PREPAID EXPENSES AND ACCRUED INCOME
SEK thousands
31 December 2014
31 December 2013
Group companies
Accrued interest income
Accrued interest income
Subtotal
24,920
707
25,627
–
76,919
76,919
Third parties
Other prepaid expenses and accrued income
Total
121
25,748
194
77,113
Other prepaid expenses and accrued income under Group companies relate to interest accrued on intercompany loans which are due after more than one year.
11.OTHER LIABILITIES
SEK thousands
31 December 2014
31 December 2013
–
–
10
10
48,363
(3,350)
192
45,205
31 December 2014
31 December 2013
343
2,018
2,361
1,330
3,403
4,733
Accrued management fee
Present value adjustment to accrued management fee
Other short term liabilities
12.ACCRUALS
SEK thousands
Accrued audit fees
Other accrued expenses and deferred income
Total
13.OFF BALANCE SHEET ITEMS
Guarantees amounting to SEK 117,176 thousand
(2013: SEK 97,626 thousand) were made by the
Company towards Raiffeisen Bank Aval to secure
short term bank loans which were taken out during
AGROKULTURA 65 2014 by several Group companies in Ukraine. In the
event that the subsidiaries default on its liabilities,
Agrokultura AB would be required settle debts.
ANNUAL REPORT 2014
Statement of assurance
The Board of Directors and the Managing Director
hereby provide an assurance that the consolidated
accounts have been prepared in accordance with the
International Financial Reporting Standards (IFRS)
to the extent they have been adopted by the EU,
and that the consolidated accounts provide a fair
and true view of the Group’s financial position and
results. The annual accounts have been prepared
in accordance with generally accepted accounting
standards and provide a fair and true view of the Parent Company’s financial position and results.
The report of the directors for the Group and the
Parent Company provides a fair and true overview
of the development of the Group’s and the Parent
Company’s operations, financial position and results, and describes significant risks and uncertainties to which the Parent Company and the companies in the Group are exposed.
Stockholm 24 April 2015
Agrokultura AB (publ)
Board of Directors
Alexej Ugarov
Achim Lukas
Chairman of the Board
Board member
Klaus JohnVladimir Kuznetsov
Board member
Board member
Stephen Pickup
Board member and Group Managing Director
The annual report and the consolidated financial
statements were, as stated above, approved for
publication by the Board of Directors on 24 April
2015.
The consolidated income statement, statement
of financial position and the Parent Company’s income statement and balance sheet will be the subject of approval at the Annual General Meeting on
26 May 2015.
Our audit report was submitted on 24 April 2015
Ernst&Young
Signature on Swedish original
Per Hedström
Authorized Public Accountant
AGROKULTURA 66 ANNUAL REPORT 2014
Auditor’s report
TRANSLATION FROM THE SWEDISH ORIGINAL
To the annual meeting of the shareholders of Agrokultura AB,
corporate identity number 556710-3915
Report on the annual accounts and consolidated
accounts
We have audited the annual accounts and consolidated accounts of Agrokultura AB for the year 2014.
The annual accounts and consolidated accounts of
the company are included in the printed version of
this document on pages 16–66.
Responsibilities of the Board of Directors and the
Managing Director for the annual accounts and
consolidated accounts
The Board of Directors and the Managing Director
are responsible for the preparation and fair presentation of these annual accounts in accordance with
the Annual Accounts Act and of the consolidated
accounts in accordance with International Financial
Reporting Standards, as adopted by the EU, and the
Annual Accounts Act, and for such internal control
as the Board of Directors and the Managing Director determine is necessary to enable the preparation
of annual accounts and consolidated accounts that
are free from material misstatement, whether due to
fraud or error.
Auditor’s responsibility
Our responsibility is to express an opinion on these
annual accounts and consolidated accounts based
on our audit. We conducted our audit in accordance with International Standards on Auditing and
generally accepted auditing standards in Sweden.
Those standards require that we comply with ethical
requirements and plan and perform the audit to obtain reasonable assurance about whether the annual
accounts and consolidated accounts are free from
material misstatement.
An audit involves performing procedures to
obtain audit evidence about the amounts and disclosures in the annual accounts and consolidated
accounts. The procedures selected depend on the
auditor’s judgement, including the assessment of
the risks of material misstatement of the annual
accounts and consolidated accounts, whether due
AGROKULTURA 67 to fraud or error. In making those risk assessments,
the auditor considers internal control relevant to
the company’s preparation and fair presentation of
the annual accounts and consolidated accounts in
order to design audit procedures that are appropriate in the circumstances, but not for the purpose of
expressing an opinion on the effectiveness of the
company’s internal control. An audit also includes
evaluating the appropriateness of accounting policies used and the reasonableness of accounting
estimates made by the Board of Directors and the
Managing Director, as well as evaluating the overall
presentation of the annual accounts and consolidated accounts.
We believe that the audit evidence we have obtained is sufficient and appropriate to provide a basis for our audit opinions.
Opinions
In our opinion, the annual accounts have been prepared in accordance with the Annual Accounts Act
and present fairly, in all material respects, the financial position of the parent company as of 31 December 2014 and of its financial performance and
its cash flows for the year then ended in accordance
with the Annual Accounts Act. The consolidated accounts have been prepared in accordance with the
Annual Accounts Act and present fairly, in all material respects, the financial position of the group as
of 31 December 2014 and of their financial performance and cash flows for the year then ended in
accordance with International Financial Reporting
Standards, as adopted by the EU, and the Annual
Accounts Act. The statutory administration report
is consistent with the other parts of the annual accounts and consolidated accounts.
We therefore recommend that the annual meeting of shareholders adopt the income statement
and balance sheet for the parent company and the
consolidated statement of comprehensive income
and the consolidated statement of financial position
of the group.
ANNUAL REPORT 2014
Auditor’s report
Report on other legal and regulatory
requirements
In addition to our audit of the annual accounts and
consolidated accounts, we have also audited the
proposed appropriations of the company’s profit or
loss and the administration of the Board of Directors and the Managing Director of Agrokultura AB
for the year 2014.
Responsibilities of the Board of Directors and the
Managing Director
The Board of Directors is responsible for the proposal for appropriations of the company’s profit or
loss, and the Board of Directors and the Managing
Director are responsible for administration under
the Companies Act.
Auditor’s responsibility
Our responsibility is to express an opinion with reasonable assurance on the proposed appropriations
of the company’s profit or loss and on the administration based on our audit. We conducted the audit in accordance with generally accepted auditing
standards in Sweden.
As a basis for our opinion on the Board of Directors’ proposed appropriations of the company’s
profit or loss, we examined whether the proposal is
in accordance with the Companies Act.
As a basis for our opinion concerning discharge
from liability, in addition to our audit of the annual
accounts and consolidated accounts, we examined
significant decisions, actions taken and circumstances of the company in order to determine whether
any member of the Board of Directors or the Managing Director is liable to the company. We also examined whether any member of the Board of Directors or the Managing Director has, in any other way,
acted in contravention of the Companies Act, the
Annual Accounts Act or the Articles of Association.
We believe that the audit evidence we have obtained is sufficient and appropriate to provide a basis for our opinions.
Opinions
We recommend to the annual meeting of shareholders that the loss be dealt with in accordance with the
proposal in the statutory administration report and
that the members of the Board of Directors and the
Managing Director be discharged from liability for
the financial year.
Stockholm April 24th 2015
Ernst & Young AB
Per Hedström
Authorized Public Accountant
AGROKULTURA 68 ANNUAL REPORT 2014
Board of Directors
Alexej Ugarov
(b. 1966)
Chairman
Board member since 2015
Other positions: None
Number of shares: 0
Klaus John
(b. 1962)
Board member since 2014
Other positions: None
Number of shares: 0
Vladimir Kuznetsov
(b. 1972)
Board member since 2015
Other positions: None
Number of shares: 0
Stephen Pickup
(b. 1975)
Board member since 2015
Managing Director since 2013
Number of shares: 0
Achim Lukas
(b. 1957)
Board member since 2014
Other positions: None
Number of shares: 0
Harvesting sugar beets in Ertil
AGROKULTURA 69 ANNUAL REPORT 2014
Glossary and definitions
Agrokultura
Agrokultura AB (publ), corporate registration number 556710-3915, including subsidiaries depending
on the context
Central Black Soil Region or “Russia CBS”
A region in Central Russia that comprises the oblasts
Voronezh, Lipetsk, Belgorod, Tambov, Oryol and
Kursk. The Black Soil Region is famous for its very
good soil, called Black soil, Black earth or Chernozem, and is one of the core areas of Agrokultura’s
crop production business. The short form “Russia
CBS” is used as a name for the Groups operations
in the region.
Leased land
Land controlled through lease agreements
Land in ownership
Registered land + Land in the process of registration
Land under control
Registered land + Land in the process of registration
+ Leased land
DEFINITIONS – CROP PRODUCTION
Grains
Generic term for wheat, barley, oats, rye, and corn
Group
Agrokultura AB (publ) together with subsidiaries
Oilseeds
Generic term for rapeseed (also called OSR), soybean and sunflower seed
Investment Manager, Alpcot Capital Management or ACM
The investment manager Alpcot Capital Management Ltd provided investment advice to the Group
under a Management Agreement, which was set up
in connection with the incorporation of Agrokultura
in 2006 and which ceased in 2013
Measurement units
Tonnes are metric tonnes
1 hectare (ha) = 10,000 m²
1 hectare (ha) = 2.47 acres
1 tonne of wheat = 36.74 bushels
1 tonne corn = 39.37 bushels
1 tonne = 10 centners
Parent Company
The Swedish parent company for the Group,
Agrokultura AB (publ)
DEFINITIONS – LIVESTOCK
Dairy cow
A cow that has had a calving and is either a Producing dairy cow or a Dry cow. A cow goes from being
a heifer to become a dairy cow when it has had at
least one calving.
DEFINITIONS – LAND
Registered land
Land where authorized authorities have issued
owner certificates in the name of a subsidiary of the
Group and where the corresponding registration
has been made in the central land register.
Land in the process of registration
Land acquired by subsidiaries of the Group through
the holdings of pais, where registration in the name
of a subsidiary is ongoing
Dry cow
A cow which has had at least one calving and have
been producing milk, but is not producing milk at
the reporting date.
Heifer
A cow which has not yet had its first calving.
Producing dairy cow
A cow that is producing milk at the reporting date.
AGROKULTURA 70 ANNUAL REPORT 2014
Addresses
SWEDEN
Agrokultura AB
Artillerigatan 6
114 51 Stockholm
Sweden
web: www.agrokultura.com
E-mail: [email protected]
RUSSIA
Agrokultura Russia
Leninsky Prospect 43A
8th floor
394004 Voronezh
Russian Federation
UKRAINE
Agrokultura Ukraine
72 Heroiv UPA Street
4th floor Building 1
79015 Lviv
Ukraine
Flourishing buckwheat in Vorobievka
Agrokultura AB (publ)
Corporate registration number: 556710-3915
www.agrokultura.com


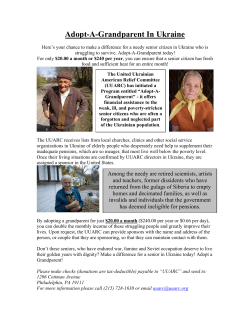


© Copyright 2026