
Phenotypic and molecular characterization of the Open Access
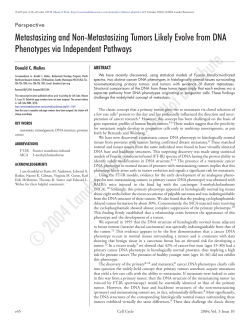
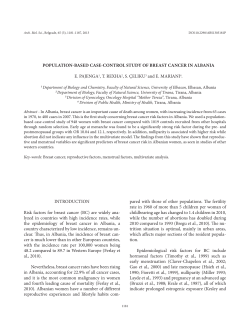
Prat et al. Breast Cancer Research 2010, 12:R68
http://breast-cancer-research.com/content/12/5/R68
RESEARCH ARTICLE
Open Access
Phenotypic and molecular characterization of the
claudin-low intrinsic subtype of breast cancer
Aleix Prat1,2,3, Joel S Parker1,2†, Olga Karginova1,2,3†, Cheng Fan1, Chad Livasy1,3, Jason I Herschkowitz4,
Xiaping He1,2,3, Charles M Perou1,2,3*
Abstract
Introduction: In breast cancer, gene expression analyses have defined five tumor subtypes (luminal A, luminal B,
HER2-enriched, basal-like and claudin-low), each of which has unique biologic and prognostic features. Here, we
comprehensively characterize the recently identified claudin-low tumor subtype.
Methods: The clinical, pathological and biological features of claudin-low tumors were compared to the other
tumor subtypes using an updated human tumor database and multiple independent data sets. These main
features of claudin-low tumors were also evaluated in a panel of breast cancer cell lines and genetically
engineered mouse models.
Results: Claudin-low tumors are characterized by the low to absent expression of luminal differentiation markers,
high enrichment for epithelial-to-mesenchymal transition markers, immune response genes and cancer stem celllike features. Clinically, the majority of claudin-low tumors are poor prognosis estrogen receptor (ER)-negative,
progesterone receptor (PR)-negative, and epidermal growth factor receptor 2 (HER2)-negative (triple negative)
invasive ductal carcinomas with a high frequency of metaplastic and medullary differentiation. They also have a
response rate to standard preoperative chemotherapy that is intermediate between that of basal-like and luminal
tumors. Interestingly, we show that a group of highly utilized breast cancer cell lines, and several genetically
engineered mouse models, express the claudin-low phenotype. Finally, we confirm that a prognostically relevant
differentiation hierarchy exists across all breast cancers in which the claudin-low subtype most closely resembles
the mammary epithelial stem cell.
Conclusions: These results should help to improve our understanding of the biologic heterogeneity of breast
cancer and provide tools for the further evaluation of the unique biology of claudin-low tumors and cell lines.
Introduction
Genomic studies have established four major breast cancer intrinsic subtypes (luminal A, Luminal B, HER2enriched, basal-like) and a normal breast-like group that
show significant differences in incidence, survival and
response to therapy [1-3]. However, as gene expression
studies evolve, further subclassification of breast tumors
into new molecular entities is expected to occur. In 2007,
we identified a new molecular subtype, referred to as
claudin-low, using 13 samples [5]. These distinct tumors
were found in both human and murine breast tumor data
* Correspondence: [email protected]
† Contributed equally
1
Lineberger Comprehensive Cancer Center, University of North Carolina, 450
West Drive, Chapel Hill, 27599, USA
Full list of author information is available at the end of the article
sets and were characterized by the low gene expression of
tight junction proteins claudin 3, 4 and 7 and E-cadherin,
a calcium-dependent cell-cell adhesion glycoprotein.
More recently, a tumor initiating cell (TIC) genomic signature derived from CD44+/CD24-/low-sorted cells and
mammospheres obtained from primary human breast
tumors was found to be exclusively enriched by gene
expression in the claudin-low subtype [6,7], and the
expression of this CD44+/CD24-/low/claudin-low profile
increased in posttreatment samples after neoadjuvant
chemotherapy or hormone therapy [7]. Overall, these
studies suggest that the claudin-low tumor subtype lacks
common epithelial cell features and is enriched for TIC
features.
In this study, we comprehensively characterize the
claudin-low subtype using an updated human tumor
© 2010 Prat et al.; licensee BioMed Central Ltd. This is an open access article distributed under the terms of the Creative Commons
Attribution License (http://creativecommons.org/licenses/by/2.0), which permits unrestricted use, distribution, and reproduction in
any medium, provided the original work is properly cited.
Prat et al. Breast Cancer Research 2010, 12:R68
http://breast-cancer-research.com/content/12/5/R68
database and multiple independent data sets and present
the pathological and chemotherapy response characteristics of this subtype of “triple negative” breast cancers. In
contrast to the basal-like subtype, we provide evidence
that claudin-low tumors are more enriched in epithelialto-mesenchymal transition (EMT) features, immune
system responses, and stem cell-associated biological
processes. The molecular characterization of the claudin-low intrinsic subtype in tumors and cell lines reveals
a breast cancer differentiation hierarchy that resembles
the normal epithelial mammary developmental cascade.
Materials and methods
Human breast tumor microarray data sets
All human tumor and normal tissue samples were collected using Institutional Review Board (IRB)-approved
protocols and were obtained from fresh frozen invasive
breast carcinomas that were profiled as described previously using oligo microarrays (Agilent Technologies,
Santa Clara, CA, USA) [8]; we used all the microarrays
from Herschkowitz et al. [5], Parker et al. [9] and Hennessy et al. [6], plus 39 new additional samples presented here. All microarray and patient clinical data are
available in the University of North Carolina (UNC)
Microarray Database [10] and have been deposited in
the Gene Expression Omnibus (GEO) under the accession number GEO:GSE18229 (referred to here as the
UNC337 set). The probes or genes for all analyses were
filtered by requiring the lowest normalized intensity
values in both sample and control to be > 10. The normalized log2 ratios (Cy5 sample/Cy3 control) of probes
mapping to the same gene (Entrez ID as defined by the
manufacturer) were averaged to generate independent
expression estimates. In the resulting UNC337 matrix,
no significant batch effects were observed. We also used
publicly available microarray and patient clinical data
from the following breast cancer data sets: NKI295
[11,12], MDACC133 [13] and NKI113 [14]. In
MDACC133, raw data were normalized using the robust
multiarray analysis (RMA) normalization approach. In
all data sets, genes were median-centered within each
data set and samples were standardized to zero mean
and unit variance before other analyses were performed.
Gene expression signatures
We analyzed the mean expression of multiple previously
published gene signatures [7,15-19]. Briefly, these signatures include leukocyte-related signatures from Palmer
et al. [17]: CD8 (n = 10 genes), B_Cell (n = 286), T_Cell
(n = 178), and GRANS (n = 353). Stromal-related signatures were obtained from West et al. [16] (n = 402; DTF
and SFT signatures combined) and Beck et al. [19] (n =
174). Genes enriched more than twofold in mammosphere-derived cells compared with differentiated cells
Page 2 of 18
were obtained from Dontu et al. [15] (n = 58). From Shipitsin et al. [18], we calculated the mean expression of
the upregulated (n = 357) and downregulated (n = 353)
genes from CD44+ versus CD24+ breast cancer cells from
metastatic pleural effusions. From Creighton et al. [7], we
calculated the mean expression of the CD44+/CD24-/low/
mammosphere signature reported (n = 119 upregulated
genes; n = 279 downregulated genes). Finally, the proliferation and luminal gene cluster signatures were handpicked (node correlation > 0.75) from the unsupervised
intrinsic hierarchical clustering of the UNC337 using the
intrinsic list of Parker et al. [9] and average linkage clustering using Cluster v2.12 (M. Eisen) [20] as shown in
Figure S1 in Additional file 1. Gene lists from all genomic
signatures are displayed in Supplemental Data in Additional file 2.
Breast cancer cell line microarray data set
We analyzed a data set that included Affymetrix U133A
gene expression microarrays of 52 breast cancer cell lines
[21]. Raw data were normalized using RMA, and genes
were median-centered before analyses. Among the 52
breast cancer cell lines analyzed, DU4475, HCC1008 and
HCC1599 cell lines were not included in Neve et al. [21].
Mouse breast tumor microarray data set
All mouse samples from the UNC were collected from
fresh frozen invasive breast carcinomas as described previously [5] using Agilent mouse oligo microarrays. Data
normalization and preprocessing were identical to that
described for the UNC337 data set. We used only samples (n = 104) from our previous publication that were
included in 1 of the 10 mouse classes [5].
Claudin-low and normal breast Euclidian centroid-based
predictors
To robustly identify claudin-low samples, we built two
predictors on the basis of either our human tumor data
or the cell line data of Neve et al. [21]. To build a predictor, we first selected those genes that were significantly
differentially expressed between claudin-low tumors
defined by SigClust [22] (or cell lines) and all other subtypes using a two-class, unpaired SAM, with < 5% false
discovery rate (FDR). Then we used these gene lists and
calculated a claudin-low centroid and an “others” centroid from the training data. For every sample, we calculated the Euclidean distances to the two centroids and
assigned the class of the nearest centroid. Using the same
methodology, we also built a normal breast predictor by
selecting those genes that were significantly differentially
expressed between normal breast tissues and breast
tumors using a two-class, unpaired SAM, with 0% FDR.
Note that these gene lists are also included in Supplemental Data in Additional file 2.
Prat et al. Breast Cancer Research 2010, 12:R68
http://breast-cancer-research.com/content/12/5/R68
Intrinsic subtype classification
For all human breast tumor studies, intrinsic subtype
classification was performed using the PAM50 predictor
[9]. Human claudin-low tumor samples were identified
using either SigClust [22] or the nine-cell line claudinlow predictor. Samples identified by SigClust [22] or the
nine-cell line claudin-low predictor were called claudinlow, regardless of the PAM50 call. For breast cancer cell
lines, the claudin-low subtype classification was based
on unsupervised hierarchical clustering using the intrinsic list of Parker et al. [9] and the node identified in
Figure S4 in Additional file 1. The complete gene list of
the nine-cell line claudin-low predictor can be found in
Supplemental Data in Additional file 2.
Mammary developmental analyses
Public data sets from Raouf et al. [23] and Lim et al. [24]
were downloaded from GEO and assigned NCBI Entrez
gene identifiers as available in GEO. Samples were scaled
to mean zero and variance of 1. Features were then collapsed to the mean of each gene identifiers. In Lim et al.
[24], three epithelial cell-enriched subpopulations were
profiled on DNA microarrays: mammary stem cells
(MaSC), luminal progenitors (pL) and mature luminal
cells (mL). We created a differentiation predictor for
each sample as a measure of any sample’s position along
a MaSC ® pL ® mL axis as defined by gene expression.
Distance-weighted discrimination (DWD) was used to
determine the direction of greatest variation from MaSC
to pL and pL to mL. To map a sample onto this axis of
differentiation, the pL centroid was set as the origin, and
the MaSC and mL centroids were transformed to length
1 (sum of squares equals 1) to map a sample onto this
axis of differentiation. Before mapping a sample onto this
axis, it is assumed that the test data set covers the range
of differentiation, which allows median centering of
genes to correct for platform bias. Test samples are then
adjusted using the parameters for placing pL at the origin
and are transformed to length 1. Each sample is then
projected onto the MaSC ® pL axis and the pL ® mL
axis by calculating the inner product of the sample and
the MaSC or mL vectors identified by DWD. The difference of the two projected positions of each sample along
the MaSC ® pL ® mL axis is referred to as the differentiation score. In the UNC microarray database web site
[10], we have provided the detailed R commands and
files regarding the differentiation predictor.
Mammospheres from normal breast tissues
Fourteen normal breast tissues were dissociated mechanically and enzymatically as described in Stingl et al. [25].
The samples were procured and used according to
approved IRB protocols for research in human subjects.
Mammospheres were cultured according to Dontu et al.
Page 3 of 18
[15], and single cells were plated onto ultralow attachment
plates (Corning) at a density of 20,000 viable cells/ml.
RNA was purified using RNeasy Mini kit (Qiagen) after 14
to 20 days in primary culture (first passage), and microarrays were performed as described above.
Immunohistochemistry
Formalin-fixed, paraffin-embedded tissue sections
(~5 μm thick) were processed using standard immunohistochemistry methods as previously described [26].
The sections were incubated for 60 min at room temperature with primary antibody to claudin 3 (dilution
1:100; Invitrogen, Catalog No. 18-7340) or E-cadherin
(Clone No. ECH-6, pre-diluted; Cell Marque). The slides
were incubated for 45 min with diluted biotinylated secondary antibody (1:250 dilution) for 30 min with Vectastain Elite ABC reagent (Vector Laboratories). Sections
were incubated in peroxidase substrate solution for
visualization. Slides were counterstained with hematoxylin and examined by light microscopy. Tumor immunoreactivity was scored in a blinded fashion by two
investigators (JIH and XH) into two categories: negative/
weak positive and moderate/strong positive.
Immunofluorescence
Formalin-fixed, paraffin-embedded sections (~5 μm
thick) were processed using standard immunostaining
methods as previously described [5]. The primary antibodies and their dilution were vimentin (mouse antivimentin IgG1-, dilution 1:100; Invitrogen, Catalog No.
18-0052), keratin 5 (rabbit anti-human, dilution 1:500;
Abcam, Catalog No. ab24647), and keratin 19 (Abcam,
Catalog No. ab7754, mouse anti-human IgG2a; dilution
1:200). Secondary antibodies for immunofluorescence
were conjugated with Alexa Fluor-568 (Red, keratin 5
and 19) or Alexa Fluor-488 (Green, vimentin) fluorophores (1:200; Molecular Probes, Invitrogen). Dual positivity was scored in a blinded fashion by XH into two
categories: negative meaning no dual positive cells and
positive meaning the presence of dual positive cells.
Cell lines
SUM159PT cells (Asterand) were maintained in Ham’s
F-12 medium with 5% fetal bovine serum (FBS), insulin
(5 μg/ml), and hydrocortisone (1 μg/ml). MCF-7 was
cultured in RPMI with 10% FBS [27], and SUM149PT
was maintained in HuMEC media with supplements
(Gibco) with and without 5% FBS [28]. All cell lines
were grown at 37°C and 5% carbon dioxide.
Fluorescence-activated cell sorting (FACS) and
microarray analysis
Nonconfluent cell cultures were trypsinized and filtered
to produce single cell suspension, counted, washed with
Prat et al. Breast Cancer Research 2010, 12:R68
http://breast-cancer-research.com/content/12/5/R68
Hanks’ balanced salt solution (Stem Cell Technologies)
containing 2% FBS and stained with antibodies specific
for human cell surface markers: EPCAM-fluorescein isothiocyanate (Stem Cell Technologies) and CD49fphycoerythrin (BD Pharmingen). A total of 500,000 cells
were incubated with antibodies for 30 min at 4°C. Cells
were washed from unbound antibodies and immediately
analyzed using Beckman-Coulter (Dako) CyAn ADP or
sorted using BD FACScan. RNA was purified from
sorted cells using the RNeasy Mini kit, and microarrays
were performed as described above.
Statistical analyses
All microarray cluster analyses were displayed using Java
Treeview version 1.1.3. Average linkage hierarchical
clustering was performed using Cluster v2.12 [20]. Biologic analysis of microarray data was performed with the
DAVID annotation tool [29]. ANOVA and Student’s
t-tests for gene expression data, Fisher’s exact test for
neoadjuvant clinical data, c2 tests for pathological data,
and the Cox model were performed using R [30]. Survival curves were calculated by the Kaplan-Meier method
and compared by the log-rank test using WinStat
v2007.1. Reported P values are two-sided.
Results
Molecular characterization of the claudin-low breast
tumor subtype
To identify the molecular characteristics of claudin-low
tumors, we created a large genomic data set by combining three of our previously published data sets
[5,6,9] and included 37 new tumor samples (n = 337;
UNC337, GEO series GSE18229). Hierarchical clustering analysis of this data set using the ~1,900 intrinsic
gene list of Parker et al. [9] identified the major intrinsic molecular subtypes, including the claudin-low subtype (Figure S1 in Additional file 1). The validity of
the claudin-low sample cluster was confirmed by parsing the dendogram with SigClust [22] (P < 0.001);
notably, this clustering analysis placed the claudin-low
tumors in close proximity to the basal-like subtype and
was composed of 32 arrays, representing 32 patients
(~12% of all patients). Compared to the luminal A,
luminal B, HER2-enriched, and basal-like subtypes,
claudin-low tumors showed inconsistent expression of
basal keratins (keratins 5, 14 and 17) and low expression of HER2 and luminal markers such as ER, PR,
GATA3, keratins 18 and 19 and the luminal gene cluster (Figure 1a). Despite the apparent similarity to
basal-like tumors, claudin-low tumors as a group did
not show high expression of proliferation genes and
thus are likely slower-cycling tumors. Indeed, significantly lower messenger RNA (mRNA) expression of
the cell cycle gene Ki67 was observed in claudin-low
Page 4 of 18
tumors when compared with basal-like tumors (P <
0.0001, Student’s t-test; Figure S2 and Table S1 in
Additional file 1).
To better characterize the claudin-low molecular subtype, we identified those genes differentially expressed in
claudin-low tumors compared with other tumors or
subtypes. We found 1,308 and 359 genes significantly
higher and lower in expression in claudin-low tumors,
respectively (Table S2 in Additional file 1). Overall, claudin-low tumors highly expressed genes involved in
immune system response (i.e. CD79b, CD14 and vav1),
cell communication (chemokine [C-X-C motif] ligand
12), extracellular matrix (vimentin, fibroblast growth
factor 7), cell differentiation (Krüppel-like factor 2,
interleukin 6), cell migration (integrin a5, moesin) and
angiogenesis (vascular endothelial growth factor C,
matrix metallopeptidase 9) [29]. Conversely, expression
of various epithelial cell-cell adhesion genes such as
claudin 3, claudin 4, claudin 7, occludin and E-cadherin
was significantly lower as previously reported [5] (Figure
1b). Further immunohistochemical analysis of 103 breast
tumors of the UNC337 data set revealed that compared
to the basal-like subtype, the claudin-low tumor subtype
had a preponderance for low to absent expression of
E-cadherin and claudin 3 (45% vs. 11% for E-cadherin,
P < 0.05; 59% vs. 11% for claudin 3, P < 0.005; c2 test).
Similarly, when compared to all other tumors (basallike, HER2-enriched, luminal A, luminal B and normal
breast-like) as a single group, the claudin-low tumor
subtype maintained its characteristic for low to absent
expression of E-cadherin and claudin 3 (45% vs. 15% for
E-cadherin, P < 0.005; 59% vs. 22% for claudin 3, P <
0.001; c2 test) (Figure S3 in Additional file 1).
Concordant with the expression of markers of
mesenchyme and immunity, we observed high expression of stromal-specific and lymphocyte- or granulocytespecific gene signatures in claudin-low tumors compared
to the other intrinsic subtypes [16,17,19] (Figure 1b,
Figure S2 in Additional file 1). These findings, together
with the low expression of epithelial cell-cell adhesion
molecules such as E-cadherin, are consistent with an
EMT (changes in cell phenotype between epithelial and
mesenchymal states) [31] in claudin-low tumors and a
potential recruitment of multiple types of leukocytes
into these tumors.
We next explored the mRNA expression of the TIC
gene markers CD44 and CD24 and cell surface markers
of epithelial differentiation such as MUC1, CD49f, and
epithelial cell adhesion molecule (EpCAM) across the
intrinsic subtypes (basal-like, claudin-low, luminal A,
luminal B, HER2-enriched) and the normal breast-like
group to determine their differentiation status. Overall,
claudin-low tumors showed low mRNA expression of
differentiated luminal cell surface markers (CD24,
Prat et al. Breast Cancer Research 2010, 12:R68
http://breast-cancer-research.com/content/12/5/R68
Page 5 of 18
Figure 1 Average expression of important genes and gene signatures across the intrinsic breast cancer subtypes. (a) Classical markers
used to characterize breast tumors are shown for mRNA expression levels for basal markers (keratins 5 [KRT5], 14 [KRT14] and 17 [KRT17]),
luminal markers (keratins 18 [KRT18] and 19 [KRT19]), ER (ESR1), PR, GATA3 and HER2 (ERBB2). Right: Box-and-whisker plot for expression of the
luminal and proliferation gene signatures. (b) Markers of EMT (vimentin [VIM], Snail-1 [SNAI1], Snail-2 [SNAI2], TWIST1, TWIST2, ZEB1, ZEB2,
E-cadherin [CDH1], and claudins 3 [CLDN3], 4 [CLDN4] and 7 [CLDN7]). Right: expression of stromal- and immune-related signatures [16,17]. (c)
Markers of stem cells/TICs/epithelial differentiation (CD44, CD24, EpCAM, CD10, CD49f, CD29, MUC1, THY1, and ALDH1A1). Right: Previously
published stem cell-like signature [7]. Each colored square on the left side represents the relative mean transcript abundance (in log2 space) for
each subtype with highest expression being red, average expression being black, and lowest expression being green. BL, basal-like; CL, claudinlow defined by SigClust [22]; H2, HER2-enriched; LA, luminal A; LB, luminal B; NBL, normal breast-like. P values shown were calculated by
comparing gene expression means across all subtypes.
EpCAM and MUC1), while markers CD44 and CD49f
were higher when compared to differentiated luminal
tumors (P < 0.05, Student’s t-test; Figure 1c, Figure S2
in Additional file 1). The expression pattern of these
gene markers is concordant with CD44+/CD24-/low and
CD49f+/EpCAM-/low antigenic phenotypes, which have
been previously shown to be enriched in breast TICs
[32,33] and mammary stem cells (MaSCs) [24]. Second,
we observed that claudin-low tumors compared to the
other tumor subtypes, except for the normal breast-like
group, showed the highest mRNA expression of
ALDH1A1, which has recently been proposed to be
another marker of breast stem cells and TICs [34] but
also noted in stromal cells [24,34,35]. Conversely, basallike tumors did not show significantly lower expression
of CD24 as a group, nor did they show high mRNA
expression of ALDH1A1 (Figure 1b and Figure S2 in
Additional file 1). This contrasts with other studies that
have linked the basal-like subtype with stem cell- or
embryonic cell-like features [36,37]; however, these
Prat et al. Breast Cancer Research 2010, 12:R68
http://breast-cancer-research.com/content/12/5/R68
other studies did not examine claudin-low tumors as a
separate group, and in the absence of a claudin-low predictor, claudin-low tumors are typically classified as
basal-like (or normal breast-like) by the PAM50 gene
expression assay [9].
To further explore the potential enrichment for breast
stem cells and TIC features, we evaluated the expression
of three breast stem cell-like signatures [7,15,18] across
the different subtypes. All signatures were highly
enriched (P < 0.0001, Student’s t-test; Supplementary
Material in Additional file 2) in the claudin-low subtype
despite the various derivations used of each signature
(Figure 1c, Figure S2 in Additional file 1). Interestingly,
these three stem cell-like signatures were representative
of distinct gene expression subsets, among which < 10%
of the genes overlapped. These data suggest that different biological processes associated with TICs converge
in the claudin-low tumor subtype.
Identification of the claudin-low profile in a panel of
breast cancer cell lines
To investigate if potential in vitro counterparts for these
tumors exist, we analyzed a data set of 52 breast cancer
cell lines [21] by hierarchical cluster analysis using our
most recent human breast tumor intrinsic classification
Page 6 of 18
list [9]. The three major subgroups (luminal, basal B
and basal A) identified previously by Neve et al. [21]
were evident, with nine basal B cell lines clustering
together with a node correlation of 0.59 (Figure S4 in
Additional file 1). These cell lines showed low expression of the ER, HER2 and claudin 3, claudin 4 and claudin 7 (Figure S4 in Additional file 1). We identified
those genes whose expression distinguished each human
tumor subtype using significance analysis of microarrays
(SAM) in our UNC337 tumor database, including a list
defining the normal breast-like group (Figure 2a). These
nine cell lines (MDA-MB-435, MDA-MB-436, Hs578T,
BT549, MDA-MB-231, MDA-MB-157, SUM1315MO2,
SUM159PT and HBL100) showed a gene expression
pattern similar to the claudin-low tumor subtype with
the lowest expression of genes involved in epithelial
cell-cell adhesion (i.e., E-cadherin and claudins 3, 4 and
7), luminal differentiation (i.e., CD24, EpCAM) and high
values for the CD44/CD24 and CD49f/EpCAM mRNA
ratios (Figure S4, Table S3 in Additional file 1). To complement these clustering analyses, we developed a claudin-low centroid-based predictor using the UNC337
tumor data set and the SigClust-defined claudin-low
group versus all others, and objectively classified the 52
cell lines as claudin-low or not; as expected, the human
Figure 2 Identification of the claudin-low subtype in a panel of breast cancer cell lines. Gene clusters that characterize each primary
human tumor subtype are shown in the human and cell line gene expression data sets. In both data sets, array trees have been derived by
unsupervised hierarchical clustering using the intrinsic list from Parker et al. [9] as shown in Figure S1A and S4A in Additional file 1. (a) The top
50 upregulated genes associated with each molecular subtype, including the top 50 downregulated genes in claudin-low tumors, are shown in
the UNC337 database. Top genes were selected after performing a two-class SAM (FDR = 0%) between each molecular subtype versus others.
Luminal A and B subtypes were combined into the luminal subtype. In the tree, the yellow node denotes the claudin-low tumors defined by
SigClust [22]. (b) Gene clusters characteristic of each tumor molecular subtype are shown in 52 breast cancer cell lines from Neve et al. [21].
Missing genes have been omitted. In the tree, the yellow node denotes the most highly correlated cell lines that best resemble the claudin-low
subtype. 1 (yellow), claudin-low gene cluster of upregulated and downregulated genes; 2 (red), basal-like gene cluster; 3 (pink), HER2-enriched
gene cluster; 4 (green), normal breast-like gene cluster; 5 (blue), luminal gene cluster.
Prat et al. Breast Cancer Research 2010, 12:R68
http://breast-cancer-research.com/content/12/5/R68
tumor-based claudin-low predictor identified these nine
cell lines as claudin-low (Figure S5 in Additional file 1).
The gene cluster that identifies the in vivo defined
normal breast-like group was not differentially
expressed by any of the 52 cell lines, suggesting overall
that none of these cell lines show a normal breast-like
phenotype (Figure 2b). The normal breast-like group of
primary specimens is usually composed of actual normal breast samples and a small number of primary
tumors [9,38], the latter of which we believe show the
high expression of true normal tissue genes due to significant normal breast contamination [9]. In cell culture,
however, there is no such contamination by normal
epithelial or nonepithelial cells, and thus this lack of
contamination may explain why normal breast-like
tumor cell lines are not identified as such by the clustering. To be more objective, we applied a normal
breast centroid-based predictor (normal breast versus all
tumors using the UNC337 database) to the cell line
data, and no cell line was classified as normal breast
(Figure S5 in Additional file 1). Contamination with
other tissues or cells is not uncommon in other tumor
subtypes [1]. For example, within the top highly
expressed genes in claudin-low tumors versus all others,
there are several wound response-related genes (i.e.,
CD28, CD52) that are not expressed by the breast cancer cell lines (Figure 2b), potentially due to significant
immune or stromal cell content in the tumor. Overall,
these data suggest that the nine previously described
breast cancer cell lines are most similar to claudin-low
tumors in in vivo specimens.
Building a Cell-line claudin-low centroid-based predictor
Because primary human claudin-low tumors are highly
enriched for immune system genes (and lymphocytes)
when supervised analyses are performed, the expression
of nonepithelial cell genes would likely increase the false
positivity of the human claudin-low predictor when
applied to other tumor data sets, because, for instance,
tumors would be called claudin-low or not based upon
the high expression of immune cell genes. Therefore, we
developed a claudin-low centroid-based predictor using
the cell line database of Neve et al. [21]. First, we evaluated its accuracy by applying the predictor onto our
human tumor database (UNC337). The nine-cell line
claudin-low predictor identified 37 samples (~11%) as
claudin-low, including the 28 claudin-low samples previously identified by hierarchical clustering. The remaining nine samples identified by the predictor were
previously called basal-like (n = 7), normal breast-like (n
= 1) and HER2-enriched (n = 1) by the PAM50 predictor [9]. Overall, the nine-cell line claudin-low predictor
showed 87.5% sensitivity, 97.0% specificity, and 75.7%
and 98.7% positive and negative predictive values,
Page 7 of 18
respectively, if the SigClust-defined claudin-low group is
considered the gold standard.
We then used the nine-cell line claudin-low predictor to identify this subtype in a mouse tumor database
[5], which represents 13 different mouse models
grouped in 10 different classes on the basis of their
gene expression profiles (Groups I to X). Interestingly,
all claudin-low samples identified by the centroid predictor (n = 9) were included in Group II, which we
previously highlighted for its mesenchymal features
(i.e., spindle-shaped cells). These nine murine claudinlow tumor samples were derived from six different
mouse models (Brca1Co/Co;TgMMTV-Cre;p53+/-,
DMBA-induced, p53-/- transplant, p53+/- IR,
TgMMTV-Neu and TgWAP-T121) and overall showed
similar enrichment for EMT markers and human
mesenchymal and stem cell-like signatures, including
decreased expression of proliferative- and luminalassociated genes (Figure S6 in Additional file 1). No
murine normal mammary tissue sample was classified
as claudin-low. These analyses suggest that a cell line
centroid-based approach, by focusing on genes
expressed in epithelial cells only, might give more
accurate classification of tumors, which could be evaluated in future studies focused on tumor subtyping.
Clinical-pathological characteristics of claudin-low
breast tumors
To determine for the first time the clinical-pathological
characteristics of human claudin-low breast tumors, we
evaluated our breast cancer patient database (UNC337)
and two independent gene expression data sets (NKI295
and MDACC133) [11-13] using the nine-cell line claudin-low predictor and the previously published PAM50
subtype predictor (Figure 3a) because these two objective centroid predictors have been demonstrated to be
the most robust to classify breast tumors into discrete
subtypes. Across all three databases, claudin-low tumors
showed a prevalence of 7 to 14%, and were mostly ER-/
PR-/HER2- (also known as triple-negative tumors, 61 to
71%). Conversely, the majority of triple-negative tumors
were either basal-like (39 to 54%) or claudin-low (25 to
39%), followed by HER2-enriched (7 to 14%), luminal B
(4 to 7%), luminal A (4 to 5%) and normal breast-like
(1%). In terms of prognosis, Kaplan-Meier survival analysis revealed that claudin-low tumors have a worse
prognosis compared to luminal A tumors in both the
UNC337 (hazard ratio [HR] of 2.83 and 5.66 for
relapse-free survival [RFS] and overall survival [OS],
respectively; P < 0.05) and NKI295 data sets (HR of 4.71
and 17.98 for RFS and OS, respectively; P < 0.001). Conversely, similar survival curves were observed between
claudin-low tumors and the other poor prognosis subtypes such as luminal B, HER2-enriched and basal-like
Prat et al. Breast Cancer Research 2010, 12:R68
http://breast-cancer-research.com/content/12/5/R68
Page 8 of 18
Figure 3 Clinical and pathological characteristics and prognosis of all intrinsic subtypes, including claudin-low tumors, across three
independent breast cancer data sets. (a) Percentages of the different clinical-pathological characteristics in the UNC337 data set and two
publicly available data sets (NKI295 and MDACC133). ER/PR/HER2 scores of the UNC337 database were based on clinically validated methods.
(b) Survival data of the different molecular subtypes are shown for the UNC337 database and NKI295. Normal breast-like samples have been
removed from this analysis. The UNC337 set represents a heterogeneously treated group of patients treated in accord with the biomarker status,
whereas NKI295 is predominantly a local therapy only cohort.
tumors (Figure 3b). Normal breast-like samples were
omitted from survival analyses because they are likely
significantly contaminated by normal breast tissue, and
thus their true tumor biology is masked.
We also evaluated the potential association between
claudin-low tumors and treatment response by using the
MDACC breast cancer patient data set (133 pretreated
samples) of tumors treated with neoadjuvant anthracycline/taxane-based chemotherapy [13]. Notably, claudinlow tumors showed a lower pathological complete
response (pCR) rate after anthracycline/taxane-based
chemotherapy compared to basal-like tumors (38.9% vs.
73.3% pCR rates; P = 0.08, Fisher’s exact test), but their
pCR rate was higher than luminal A or B tumors;
interestingly, the apparent pCR rate of the basal-like
tumors increased from 59% (reported in Parker et al. [9])
to ~73% when the claudin-low subtype was included,
because among 18 claudin-low tumors identified in this
set, 12 (67%) of 18 of them were previously identified as
basal-like and the response rate of this subgroup of
patients was 41.7%. These findings suggest that claudinlow tumors show some chemotherapy sensitivity but
overall have a poor prognosis and may not be managed
effectively with existing chemotherapy regimens.
Twenty-one claudin-low samples were examined histologically by a pathologist (CL; Table S4 in Additional
file 1) to further clinically characterize claudin-low
tumors. Among the samples evaluated, 9 (43%) of 21
Prat et al. Breast Cancer Research 2010, 12:R68
http://breast-cancer-research.com/content/12/5/R68
had noteworthy histological differentiation patterns,
including medullary-like features (5/21, 24%) such as
pushing margins and brisk tumor lymphocytic infiltration, two samples (2 of 21, 10%) showed metaplastic differentiation, one sample showed mixed ductal/lobular
features, and one sample was a pure micropapillary carcinoma. The remaining 12 samples (12 of 21, 57%) were
invasive ductal carcinomas not otherwise specified.
Overall, lymphoid infiltration was evident in a total of
seven samples (total of 7 of 19, 37%), which might
explain the high mRNA expression of immune response
genes present in these tumors. Among the other claudin-low samples that could not be examined histologically (n = 16), 50% (8/16) had a previous diagnosis of
metaplastic tumors. It is interesting to note that two
claudin-low cell lines, Hs578T and MDA-MB-157, were
derived from metaplastic [39] and medullary [40]
carcinomas.
Since the pathological examination of claudin-low
tumors identified special histological features, we applied
the nine-cell line claudin-low predictor to a publicly
available database of histologically diverse subtypes of
breast cancer (n = 113, NKI113) [14], which includes 10
medullary carcinomas, 20 metaplastic carcinomas and
Page 9 of 18
22 invasive lobular carcinomas (ILC). Indeed, 8 (57%) of
14 and 2 (14%) of 14 claudin-low samples were identified as metaplastic and medullary carcinomas, respectively (Figure 4f and Table S5 in Additional file 1).
Conversely, only 2 of a total of 22 ILCs were identified
as claudin-low despite the lack of E-cadherin expression
in lobular tumors [41].
Claudin-low subtype resembles the MaSC profile
We hypothesized, as did Lim et al. [24], that a mammary differentiation program starting from a MaSC ®
luminal progenitor (pL) ® mature luminal cells (mLs)
exists, and therefore we built a differentiation model
using data from Lim et al. [24]. For this predictor,
higher scores represent greater differentiation status
along this axis that culminates in ER+ mLs (Figure 4a).
First, we applied this predictor onto similar subpopulations of purified human mammary epithelial cells that
were separated by fluorescence-activated cell sorting
(FACS) and profiled as part of the independent study
of Raouf et al. [23] using different surface makers (Figure S7 in Additional file 1). The differentiation predictor showed 100% (8 of 8) accuracy with the bipotent
progenitor subpopulation from Raouf et al. [23]
Figure 4 Epithelial differentiation score analysis of normal mammary tissue, human breast tumors, human cell lines and mouse
mammary tumors. (a) Differentiation axis based on Lim et al. [24] data. (b) Mammospheres (MMS; n = 14) derived from normal breast tissue.
Yellow crosses identify claudin-low MMS (n = 6, 43%) as defined by the nine-cell line claudin-low predictor. (c) Tumors and the normal breastlike group from the UNC337 database. (d) Breast cancer cell lines. Except for the nine claudin-low cell lines, we used the subtype calls (luminal
[L] and basal [B]) as reported in Neve et al. [21]. (e) Mouse tumors from Herschkowitz et al. [5]. (f) Histological special types of breast cancer
obtained from the NKI113 database [14]. Colored dots or boxes denote the subtype cells. IDC with OGC, invasive ductal carcinoma with
osteoclastic giant cells; ILC, invasive lobular carcinoma; BL (red), basal-like; CL (yellow), claudin-low defined by the nine-cell line claudin-low
predictor; H2 (pink), HER2-enriched; LA (dark blue), luminal A; LB (light blue), luminal B; NBL (green), normal breast-like. *P < 0.0001.
Prat et al. Breast Cancer Research 2010, 12:R68
http://breast-cancer-research.com/content/12/5/R68
[CD49f +(MUC1/CD133)- (CD10/THY1) +] showing the
lowest differentiation score (and thus most similar to
the MaSC fraction of Lim et al. [24]), followed by the
luminal-restricted progenitor [CD49f+(MUC1/CD133)
+
(CD10/THY1) - ] and then the mLs [CD49f - (MUC1/
CD133) + (CD10/THY1) - ]. In addition, we established
and expression-profiled mammosphere cultures
obtained from 14 different normal breast tissues
because these cultures enrich for cells with stem or
self-renewal capacity [15]. As expected, mammospheres
showed a low differentiation score close to the MaSC
profile (Figure 4b).
Notably, and as shown by Lim et al. [24], the breast
cancer subtypes segregate along the normal mammary
epithelial differentiation hierarchy starting with undifferentiated claudin-low tumors, followed by basal-like,
then HER2-enriched tumors, and finally both luminal
tumor subtypes (Figure 4c). As expected, we observed
the same pattern using the breast cancer cell line data
[21] (Figure 4d). Conversely, the nine-cell line claudinlow predictor identified the MaSC and stromal
(CD49flow/EpCAM-) subpopulations of Lim et al. [24]
as claudin-low, and as expected, both subpopulations
showed the highest and lowest expression of the upand downregulated genes that define the nine-cell line
claudin-low predictor (Figure S8 in Additional file 1).
Moreover, we applied the differentiation predictor to
the mouse data set of Herschkowitz et al. [5] (Figure
4e) and observed that the previously identified claudinlow murine samples scored the lowest, while the
MMTV-Neu and MMTV-PyMT models, which are
known luminal mammary adenocarcinoma models,
scored the highest. In addition, among 113 histological
special types of breast cancer [14], medullary, adenoid
cystic and metaplastic tumors showed the lowest score
in the differentiation axis (Figure 4f), which is consistent with our previous reports of commonalities
between metaplastic carcinomas, claudin-low tumors
and breast cancer TICs [6].
Finally, we evaluated the prognostic ability of the
differentiation predictor in the UNC337 and NKI295
breast cancer patient data sets. Low differentiation
scores were statistically significantly associated with
poorer RFS and OS in univariate (Figure 5a) and multivariate analyses after adjusting for the main clinicalpathological parameters (i.e., size, grade, node and ER
status), including tumor subtype (Figure 5b). These
data suggest that tumors with an undifferentiated
phenotype similar to the normal MaSC and/or early
progenitors have a poorer prognosis compared to
tumors with a more mature luminal phenotype, and
this association is independent of the luminal B and
HER2-enriched subtypes and the common clinical
variables.
Page 10 of 18
Claudin-low and basal-like tumors are enriched with
undifferentiated or mesenchymal cells
Next, we sought to determine whether tumor cells with
undifferentiated or mesenchymal features (as defined by
immunofluorescence) exist within the different breast
cancer intrinsic subtypes, similar to that performed by
Creighton et al. [7]. Eighty-six breast tumors and one
normal breast sample from the UNC337 database,
including 20 claudin-low tumors, were evaluated using
dual immunofluorescence (IF) staining with epithelial
(keratin 5/19) and mesenchymal (vimentin) markers.
Staining of the normal breast sample revealed that the
antibody to vimentin stains the mesenchyme or stroma,
whereas the antibody to keratin 5/19 stains the ducts,
and no dual positive cells were seen (Figure 6). Conversely, 33% (28 of 86) of all tumor samples showed some
degree of dual positivity, but 89% (25 of 28) of all samples with dual immunofluorescence positivity were
either claudin-low (n = 11) or basal-like (n = 14). The
remaining dual positive samples were identified in the
HER2-enriched (n = 1) and luminal A subtypes (n = 2).
Claudin-low tumors showed higher percentages of dual
positive tumors than the other tumor subtypes when
these are considered as a group (55% vs. 26%; P = 0.014,
c2 test); however, no statistically significant differences
in dual positivity were observed between claudin-low
and basal-like tumors (55% vs. 78%; P = 0.14, c2 test).
These data show that some epithelial tumor cells
express mesenchymal features, these features are not
due to contamination by adjacent stromal cells and
almost all tumors with these features are basal-like or
claudin-low tumors.
We attempted to identify undifferentiated/mesenchymal epithelial cells within breast cancer cell lines. First,
we analyzed the expression of surface markers CD49f
and EpCAM (chosen based upon the studies of Lim et
al. [24]) in three different cell lines: MCF-7 (luminal),
SUM149PT (basal-like) and SUM159PT (claudin-low)
(Figure 7). As expected on the basis of our previous
genomic analysis of the differentiation status of these
cell lines, virtually all claudin-low SUM159PT cells
showed a stromal or MaSC antigenic phenotype (CD49f
+
/EpCAM-), ~98% of MCF-7 cells showed a mL phenotype (CD49f -/low /EpCAM + ), and ~83% of SUM149PT
cells showed a pL phenotype (CD49f + /EpCAM +/high ).
About 10% and ~2% of cells from SUM149PT and
MCF-7 cell lines, respectively, showed low expression of
EpCAM, suggesting that some cells within basal-like
and luminal cell lines might have a more undifferentiated state. However, a clear EpCAM-/low subpopulation
was identified only in the SUM149PT cell line.
To further determine the differentiation status of the
various cell subpopulations within MCF-7 (CD49f - /
EpCAM+, CD49f+/EpCAM+, and CD49f-/lowEpCAM-/low),
Prat et al. Breast Cancer Research 2010, 12:R68
http://breast-cancer-research.com/content/12/5/R68
Page 11 of 18
Figure 5 RFS and OS of breast cancer patients based on the differentiation tumor status. (a) Kaplan-Meier RFS and OS curves for UNC337
and NKI295 cohorts. Patients were rank-ordered and divided into two equal groups (low scores/differentiation in red and high scores/
differentiation in black). (b) A combined multivariate analysis stratified by cohort was performed to test for significance of the differentiation
status (as a continuous variable) conditioned on tumor intrinsic subtype, tumor size, histological grade, node status and ER. HR, hazard ratio; CI,
confidence interval.
Prat et al. Breast Cancer Research 2010, 12:R68
http://breast-cancer-research.com/content/12/5/R68
Page 12 of 18
Figure 6 Keratin 5/19 (red) and vimentin (green) immunofluorescence (IF) staining of 86 breast tumors, including 20 claudin-low
tumor samples identified using the nine-cell line claudin-low predictor. (a) Microscopic picture examples of individual and dual IF staining
in one claudin-low sample with dual positive cells, and luminal A and normal breast samples without dual positive cells. (b) Tables summarizing
the percentages of samples with negative and positive dual staining and the statistics.
Prat et al. Breast Cancer Research 2010, 12:R68
http://breast-cancer-research.com/content/12/5/R68
Page 13 of 18
Figure 7 FACS of breast cancer cell lines and characterization of their differentiation status. (a) Expression of EpCAM and CD49f in MCF-7
(luminal), SUM149PT (basal-like) and SUM159PT (claudin-low) cell lines. The gates shown in each cell line (gray squares) represent the different
sorted subpopulations that were further evaluated. (b) Differentiation scores of the different cell sorted subpopulations. Means and SD are
shown for each subpopulation. Only significant P values (P < 0.05) are shown. (c) Gene expression analyses of the two FACS-sorted
subpopulations within SUM149PT. A paired two-class SAM (FDR < 5%) was performed between both subpopulations in three independent
experiments. (d) In vitro differentiation of CD49f+/EpCAM-/low SUM149PT cells. The two SUM149PT sorted cell subpopulations were grown in vitro
under the same conditions as before FACS. After 7-11 days in culture, expression of CD49 and EpCAM was reanalyzed in both subpopulations
using FACS. Blue, MCF-7-sorted cell fractions; red, SUM149PT CD49f+/highEpCAM+-sorted subpopulation; orange, SUM149PT CD49f+/EpCAM-/lowsorted subpopulation; yellow, SUM159PT-sorted cell fractions. Similar results were obtained with and without supplemental FBS in the SUM149PT
cell line.
SUM149PT (CD49f+/high/EpCAM+ and CD49f+/EpCAM-/
) and SUM159PT (CD49f -/low /EpCAM - and CD49f
+/high
/EpCAM-), we sorted and profiled these seven subpopulations using gene expression microarrays. The
EpCAM -/low cells derived from MCF-7 or SUM149PT
lines showed a statistically significant undifferentiated
low
state when compared with their EpCAM+/high cell counterparts (Figure 7b); however, for MCF-7 cells, the EpCAM-/
low
cells still showed high differentiation scores. Conversely, the CD49f+ /EpCAM -/low cells from the basal-like
SUM149PT cell line showed the presence of a mesenchymal/claudin-low-like gene expression profile, with
Prat et al. Breast Cancer Research 2010, 12:R68
http://breast-cancer-research.com/content/12/5/R68
high expression of genes involved in wound response (i.e.,
interleukin 6, chemokine [C-X-C motif], ligand 1),
angiogenesis (i.e., VEGFA) and extracellular matrix (i.e.,
vimentin, SNAI1), while genes involved in luminal differentiation (i.e., keratin 19, CD24) and cell-cell adhesion
such as E-cadherin or claudin 7 were low (Figure 7c and
Supplemental Data in Additional file 2). Since both claudin-low (CD49f+/EpCAM-/low) and basal-like (CD49f+/high/
EpCAM+) cells exist within the SUM149PT cell line, we
wished to determine whether one cell type gave rise to the
other. When sorted and plated separately, 5 to 10% of the
CD49f + /EpCAM -/low SUM149PT cells differentiated
into CD49f+/high/EpCAM+ basal-like cells, whereas the
CD49f+/high/EpCAM+ basal-like cells maintained their differentiated status during in vitro culture (Figure 7d).
Discussion
Here, claudin-low tumors were comprehensively characterized, and many important biological and clinical features were identified. Specifically, we addressed four
topics for claudin-low tumors including (1) molecular
features, (2) clinical and histological characteristics, (3)
relation to established breast cancer cell lines and
genetically engineered mouse models and (4) differentiation status based on analyses of purified normal mammary epithelial cell subpopulations.
Molecular characterization of the claudin-low subtype reveals that these tumors are significantly enriched
in EMT and stem cell-like features while showing a low
expression of luminal and proliferation-associated
genes. Among these molecular characteristics, EMT
and stem cell features have recently been linked to one
another [18,33,42,43]. Indeed, expression of EMT-inducing transcription factors SNAI1 [33] or TWIST1 [33]
or repression of E-cadherin [43] in mammary epithelial
cells increases the number of stem cells, and these and
other EMT-inducing transcription factors such as
ZEB2 and TWIST2, as well as the mesenchymal
marker vimentin, are expressed at higher levels in
CD44+CD24-/low stem cell-like cells than in more differentiated epithelial CD44-CD24+ cells [18,33]. Consistent with this finding, we observed a high mRNA
expression of known transcriptional repressors of Ecadherin such as SNAI1, SNAI2, TWIST1, TWIST2,
ZEB1 and ZEB2, and other EMT-inducing factors such
as hypoxia-inducible factor-1a in claudin-low tumors
[31] (Figure 1b, Figure S2 in Additional file 1). Thus,
our data suggest that claudin-low tumors, compared
with the other intrinsic breast tumor subtypes, are the
most enriched for stem cell and/or TIC features, and
on the basis of our vimentin immunofluorescence
staining, it appears that these mesenchymal features
are present within epithelial cells, which is a feature
not seen in normal breast tissues.
Page 14 of 18
Acquisition of EMT and/or stem cell-like biological
processes has been associated with therapeutic resistance [7,43,44]. We observed that claudin-low tumors
do show a lower pCR rate than basal-like tumors (Figure 3a); however, the pCR rate of claudin-low tumors
was roughly equivalent to that of the HER2-enriched
subtype (without anti-HER2 therapies) and much higher
than luminal A or luminal B tumors. Thus, as has been
described for basal-like tumors [4], claudin-low tumors
show some chemotherapy sensitivity, yet patients with
these tumors still have poor survival outcomes overall
(Figure 3b). A potential explanation for this similar scenario of basal-like and claudin-low tumors is that chemoresistant cells with TIC or mesenchymal properties
are present at diagnosis in these two tumor subtypes as
suggested by our immunofluorescence dual staining
(Figure S9 in Additional file 1). This is also in concordance with a previous immunohistochemical study of
491 breast tumors where high expression of mesenchymal markers (i.e., vimentin, N-cadherin) and low expression of CDH1 were found almost exclusively in the
triple-negative subgroup of tumors [45]. However, our
treatment response data suggest that these tumor cells
with mesenchymal properties within basal-like and claudin-low subtypes might not have the same treatment
sensitivity to anthracycline/taxane-based chemotherapy.
Thus, further studies are needed to better characterize
the treatment sensitivity of claudin-low and basal-like
tumors to specific chemotherapeutics and/or targeted
therapies. The claudin-low nine-cell line centroid predictor developed here will assist immediately in identifying the claudin-low subtype and its possible predictive
value in any neoadjuvant clinical trial with associated
microarray data. However, we acknowledge a potential
caveat of the nine-cell line claudin-low predictor, which
is that tumors with high stromal content might also be
identified as claudin-low. It is possible that the signature
set of genes that are high in claudin-low tumors (and
cell lines) are also high in nonepithelial cells, including
fibroblasts and other mesenchyme-derived cells. Thus,
we cannot rule out the possibility that some of the claudin-low tumors identified in this study are tumors with
low epithelial and high myofibroblast content. It is also
possible that this signature is one that can occur within
epithelial cells, within stromal cells, or both. Special
attention to the percentage of tumor cellularity of the
sample being analyzed and/or strategies that can differentiate tumor cells with mesenchymal properties (i.e.,
immunoflourescence assays) from normal or tumorassociated fibroblasts with mesenchymal properties are
needed for the further evaluation of this signature.
Finally, from a translational point of view, it is interesting to note that the publicly available NCI-60 in vitro
drug-screening database includes six breast cancer cell
Prat et al. Breast Cancer Research 2010, 12:R68
http://breast-cancer-research.com/content/12/5/R68
lines, four of which are claudin-low (BT549, MDA-MB231, MDA-MB-435 and Hs578T) and two of which are
luminal (MCF-7 and T47D). Among them, MDA-MB435 cells have been shown to have melanoma characteristics [46], which is still a controversial topic [47].
Nonetheless, there is a need to develop better screening
programs of drug sensitivity in breast cancer cell lines
that resemble the basal-like subtype, as this subtype is
missing from the NCI-60 set.
Invasive ductal, metaplastic and medullary or medullary-like claudin-low carcinomas share important biological relationships as defined by gene expression,
suggesting that yet to be discovered common oncogenic
changes might exist. Metaplastic and medullary carcinomas both have a high incidence of methylation of
BRCA1 [48,49], and ~50% of breast tumors from
BRCA1 mutation carriers show medullary-like features
[50]. In addition, MDA-MB-436 and SUM1315MO2
claudin-low cell lines have mutations in BRCA1 [51].
Moreover, we have shown that BRCA1 mutant basallike SUM149PT cell line has a small subpopulation of
cells with mesenchymal/claudin-low-like features, and
that these cells give rise to the basal-like cells that dominate these cultures. These data suggest that BRCA1 deficiency, which has been implicated in the differentiation
of MaSC or bipotent progenitors into ER-positive luminal cells [52], might also contribute to the development
or progression of undifferentiated claudin-low tumors
and cell lines.
Although we have not performed functional tumor
cell repopulating assays on human claudin-low tumors
to show their enrichment for TICs because of the low
incidence of these tumors (i.e., ~7 to 14%), there is,
however, evidence that the claudin-low cell lines identified here show stem cell properties and may be highly
enriched for TICs. For example, Charafe-Jauffret et al.
[53] reported that in addition to having EMT features
and high expression of stem cell markers such as
ALDH1, many of these cell lines contain functional
TICs. This is in concordance with another report [54]
that showed that MDA-MB-231, SUM159PT and
SUM1315MO2 have a high proportion (>90%) of CD44
+
/CD24-/low cells, and that the CD44+/CD24-/low subpopulation obtained from these cell lines was capable of
self-renewal, forming tumors in nonobese diabetic
severe combined immunodeficient mice, and were more
resistant to chemotherapy.
Lim et al. [24] delineated a human mammary epithelial hierarchy by performing cell sorting on the basis of
two cell surface markers (CD49f and EpCAM) and a
series of in vitro and in vivo experiments, including
gene expression profiling of different subpopulations of
the normal breast. Using their microarray data, we
developed a genomic differentiation predictor that
Page 15 of 18
classifies breast tumors on the basis of their differentiation status along a continuous MaSC ® pL ® mL
epithelial hierarchy. We observed that the information
provided by the differentiation status adds prognostic
value even when considered with intrinsic subtype and
the classical clinical variables. However, as developmental studies further characterize the normal mammary
differentiation hierarchy, approaches such as the one
reported here can be improved. For example, much less
is known about other cell types in the normal breast,
such as the myoepithelial progenitors and other potential intermediate progenitors, which may be responsible
for the development of other rare breast cancer subtypes
such as medullary carcinomas. Finally, a similar genomic
approach based on FACS data coming from other developmental studies such as the ones by Lim et al. [24] or
Raouf et al. [23] might prove useful in leukemia [55] or
other solid tumors [56], where similar differentiation
hierarchies have been identified, and thus this differentiation predictor algorithm may show benefit in cancers
other than breast cancer.
Integration of the claudin-low tumor subtype together
with the known intrinsic subtypes delineates a differentiation hierarchy that resembles the normal epithelial
development. These data point to different cells of origin for each intrinsic subtype, or different stages of
developmental arrest for each subtype with a common
cell type of transformation, or some combination of the
two as different processes may be occurring for each different subtype. Indeed, Lim et al. [24] suggested that the
potential cell of origin of the basal-like subtype in
BRCA1 carriers might be the pL instead of the MaSC.
Alternatively, as suggested by our in vitro analyses of
the SUM149PT cell line, BRCA1-mutated basal-like
tumors might arise from transformation of a MaSC that
is similar to claudin-low tumors or cell lines, but the
claudin-low tumors stay arrested in this undifferentiated
state, while MaSC or claudin-low cells in basal-like
tumors are able to divide asymmetrically and give off
differentiated progeny that then arrest at the pL state
[57]. The therapeutic implication of the claudin-low
subtype will require additional retrospective and prospective evaluations, but what does appear clearer is
that the intrinsic subtypes of breast cancer may be
reflective of distinct stages of mammary epithelial cell
development and that the claudin-low tumors (and cell
lines) show the least differentiated phenotype.
Conclusions
It has become appreciated that breast cancer is not one
disease, but in fact represents multiple disease types,
each of which may require a unique treatment. In this
article, we characterize an important new disease group,
namely the claudin-low subtype of breast cancer, and
Prat et al. Breast Cancer Research 2010, 12:R68
http://breast-cancer-research.com/content/12/5/R68
show that these tumors have a poor prognosis and features of mesenchymal and mammary stem cells. We
also provide new tools for the identification and study
of this subtype in tumors and cell lines.
Additional material
Additional file 1: Supplementary Tables S1-S5 and Supplementary
Figures S1-S10. Table S1. Biological processes and signaling pathways
enriched in claudin-low vs. basal-like tumors. Table S2. Biological
processes and signaling pathways enriched in claudin-low tumors vs.
rest. Table S3. Identification of the claudin-low subtype in a panel of
breast cancer cell lines. Table S4. Histological examination of claudin-low
tumors. Table S5. Evaluation of the intrinsic breast cancer molecular
subtypes in histologically diverse types. Figure S1. Intrinsic unsupervised
hierarchical clustering of the UNC337 database. Figure S2. Average
expression of additional selected genes and gene signatures across the
breast cancer subtypes. Figure S3. E-cadherin and claudin 3
immunohistochemical staining of breast tumors. Figure S4. Intrinsic gene
set analysis of 52 breast cancer cell lines. Figure S5. Claudin-low tumor
and normal breast predictions in 52 breast cancer cell lines. Figure S6.
Average expression of genes and gene signatures across the various
mouse classes. Figure S7. Differentiation predictions in Raouf et al. [23]
database. Figure S8. Expression of the nine-cell line claudin-low predictor
across different subpopulations of the normal breast. Figure S9. Mean
expression of the top highly expressed (n = 833) and low expressed (n =
642) genes in claudin-low cell lines across 337 human breast tumor
samples classified according to intrinsic subtype, including the normal
breast-like group. Figure S10. Localization of five claudin-low samples
(BC00054, 020018B, BC00075, 010384B, and BC00083) in the UNC337
intrinsic clustering.
Additional file 2: Supplemental Data. Clinical data and gene lists
reported throughout the manuscript.
Abbreviations
BL: basal-like; CDH1: E-cadherin; CL: claudin-low; CLDN3: claudin 3; CLDN4:
claudin 4; CLDN7: claudin 7; DWD: distance-weighted discrimination; EMT:
epithelial-to-mesenchymal transition; EpCAM: epithelial cell adhesion
molecule; ER: estrogen receptor; FACS: fluorescence-activated cell sorting;
FDR: false discovery rate; GEO: Gene Expression Omnibus; H2: HER2-enriched;
HER2: epidermal growth factor receptor 2; HR: hazard ratio; IF:
immunofluorescence; ILC: invasive lobular carcinoma; IRB: Institutional
Review Board; KRT14: keratin 14; KRT17: keratin 17; KRT18: keratin 18; KRT19:
keratin 19; KRT5: keratin 5; LA: luminal A; LB: luminal B; MaSC: mammary
stem cell; mL: mature luminal cell; mRNA: messenger RNA; NBL: normal
breast-like; pCR: pathological complete response; pL: luminal progenitor; PR:
progesterone receptor; RMA: robust multiarray analysis; SAM: significance
analyses microarrays; SNAI1: Snail 1; SNAI2: Snail 2; TIC: tumor-initiating cell;
UNC: University of North Carolina; VIM: vimentin.
Acknowledgements
We thank LB and LWA from the Flow Cytometry Core Facility at UNC for
excellent technical support.
Funding: National Cancer Institute Breast SPORE program grant P50CA58223-09A1, National Cancer Institute grant R01-CA-138255, National
Cancer Institute Work Assignment HHSN-261200433008C grant N01CN43308, Breast Cancer Research Foundation and V Foundation for Cancer
Research. AP is affiliated with the Internal Medicine doctoral program of the
Autonomous University of Barcelona, Spain.
Author details
1
Lineberger Comprehensive Cancer Center, University of North Carolina, 450
West Drive, Chapel Hill, 27599, USA. 2Department of Genetics, University of
North Carolina, 450 West Drive, Chapel Hill, 27599, USA. 3Department of
Pathology & Laboratory Medicine, University of North Carolina, 450 West
Page 16 of 18
Drive, Chapel Hill, 27599, USA. 4Department of Molecular & Cellular Biology,
Baylor College of Medicine, One Baylor Plaza, Houston, 77030, USA.
Authors’ contributions
AP, JSP, OK and CMP contributed to experimental design. AP, JSP, OK, CL,
JIH and XH were responsible for performing experiments. AP, JSP, OK and
CF contributed to data analysis. AP and CMP contributed to manuscript
preparation.
Competing interests
CMP is a major stockholder of BioClassifier LLC and co-founder and
managing partner of University Genomics. CMP and JSP have filed a patent
on the PAM50 assay (University of North Carolina) and on intrinsic subtyping
(University of Utah).
Received: 9 June 2010 Revised: 3 August 2010
Accepted: 2 September 2010 Published: 2 September 2010
References
1. Perou CM, Sorlie T, Eisen MB, van de Rijn M, Jeffrey SS, Rees CA, Pollack JR,
Ross DT, Johnsen H, Akslen LA, Fluge O, Pergamenschikov A, Williams C,
Zhu SX, Lonning PE, Borresen-Dale A-L, Brown PO, Botstein D: Molecular
portraits of human breast tumours. Nature 2000, 406:747-752.
2. Sørlie T, Perou CM, Tibshirani R, Aas T, Geisler S, Johnsen H, Hastie T,
Eisen MB, van de Rijn M, Jeffrey SS, Thorsen T, Quist H, Matese JC,
Brown PO, Botstein D, Eystein Lønning P, Børresen-Dale AL: Gene
expression patterns of breast carcinomas distinguish tumor subclasses
with clinical implications. Proc Natl Acad Sci USA 2001, 98:10869-10874.
3. Carey LA, Perou CM, Livasy CA, Dressler LG, Cowan D, Conway K, Karaca G,
Troester MA, Tse CK, Edmiston S, Deming SL, Geradts J, Cheang MC,
Nielsen TO, Moorman PG, Earp HS, Millikan RC: Race, breast cancer
subtypes, and survival in the Carolina Breast Cancer Study. JAMA 2006,
295:2492-2502.
4. Carey LA, Dees EC, Sawyer L, Gatti L, Moore DT, Collichio F, Ollila DW,
Sartor CI, Graham ML, Perou CM: The triple negative paradox: primary
tumor chemosensitivity of breast cancer subtypes. Clin Cancer Res 2007,
13:2329-2334.
5. Herschkowitz JI, Simin K, Weigman VJ, Mikaelian I, Usary J, Hu Z,
Rasmussen KE, Jones LP, Assefnia S, Chandrasekharan S, Backlund MG, Yin Y,
Khramtsov AI, Bastein R, Quackenbush J, Glazer RI, Brown PH, Green JE,
Kopelovich L, Furth PA, Palazzo JP, Olopade OI, Bernard PS, Churchill GA,
Van Dyke T, Perou CM: Identification of conserved gene expression
features between murine mammary carcinoma models and human
breast tumors. Genome Biol 2007, 8:R76.
6. Hennessy BT, Gonzalez-Angulo A-M, Stemke-Hale K, Gilcrease MZ,
Krishnamurthy S, Lee J-S, Fridlyand J, Sahin A, Agarwal R, Joy C, Liu W,
Stivers D, Baggerly K, Carey M, Lluch A, Monteagudo C, He X, Weigman V,
Fan C, Palazzo J, Hortobagyi GN, Nolden LK, Wang NJ, Valero V, Gray JW,
Perou CM, Mills GB: Characterization of a naturally occurring breast
cancer subset enriched in epithelial-to-mesenchymal transition and
stem cell characteristics. Cancer Res 2009, 69:4116-4124.
7. Creighton CJ, Li X, Landis M, Dixon JM, Neumeister VM, Sjolund A,
Rimm DL, Wong H, Rodriguez A, Herschkowitz JI, Fan C, Zhang X, He X,
Pavlick A, Gutierrez MC, Renshaw L, Larionov AA, Faratian D, Hilsenbeck SG,
Perou CM, Lewis MT, Rosen JM, Chang JC: Residual breast cancers after
conventional therapy display mesenchymal as well as tumor-initiating
features. Proc Natl Acad Sci USA 2009, 106:13820-13825.
8. Hu Z, Fan C, Oh DS, Marron JS, He X, Qaqish BF, Livasy C, Carey LA,
Reynolds E, Dressler L: The molecular portraits of breast tumors are
conserved across microarray platforms. BMC Genomics 2006, 7:96.
9. Parker J, Mullins M, Cheang M, Leung S, Voduc D, Vickery T, Davies S,
Fauron C, He X, Hu Z, Quackenbush J, Stijleman I, Palazzo J, Marron J,
Nobel A, Mardis E, Nielsen T, Ellis M, Perou CM, Bernard PS: Supervised risk
predictor of breast cancer based on intrinsic subtypes. J Clin Oncol 2009,
27:1160-1167.
10. University of North Carolina Microarray Database. [https://genome.unc.
edu/pubsup/breastGEO/clinicalData.shtml].
11. Van’t Veer LJ, Dai H, van de Vijver MJ, He YD, Hart AA, Mao M, Peterse HL,
van der Kooy K, Marton MJ, Witteveen AT: Gene expression profiling
predicts clinical outcome of breast cancer. Nature 2002, 415:530-536.
Prat et al. Breast Cancer Research 2010, 12:R68
http://breast-cancer-research.com/content/12/5/R68
12. Van de Vijver MJ, He YD, van’t Veer LJ, Dai H, Hart AAM, Voskuil DW,
Schreiber GJ, Peterse JL, Roberts C, Marton MJ, Parrish M, Atsma D,
Witteveen A, Glas A, Delahaye L, van der Velde T, Bartelink H, Rodenhuis S,
Rutgers ET, Friend SH, Bernards R: A gene-expression signature as a
predictor of survival in breast cancer. N Engl J Med 2002, 347:1999-2009.
13. Hess KR, Anderson K, Symmans WF, Valero V, Ibrahim N, Mejia JA, Booser D,
Theriault RL, Buzdar AU, Dempsey PJ, Rouzier R, Sneige N, Ross JS,
Vidaurre T, Gomez HL, Hortobagyi GN, Pusztai L: Pharmacogenomic
predictor of sensitivity to preoperative chemotherapy with paclitaxel
and fluorouracil, doxorubicin, and cyclophosphamide in breast cancer. J
Clin Oncol 2006, 24:4236-4244.
14. Weigelt B, Horlings HM, Kreike B, Hayes MM, Hauptmann M, Wessels LFA,
Jong D, Vijver MJ, Veer LJ, Peterse JL: Refinement of breast cancer
classification by molecular characterization of histological special types.
J Pathol 2008, 216:141-150.
15. Dontu G, Abdallah WM, Foley JM, Jackson KW, Clarke MF, Kawamura MJ,
Wicha MS: In vitro propagation and transcriptional profiling of human
mammary stem/progenitor cells. Genes Dev 2003, 17:1253-1270.
16. West RB, Nuyten DS, Subramanian S, Nielsen TO, Corless CL, Rubin BP,
Montgomery K, Zhu S, Patel R, Hernandez-Boussard T: Determination of
stromal signatures in breast carcinoma. PLoS Biol 2005, 3:e187.
17. Palmer C, Diehn M, Alizadeh AA, Brown PO: Cell-type specific gene
expression profiles of leukocytes in human peripheral blood. BMC
Genomics 2006, 7:115.
18. Shipitsin M, Campbell L, Argani P, Weremowicz S, Bloushtain-Qimron N,
Yao J, Nikolskaya T, Serebryiskaya T, Beroukhim R, Hu M, Halushka M,
Sukumar S, Parker L, Anderson K, Harris L, Garber J, Richardson A, Schnitt S,
Nikolsky Y, Gelman R, Polyak K: Molecular definition of breast tumor
heterogeneity. Cancer Cell 2007, 11:259-273.
19. Beck AH, Espinosa I, Gilks CB, van de Rijn M, West RB: The fibromatosis
signature defines a robust stromal response in breast carcinoma. Lab
Invest 2008, 88:591.
20. Eisen MB, Spellman PT, Brown PO, Botstein D: Cluster analysis and display
of genome-wide expression patterns. Proc Natl Acad Sci USA 1998,
95:14863-14868.
21. Neve R, Chin K, Fridlyand J, Yeh J, Baehner FL, Fevr T, Gray J: A collection
of breast cancer cell lines for the study of functionally distinct cancer
subtypes. Cancer Cell 2006, 10:515-527.
22. Liu Y, Hayes DN, Nobel A, Marron JS: Statistical Significance of Clustering
for High-Dimension, Low-Sample Size Data. J Am Stat Assoc 2008,
103:1281-1293.
23. Raouf A, Zhao Y, To K, Stingl J, Delaney A, Barbara M, Iscove N, Jones S,
McKinney S, Emerman J, Aparicio S, Marra M, Eaves C: Transcriptome
analysis of the normal human mammary cell commitment and
differentiation process. Cell Stem Cell 2008, 3:109-118.
24. Lim E, Vaillant F, Wu D, Forrest NC, Pal B, Hart AH, Asselin-Labat M-L,
Gyorki DE, Ward T, Partanen A, Feleppa F, Huschtscha LI, Thorne HJ, Fox SB,
Yan M, French JD, Brown MA, Smyth GK, Visvader JE, Lindeman GJ:
Aberrant luminal progenitors as the candidate target population for
basal tumor development in BRCA1 mutation carriers. Nat Med 2009,
15:907.
25. Stingl J, Eaves C, Kuusk U, Emerman J: Phenotypic and functional
characterization in vitro of a multipotent epithelial cell present in the
normal adult human breast. Differentiation 1998, 63:201-213.
26. Herschkowitz JI, He X, Fan C, Perou CM: The functional loss of the
retinoblastoma tumour suppressor is a common event in basal-like and
luminal B breast carcinomas. Breast Cancer Res 2008, 10(5):R75.
27. Troester MA, Hoadley KA, Sorlie T, Herbert BS, Borresen-Dale AL,
Lonning PE, Shay JW, Kaufmann WK, Perou CM: Cell-type-specific
responses to chemotherapeutics in breast cancer. Cancer Res 2004,
64:4218-4226.
28. Hoadley K, Weigman V, Fan C, Sawyer L, He X, Troester M, Sartor C, RiegerHouse T, Bernard P, Carey L, Perou C: EGFR associated expression profiles
vary with breast tumor subtype. BMC Genomics 2007, 8:258.
29. Dennis G, Sherman BT, Hosack DA, Yang J, Gao W, Lane HC, Lempicki RA:
DAVID: database for annotation, visualization, and integrated discovery.
Genome Biol 2003, 4:P3.
30. The R Project for Statistical Computing. [http://cran.r-project.org].
31. Polyak K, Weinberg RA: Transitions between epithelial and mesenchymal
states: acquisition of malignant and stem cell traits. Nat Rev Cancer 2009,
9:265.
Page 17 of 18
32. Al-Hajj M, Wicha M, Benito-Hernandez A, Morrison S, Clarke M: Prospective
identification of tumorigenic breast cancer cells. Proc Natl Acad Sci USA
2003, 100:3983-3988.
33. Mani SA, Guo W, Liao M-J, Eaton EN, Ayyanan A, Zhou AY, Brooks M,
Reinhard F, Zhang CC, Shipitsin M, Campbell LL, Polyak K, Brisken C, Yang J,
Weinberg RA: The epithelial-mesenchymal transition generates cells with
properties of stem cells. Cell 2008, 133:704-715.
34. Ginestier C, Hur M, Charafe-Jauffret E, Monville F, Dutcher J, Brown M,
Jacquemier J, Viens P, Kleer C, Liu S, Schott A, Hayes D, Birnbaum D,
Wicha M, Dontu G: ALDH1 is a marker of normal and malignant human
mammary stem cells and a predictor of poor clinical outcome. Cell Stem
Cell 2007, 1:555-567.
35. Resetkova E, Reis-Filho J, Jain RK, Mehta R, Thorat MA, Nakshatri H, Badve S:
Prognostic impact of ALDH1 in breast cancer: a story of stem cells and
tumor microenvironment. Breast Cancer Res Treat 2010, 123(1):97-108.
36. Ben-Porath I, Thomson M, Carey V, Ge R, Bell G, Regev A, Weinberg R: An
embryonic stem cell-like gene expression signature in poorly
differentiated aggressive human tumors. Nat Genet 2008, 40:499-507.
37. Park S, Lee H, Li H, Shipitsin M, Gelman R, Polyak K: Heterogeneity for
stem cell-related markers according to tumor subtype and histologic
stage in breast cancer. Clin Cancer Res 2010, 16:876-887.
38. Fan C, Oh DS, Wessels L, Weigelt B, Nuyten DS, Nobel AB, van’t Veer LJ,
Perou CM: Concordance among gene-expression-based predictors for
breast cancer. N Engl J Med 2006, 355:560-569.
39. Hackett A, Smith H, Springer E, Owens R, Nelson-Rees W, Riggs J,
Gardner M: Two syngeneic cell lines from human breast tissue: the
aneuploid mammary epithelial (Hs578T) and the diploid myoepithelial
(Hs578Bst) cell lines. J Natl Cancer Inst 1977, 58:1795-1806.
40. Young RK, Cailleau RM, Mackay B, Reeves WJ Jr: Establishment of epithelial
cell line MDA-MB-157 from metastatic pleural effusion of human breast
carcinoma. In Vitro 1974, 9:239-245.
41. Arpino G, Bardou V, Clark G, Elledge R: Infiltrating lobular carcinoma of
the breast: tumor characteristics and clinical outcome. Breast Cancer Res
2004, 6:R149-R156.
42. Morel AP, Lièvre M, Thomas CM, Hinkal G, Ansieau SP, Puisieux A:
Generation of breast cancer stem cells through epithelial-mesenchymal
transition. PLoS One 2008, 3:e2888.
43. Gupta P, Onder T, Jiang G, Tao K, Kuperwasser C, Weinberg R, Lander E:
Identification of selective inhibitors of cancer stem cells by highthroughput screening. Cell 2009, 138:645-659.
44. Li X, Lewis MT, Huang J, Gutierrez C, Osborne CK, Wu M-F, Hilsenbeck SG,
Pavlick A, Zhang X, Chamness GC, Wong H, Rosen J, Chang JC: Intrinsic
resistance of tumorigenic breast cancer cells to chemotherapy. J Natl
Cancer Inst 2008, 100:672-679.
45. Sarrió D, Rodriguez-Pinilla S, Hardisson D, Cano A, Moreno-Bueno G,
Palacios J: Epithelial-mesenchymal transition in breast cancer relates to
the basal-like phenotype. Cancer Res 2008, 68:989-997.
46. Ross D, Scherf U, Eisen M, Perou C, Rees C, Spellman P, Iyer V, Jeffrey S, Van
de Rijn M, Waltham M, Pergamenschikov A, Lee J, Lashkari D, Shalon D,
Myers T, Weinstein J, Botsein D, Brown P: Systematic variation in gene
expression patterns in human cancer cell lines. Nat Genet 2000,
24:227-235.
47. Sellappan S, Grijalva R, Zhou X, Yang W, Eli M, Mills G, Yu D: Lineage
infidelity of MDA-MB-435 cells: expression of melanocyte proteins in a
breast cancer cell line. Cancer Res 2004, 64:3479-3485.
48. Esteller M, Silva JM, Dominguez G, Bonilla F, Matias-Guiu X, Lerma E,
Bussaglia E, Prat J, Harkes IC, Repasky EA, Gabrielson E, Schutte M, Baylin SB,
Herman JG: Promoter hypermethylation and BRCA1 inactivation in
sporadic breast and ovarian tumors. J Natl Cancer Inst 2000, 92:564-569.
49. Turner NC, Reis-Filho JS, Russell AM, Springall RJ, Ryder K, Steele D,
Savage K, Gillett CE, Schmitt FC, Ashworth A, Tutt AN: BRCA1 dysfunction
in sporadic basal-like breast cancer. Oncogene 2006, 26:2126.
50. Lakhani SR, Jacquemier J, Sloane JP, Gusterson BA, Anderson TJ, van de
Vijver MJ, Farid LM, Venter D, Antoniou A, Storfer-Isser A, Smyth E, Steel CM,
Haites N, Scott RJ, Goldgar D, Neuhausen S, Daly PA, Ormiston W,
McManus R, Scherneck S, Ponder BA, Ford D, Peto J, Stoppa-Lyonnet D,
Easton DF: Multifactorial analysis of differences between sporadic breast
cancers and cancers involving BRCA1 and BRCA2 mutations. J Natl
Cancer Inst 1998, 90:1138-1145.
51. Elstrodt F, Hollestelle A, Nagel JHA, Gorin M, Wasielewski M, van den
Ouweland A, Merajver SD, Ethier SP, Schutte M: BRCA1 mutation analysis
Prat et al. Breast Cancer Research 2010, 12:R68
http://breast-cancer-research.com/content/12/5/R68
52.
53.
54.
55.
56.
57.
Page 18 of 18
of 41 human breast cancer cell lines reveals three new deleterious
mutants. Cancer Res 2006, 66:41-45.
Liu S, Ginestier C, Charafe-Jauffret E, Foco H, Kleer CG, Merajver SD,
Dontu G, Wicha MS: BRCA1 regulates human mammary stem/progenitor
cell fate. Proc Natl Acad Sci USA 2008, 105:1680-1685.
Charafe-Jauffret E, Ginestier C, Lovino F, Wicinski J, Cervera N, Finetti P,
Hur M, Diebel M, Monville F, Dutcher J, Brown M, Viens P, Xerri L,
Bertucci F, Stassi G, Dontu G, Birnbaum D, Wicha M: Breast cancer cell
lines contain functional cancer stem cells with metastatic capacity and a
distinct molecular signature. Cancer Res 2009, 69:1302-1313.
Fillmore C, Kuperwasser C: Human breast cancer cell lines contain stemlike cells that self-renew, give rise to phenotypically diverse progeny
and survive chemotherapy. Breast Cancer Res 2008, 10:R25.
Bonnet D, Dick J: Human acute myeloid leukemia is organized as a
hierarchy that originates from a primitive hematopoietic cell. Nat Med
1997, 3:730-737.
Wang X, Julio MK-d, Economides KD, Walker D, Yu H, Halili MV, Hu Y-P,
Price SM, Abate-Shen C, Shen MM: A luminal epithelial stem cell that is a
cell of origin for prostate cancer. Nature 2009, 461:495-500.
Prat A, Perou CM: Mammary development meets cancer genomics. Nat
Med 2009, 15:842.
doi:10.1186/bcr2635
Cite this article as: Prat et al.: Phenotypic and molecular
characterization of the claudin-low intrinsic subtype of breast cancer.
Breast Cancer Research 2010 12:R68.
Submit your next manuscript to BioMed Central
and take full advantage of:
• Convenient online submission
• Thorough peer review
• No space constraints or color figure charges
• Immediate publication on acceptance
• Inclusion in PubMed, CAS, Scopus and Google Scholar
• Research which is freely available for redistribution
Submit your manuscript at
www.biomedcentral.com/submit


© Copyright 2026