
Diffuse Optical Tomography of Cerebral Blood Flow,
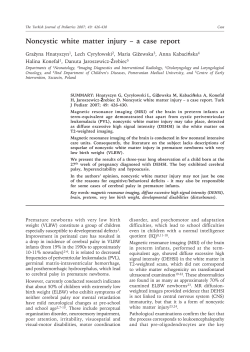
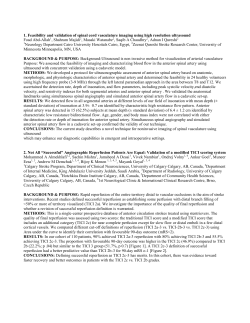
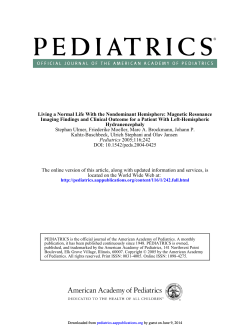
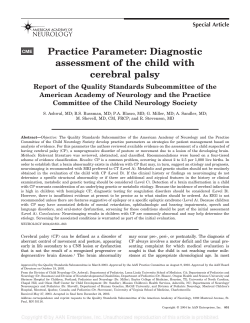
Journal of Cerebral Blood Flow & Metabolism 23:911–924 © 2003 The International Society for Cerebral Blood Flow and Metabolism Published by Lippincott Williams & Wilkins, Inc., Baltimore Diffuse Optical Tomography of Cerebral Blood Flow, Oxygenation, and Metabolism in Rat During Focal Ischemia *Joseph P. Culver, *Turgut Durduran, †Daisuke Furuya, *Cecil Cheung, †Joel H. Greenberg, and *A. G. Yodh *Department of Physics and Astronomy, and †Department of Neurology, Cerebrovascular Research Center, University of Pennsylvania, Philadelphia, Pennsylvania, U.S.A. Summary: Diffuse optical tomography (DOT) is an attractive approach for evaluating stroke physiology. It provides hemodynamic and metabolic imaging with unique potential for continuous noninvasive bedside imaging in humans. To date there have been few quantitative spatial-temporal studies of stroke pathophysiology based on diffuse optical signatures. The authors report DOT images of hemodynamic and metabolic contrasts using a rat middle cerebral artery occlusion (MCAO) stroke model. This study used a novel DOT device that concurrently obtains coregistered images of relative cerebral blood volume (rCBV), tissue-averaged hemoglobin oxygen saturation (StO2), and relative cerebral blood flow (rCBF). The authors demonstrate how these hemodynamic measures can be synthesized to calculate an index of the oxygen extraction fraction (OEF) and the cerebral metabolic rate of oxygen consumption (CMRO2). Temporary (60-minute) MCAO was performed on five rats. Ischemic changes, averaged over the 60 minutes of occlusion, were as follows: rCBF ⳱ 0.42 ± 0.04, rCBV ⳱ 1.02 ± 0.04, ⌬StO2 ⳱ −11 ± 2%, rOEF ⳱ 1.39 ± 0.06 and rCMRO2 ⳱ 0.59 ± 0.07. Although rOEF increased in response to decreased blood flow, rCMRO2 decreased. The sensitivity of this method of DOT analysis is discussed in terms of assumptions about baseline physiology, and the diffuse optical results are compared with positron emission tomography, magnetic resonance imaging, and histology observations in the literature. Key Words: Diffuse optical tomography—Ischemia—Cerebral blood flow—Laser Doppler flowmetry—Tissue oxygen saturation—Cerebral metabolic rate of oxygen consumption. Diffuse optical tomography (DOT) of the brain is an attractive new approach for evaluating stroke physiology. DOT can provide hemodynamic and metabolic imaging contrasts complementary to those of magnetic resonance imaging (MRI) and positron emission tomography (PET), and holds a unique potential for continuous noninvasive bedside imaging in humans (Benaron et al., 2000; Hintz et al., 1999) and densely sampled longitudinal studies in animals. However, experience with diffuse optical signatures in stroke is limited. The goal of this work is to establish new DOT hemodynamic and metabolic methodologies through measurements of a widely used middle cerebral artery occlusion (MCAO) stroke model (Koizumi et al., 1985; Longa et al., 1989). While tissue viability and function are often manifested in hemodynamic signatures, assays derived from hemodynamic measures can be complicated by the interplay between vascular supply, tissue oxygen consumption, and regulatory effects. A tissue volume with normal tissue oxygenation, for example, could be healthy, or could have decreased metabolic activity as a result of decreased vascular supply. Clearly, more comprehensive sets of hemodynamic data containing independent information about hemoglobin concentration, oxygenation, and flow are desirable to reduce ambiguities. We address these issues in the present work using a novel hybrid DOT continuous-imaging device. Diffuse correlation flowmetry probes cerebral blood flow using the dynamic fluctuations of the diffusing light (Cheung et al., 2001). We combine the correlation flowmetry with traditional diffuse photon density wave measurements of static hemoglobin concentrations for monitoring relative cerebral blood volume (rCBV) and tissueaveraged hemoglobin saturation (StO2). Together these hemodynamic measures provide several potential indicators of ischemic tissue, and enable one to better distinguish the origin of metabolic change. Received December 4, 2002; final revision received April 16, 2003; accepted April 17, 2003. Supported by grants NIH-HL HL-57835–04 (to A.G.Y.), NS33785 (to J.H.G.), and NIH K25 NS44339A01 (to J.P.C.). Address correspondence and reprint requests to Dr. Joseph P. Culver, NMR Center, Massachusetts General Hospital, Bldg. 149, 13th Street, Charlestown, MA 02129, U.S.A.; e-mail: [email protected]. harvard.edu 911 DOI: 10.1097/01.WCB.0000076703.71231.BB 912 J. P. CULVER ET AL. Several imaging techniques have been exploited to measure variations in cerebral blood flow in laboratory animals and in humans, including PET-based (Frackowiak et al., 1980) and MRI-based (Detre and Alsop 1999) techniques, laser Doppler scanning (Nielsen et al., 2000), and speckle contrast imaging (Dunn et al., 2001, 2003). Measurement of cerebral blood flow with PET, although quantitative, is expensive and lacks the spatio-temporal resolution important in animal studies. Use of MRI with arterial spin tagging of water (Williams et al., 1992) or exogenous contrast agents (Zaharchuk et al., 1998) is attractive because rCBV can be obtained along with rCBF. Laser Doppler scanning and speckle contrast imaging have proven useful for flow studies in animals but require the skull to be removed or thinned appreciably. Images of cerebral tissue oxygenation have been obtained directly, by measuring hemoglobin oxygen saturation using oxyhemoglobin and deoxyhemoglobin absorption of light (intrinsic optical signal), and indirectly, by introducing into the circulation tracers whose phosphoresce is proportional to oxygen tension (extrinsic optical signal). In planar illumination reflectance imaging setups, light in the visible and ultraviolet wavelengths less than 670 nm cannot penetrate the skull, so the bone must be either appreciably thinned or removed for these studies. In these exposed cortex preparations, oxygen signals originate from the tissue surface (less than 500 m) (Grinvald et al., 1986; Malonek and Grinvald 1996; Mayhew et al., 1999). Dyes such as Pd meso-tetra-(4carboxyphenyl)-porphine bind to the albumin in the blood and experience oxygen-dependent quenching of phosphorescence when the tissue is illuminated with 535-nm wavelength light. As a result, near-surface images of regional oxygen tension can be produced (Vinogradov et al., 1996). Near-infrared spectroscopy (NIRS) methods use light in the 690-nm to 850-nm range with spatially separated source and detector pairs, permitting noninvasive measurements to penetrate the skull, albeit with reduced spatial resolution due to tissue scattering (Jobsis 1977; Villringer and Chance 1997). This technique permits measurement of hemoglobin oxygen saturation at depths of up to several centimeters into the tissue. It is even more difficult to image cerebral oxygen metabolism (CMRO2). In humans, PET scanning during inhalation of oxygen (Frackowiak et al., 1980) provides an image of oxygen extraction fraction (OEF) that, in combination with a sequential measurement of CBF, permits the calculation of CMRO2. However, the expense and inaccessibility of PET, along with relatively poor spatial resolution, limits the use of this technique to humans or to large laboratory animals. Alternatively, several groups have pursued methods to synthesize CMRO2 from multiparametric data sets with varying degrees of success (Ances et al., 2001; Dunn et al., 2003; MandeJ Cereb Blood Flow Metab, Vol. 23, No. 8, 2003 ville et al., 1999; Mayhew et al., 2000). In this article, we describe a technique permitting the noninvasive measurement of cerebral blood flow, cerebral blood volume, and tissue oxygen extraction fraction, along with an index of cerebral oxygen consumption. We demonstrate the use of this technique by monitoring changes in these parameters during focal cerebral ischemia. To our knowledge, these are the first in vivo images of cerebral oxygen consumption based on diffuse optical tomography. MATERIALS AND METHODS Animal preparation Adult male Sprague-Dawley rats weighing 300 to 325 g were fasted overnight but permitted free access to water. The animals were anesthetized (1% to 1.5% halothane, 70% nitrous oxide, 30% oxygen), and catheters were placed into a femoral artery to monitor arterial blood pressure. Body temperature was maintained at 37°C ± 0.5°C with a thermostatically controlled heating pad. The animals were tracheotomized, mechanically ventilated, and the head was fixed on a stereotaxic frame. The scalp was reflected because the fur introduces a slight distortion into the near-infrared signals. To facilitate access to the neck during the late stages of the MCAO surgical procedure, a custom stereotaxic stage permitted the animal to be turned to the prone position. After final animal positioning, the fiber optic/lens assembly (Fig. 1) was placed to sample a region symmetrically about midline and covered a region from 1.5 mm anterior to 7.5 mm posterior of the rhinal fissure (Fig. 2). FIG. 1. Diffuse light reflected from the tissue was detected by four avalanche photodiodes and demodulated to deduce the source-detector position-dependent amplitude and phase variations of the diffusive photon density waves (DPDW). For the diffuse light correlation flowmetry measurements, single-mode fibers relayed single speckles to the avalanche photodiodes. All four lasers were multiplexed onto a two-dimensional 4 × 3 grid (10 mm × 10 mm) of 12 optical fibers located in the image plane of a camera. A relay lens projected the probe grid onto the sample (e.g. rat cranium) permitting non-contact measurements. Crossed polarizers between the source and detector fibers suppressed superficial reflections. DPDW measurements were temporally interlaced between successive diffuse correlation measurements. DIFFUSE OPTICAL TOMOGRAPHY OF rCMRO2 DURING FOCAL ISCHEMIA FIG. 2. Positions of the optodes and the imaging domain. The reconstruction volume consisted of a 2D slice extending from 1.5 mm anterior to 7.5 mm posterior of bregma, 4.5 mm on either side of midline and from a depth of 1.0 mm to 2.5 mm below the top of the skull (i.e. the upper ∼1.5 mm of brain tissue). Focal ischemia. Focal ischemia was induced by intraluminal suture occlusion of the middle cerebral artery (Koizumi et al., 1985; Longa et al., 1989). Briefly, the right common carotid artery was isolated and separated from the surrounding fascia. The right external carotid artery was ligated and a siliconecoated nylon filament was inserted through the external carotid by way of the common carotid artery into the internal carotid artery and advanced until resistance was noted (18 to 20 mm). The nylon filament had a rounded tip enlarged to approximately 0.35 mm in diameter with heat, and was coated with silicone to a diameter of 0.35 mm over a distance of 5 mm from the tip. Before the final advance of the filament into position for occlusion, the rat was placed in the custom stereotaxic holder in the prone position. The lens-coupled probe was positioned as described previously and 20 minutes of baseline data were obtained. Final advance of the suture occurred with the animal in the stereotaxes and while DOT measures were being taken. After 60 minutes of occlusion, the suture was retracted for reperfusion. The wounds were closed, the anesthetic terminated, and the animals were returned to their cages. Twentyfour hours after occlusion, the animals were killed and the brains were removed and stained with 2,3,5-triphenyltetazolium chloride (TTC) as described previously (Takahashi et al., 1997). Diffuse optical tomography methods Experimental measurements. Figure 1 shows a schematic of the instrumentation. A detailed description of the device is provided in Cheung et al. (2001). Briefly, diffuse photon density waves were derived from three intensity modulated (70MHz) laser diodes (690, 750, and 830 nm). Diffuse light reflected from the tissue was detected by four avalanche photodiodes and demodulated to deduce the source-detector position-dependent amplitude and phase variations of the diffusive waves. The diffuse light correlation flowmetry measurements used a single-mode, large coherence length (more than 1 m) laser source operating at 790 nm (Model TC40, SDL Inc., San Jose, CA, U.S.A.). Single-mode fibers relayed single speckles to the avalanche photodiodes. A correlator chip (Correlator.com, Bridgewater, NJ, U.S.A.) was used to analyze the time-variant speckle intensity, obtaining temporal intensity autocorrelation functions of the diffuse light. All four lasers were multiplexed onto a two-dimensional 4 × 3 grid (10 mm × 10 mm) of 12 optical fibers located in the image plane of a camera. A relay lens projected the probe grid onto the sample (e.g., rat cranium) permitting noncontact measurements (Figs. 1 and 2). Crossed polarizers between the source and detector fibers sup- 913 pressed superficial reflections. Diffuse photon density wave spectroscopy measurements were temporally interlaced between successive diffuse correlation spectroscopy measurements. Hemoglobin concentrations. We modeled frequencydomain diffuse photon density waves using an extrapolated zero boundary, semi-infinite media solution (Haskell et al., 1994) as outlined in the Appendix. Briefly, diffuse photon density waves were fit to an extrapolated boundary condition solution for semi-infinite diffuse photon density waves at source detector separations from 2.7 to 10 mm. Absorption and scattering coefficients were obtained at each of the three wavelengths. The absorption coefficients were converted into hemoglobin concentrations (C) using spectral decomposition, C = E−1µsub a , where C ⳱ ([Hbr],[HbO2]) is a vector of concentrations ([Hbr] indicates the concentration of deoxyhemoglobin and [HbO2] the concentration of oxyhemoglobin), E is a matrix containing the extinction coefficients of [Hbr] and [HbO2] at the is a vector (i.e., µa = 兵690nm , three wavelengths, and µsub a a 750nm 830nm a , a } containing the background subtracted absorption coefficients. The background-subtracted absorption coefficients are equal to the total absorption, µtotal minus the a total water/lipid contribution, µlipidⲐwater (i.e., µsub − µlipidⲐwater ). The a a = µa a individual hemoglobin concentrations were subsequently converted into a total hemoglobin concentration [HbT] ⳱ [Hbr] + [HbO2] and tissue hemoglobin oxygen saturation StO2 ⳱ [HbO2]/[HbT]. Extinction coefficients were obtained from published spectra for [Hbr] and [HbO2] (Prahl, 2002; Wray et al., 1988), for water (Hale and Querry, 1973), and for lipids (Cubeddu et al., 2000). In addition, we assumed a 50/50 water/lipid background ratio. Correlation flowmetry. We determined the motional dynamics of the medium by measuring the spatio-temporal dependence (i.e., r and t dependence) of the detected diffuse light intensity I(r,t). We computed the (normalized) intensity autocorrelation function of the diffuse light intensity, and from the intensity autocorrelation function we calculated the diffuse electric field temporal autocorrelation function, which satisfies the correlation diffusion equation (Boas et al., 1995; Boas and Yodh, 1997). The correlation function decay depends on the constant, k, defined as the following: k2 = 3s⬘a + 6s⬘2k2o⌫ , (1) where is the autocorrelation time delay and k0 is the photon wavenumber in the medium. The parameter ⌫ ⳱ ␣DB characterizes blood flow; ␣ is the probability that a photon is scattered by a moving “cell” and is presumed proportional to cerebral blood volume (Cheung et al., 2001). The blood flow speed was parameterized by a Brownian diffusion constant, DB. Details on these approximations have been published previously (Boas and Yodh, 1997; Cheung et al., 2001). Image reconstructions Concentration images. Differential image reconstructions were obtained using a linear Rytov approximation approach (Kak and Slaney, 1988). In this work, we only used intensity data to reconstruct absorption perturbations. In the Rytov formulation, the scattered field is related to the optical properties (in discrete notation) by the following matrix equation: y ⴝ Ax. (2) Here, x is a vector of differential absorption xj = ␦µa , for voxels spanning the three-dimensional volume of interest. The vector y contains differential measurements, yi = ln关⌽ 共rs(i),rd(i)兲 Ⲑ ⌽o共rs(i),rd(i)兲兴, for each source (rs(i)) and detector j J Cereb Blood Flow Metab, Vol. 23, No. 8, 2003 914 J. P. CULVER ET AL. (rd(i)) pair (index i), and the sensitivity matrix, A, is a forward model, based on the light diffusion approximation, that predicts measurement vector, y, for given absorption image, x. We obtained an inverse solution x ⳱ A#,␣ymeas using depthdependent Tikhonov regularization and a Moore-Penrose gen# eralized inverse as outlined in Appendix A. A matrix, A,␣ for wavelength and regularization ␣, effectively maps a measurement vector y onto an image vector x. # Inverse matrices A,␣ were constructed for each wavelength. The reconstruction volume consisted of a two-dimensional slice extending from 1.5 mm anterior of bregma to 7.5 mm posterior of bregma, 4.5 mm on either side of midline and from a depth of 1.0 mm to 2.5 mm below the top of the skull (i.e., the upper ∼1.5 mm of brain tissue). Reconstructions were performed for the full time course of measurements, frame by frame, for each wavelength. The resulting absorption images were converted on a pixel-by-pixel basis into [HbT] and StO2 images using spectral decomposition as described previously. The time-series images were processed using the following procedure. All times are relative to the occlusion time at t ⳱ 0. The baseline time period of t ⳱ −28 to −16.8 minutes was used to calculate a baseline mean value and standard deviation for each pixel. Three subsequent time periods were analyzed: the period from t ⳱ −16.8 to −11.2 minutes represented a baseline image, the period from t ⳱ 5.6 to 56 minutes (during occlusion) represented an occlusion image, and the period from t ⳱ 75.6 to 92.4 minutes yielded a reperfusion image. The images were then averaged across rats and quantitative time traces were generated using a region-of-interest (ROI) analysis. Flow images. Flow images were obtained by extending the standard techniques described in the previous section for imaging applications to correlation spectroscopy flowmetry methods to include imaging (Boas and Yodh, 1997). In the Rytov formulation (y ⳱ Ax) for correlation flowmetry, x is a vector of differential flow values, xj = ⭸⌫j, for each voxel (index j). The vector y contains differential measurements, yi = ln关⌽ 共rs(i),rd(i)兲 Ⲑ ⌽o共rs(i),rd(i)兲兴, for each source (rs(i)) and detector (rd(i)) pair (index i). The sensitivity matrix, A, is the forward model based on the light diffusion approximation that predicts a measurement vector, y, for a given flow image, x. # We obtain an inverse solution x⳱ AF,a ymeas using depthdependent Tikhonov regularization and a Moore-Penrose generalized inverse as outlined in the Appendix. The resulting flow time-series images were processed into images and ROI time traces following the same procedures as were used for interpreting hemoglobin concentrations time-series images. rCMRO2 = rOEF * rCBF Several authors have discussed methods for synthesizing rCMRO2 values from hemodynamic variables (Ances et al., 2001; Hoge et al., 1999; Hyder et al., 1998; Mandeville et al., 1999; Mayhew et al., 2000). Here we follow those discussions and direct readers to the listed references for more details. The cerebral metabolic rate for oxygen can be calculated from OEF, CBF, and arteriolar oxygen concentration ([O2]a) using Fick’s law: assuming that [O2]a does not change. Our measurement of diferential flow is equivalent to rCBF, and we can thus calculate rCMRO2 with knowledge of rOEF. We interpret the tissue hemoglobin saturation measure using a compartmental model (Cheung et al., 2001; Gesztelyi et al., 1993; Mayhew et al., 2001). The optical signal originates from the hemoglobin in the tissue seen by the probe, and will be a mixture of arterial, capillary and venous blood. This can be formulated as follows: StO2 = k1 * SaO2 + k2 * ScO2 + k3 * SvO2, (8) where SaO2, ScO2, and SvO2 are the arteriolar, capillary, and venous saturations, respectively, and k1, k2, and k3 are the respective weights of each compartment to the total blood volume (k1 + k2 + k3 ⳱ 1). A standard simplification is to represent ScO2 as a weighted average of the arterial and venous saturations: ScO2 = k4 * SaO2 + k5 * SvO2, (9) where k4 + k5 ⳱ 1. The system can therefore be reduced to a two-compartment model: StO2 = 共1 − ␥兲 * SaO2 + 共␥兲 * SvO2 (10) where ␥ indicates percentage of blood volume contained in the venous component of the vascular system, and ␥ ⳱ k3 + k2 × k5. The oxygen extraction fraction is by definition the fractional conversion of oxygen from arterioles to venules or OEF ⳱ (CaO2 − CvO2)/CaO2, where CaO2 and CvO2 are the arteriolar and venous concentrations of oxygen. Assuming steady-state balance between CaO2 and hemoglobin concentration, we have OEF = 共SaO2 − SvO2兲 Ⲑ SaO2 (11) Solving this in terms of StO2 yields OEF = 共SaO2 − StO2兲 Ⲑ 共␥ * SaO2兲. (12) SaO2 is obtained from blood gas measurements. Therefore, we can obtain OEF directly from the measured StO2 values. Note that if we assume ␥ remains constant, the compartment parameter divides out of our measures of rOEF. Thus, rCMRO2 can be directly calculated from rOEF and rCBF measures using rCMRO2 ⳱ rOEF × rCBF. The tissue-compartmental model assumptions are addressed further in the Discussion. The blood gas status of the animals was in the normal range. Occlusion of the MCA did not produce any significant change in pH, PaCO2, PaO2, or SaO2 (Table 1). The baseline optical properties and hemoglobin concentrations were obtained from data and fits as shown in Fig. 3 using the diffuse photon density wave analysis presented in Materials and Methods. The results TABLE 1. Physiologic parameters (3) For relative changes in these variables, we define rCMRO2 = 共1 + ⌬CMRO2 Ⲑ CMRO2兲 (4) rCBF = 共1 + ⌬CBFⲐCBF兲 (5) rOEF = 共1 + ⌬OEFⲐOEF兲. (6) J Cereb Blood Flow Metab, Vol. 23, No. 8, 2003 (7) RESULTS Oxygen extraction fraction and index of cerebral metabolic rate of oxygen consumption: CMRO2 = OEF * CBF * 关O2兴a The conventional formula for the relative change in cerebral oxygen metabolism is then Ischemia Before During pH PaCO2 (mm Hg) PaO2 (mm Hg) SAO2 (%) 7.37 ± 0.04 7.38 ± 0.05 43.6 ± 8 43.2 ± 9 116 ± 5 116 ± 14 98.3 ± 0.4 98.7 ± 0.3 All values are mean ± SD (n ⳱ 5). DIFFUSE OPTICAL TOMOGRAPHY OF rCMRO2 DURING FOCAL ISCHEMIA FIG. 3. Amplitude and phase measurements using frequency domain diffuse wave (70 MHz) at source detector separations of 2.7 to 10 mm at each of three wavelengths (690, 750 and 830 nm). Data is shown for one representative rat. The amplitude decay, and phase increase as a function of source detector separation are fit using a diffusive light modeling (see text) to obtain quantitative measures of tissue averaged absorption and scattering optical properties of rat head (n = 5) (see Table 2). averaged over five rats are shown in Table 2. The baseline optical properties were used to construct the inversion matrices in the image reconstruction process. Focal ischemia was confirmed for each rat with histologic analyses. Figure 4 shows a TTC stain of the infarct region and the spatial slice reconstructed with DOT. The measurements cover tissue within the infarct volume, adjacent to the infarct volume, just outside the infarct volume, and an equivalent tissue volume on the contralateral side. Images were reconstructed for all five animals. These images were then averaged and images were produced on the resulting five-animal-averaged image series as described in Materials and Methods. Images of [Hbt], StO2, and relative cerebral blood flow (rCBF) are shown in Fig. 5 for time points representing baseline (t ⳱ −16.8 to −11.2 minutes), occlusion (+5.6 to +56 minutes), and reperfusion (t ⳱ 75.6 to 92.4 minutes). Regions of interest within the images were defined rela- 915 tive to bregma (Fig. 6) for ROI-1, an ischemic region (x ⳱ 0.3 to 4.8 mm, y ⳱ 2.7 to 4.5 mm); ROI-2, a periischemic region towards midline (x ⳱ 0.3 to 4.8 mm, y ⳱ 0.9 to 2.7 mm); ROI-3, a posterior periischemic region (x ⳱ 4.8 to 6.6 mm, y ⳱ 0.9 to 4.5 mm); and ROI-4, a contralateral control region (x ⳱ 0.3 to 4.8 mm, y ⳱ 0.9 to 4.5 mm). Quantitative time traces for these regions are plotted in Fig. 7. Time-averaged signals (from 5 to 55 minutes after occlusion) are detailed in Table 3 and shown in Fig. 8. The statistics represent the SD distribution of measures across the five animals. In the ischemic ROI-1, occlusion decreased relative flow to 42% ± 4% of baseline. When the filament was removed, flow rapidly increased to close to the preischemic level (85% ± 20%) and remained at this level throughout the reperfusion period. In the two peri-infarct regions shown in Fig. 4, blood flow decreased to 63% and 83% of the pre-ischemic flow and remained relatively constant throughout the occlusive period. As was the case for region 1, removal of the filament leads to restoration of blood flow in these regions. Blood flow in the left (control) hemisphere remained relatively constant throughout ischemia and reperfusion (102% ± 10%). The changes in oxygen saturation were somewhat similar to the changes in cerebral blood flow. StO2 decreased in the ischemic hemisphere immediately on occlusion and remained depressed until release. The greatest decrease occurred in the core of the MCA territory (59% ± 2%) with smaller changes in the two more peripheral regions. Whereas StO2 in the core was lower than in the peri-ischemic regions in the early ischemic period, by the end of the ischemia all three regions were almost equal due to a gradual, but slight, increase in StO2 in the core over the period of ischemia. Assuming that the amount of venous blood in the region of interest does not change after occlusion (␥ ⳱ constant; see Discussion), rOEF in ROI-1 was 1.39 ± 0.06, whereas rOEF in regions 2 and 3 were 1.29 ± 0.06 and 1.21 ± 0.05, respectively. rOEF in the control region was slightly below (but not significantly different from) unity (Table 3). TABLE 2. Baseline optical properties* Optical Properties (cm−1) Hemoglobin concentrations (M) 2 s⬘ [HbO2] [Hbr] [HbT] StO2 (%) 690 nm 750 nm 830 nm 0.22 ± 0.06 0.26 ± 0.04 0.25 ± 0.05 15.3 ± 2.0 13.6 ± 0.9 12.5 ± 1.1 70 ± 15 32 ± 9 103 ± 22 69 ± 4 * All values are mean ± SD (n ⳱ 5). FIG. 4. 2,3,5-triphenyltetrazolium chloride (TTC) stain of the infarct region and position of the slice reconstructed with DOT. Note the measurements cover the predominantly penumbral tissue and an equivalent tissue volume on the contralateral side. J Cereb Blood Flow Metab, Vol. 23, No. 8, 2003 916 J. P. CULVER ET AL. FIG. 5. Diffuse optical tomography images of (a–c) total hemoglobin concentrations [HbT], (d–f) tissue averaged hemoglobin saturation (StO2), (g–i) baseline relative cerebral blood flow (rCBF) and (k–m) relative cerebral metabolic rat of oxygen (rCMRO2). The middle cerebral artery was occluded from t = 5 min to t = 0, and the suture was retracted at t = 60 min resulting in reperfusion. Images are shown for time points representing baseline (t = −16.8 to −11.2 minutes), occlusion (+5.6 to +56 minutes), and reperfusion (t = 75.6 to 92.4 minutes). The changes in rCMRO2 (Fig. 6 and Table 3) display the competing effects of decreased CBF and increased OEF. Immediately on occlusion, we found the greatest decreases of rCMRO2 ⳱ 0.59 ± 0.07 in the ischemic ROI-1. A smaller decrease of rCMRO2 ⳱ 0.8 ± 0.1 occurred in ROI-2, and rCMRO2 remained close to baseline in ROI 3 (rCMRO2 ⳱ 1.1 ± 0.11) and in the control ROI-4 (rCMRO2 ⳱ 0.87 ± 0.12). During reperfusion, the values for rCMRO2 returned to near-baseline values for all regions. DISCUSSION We have presented the results of a multiparametric diffuse optical imaging study of ischemia. We now discuss these results in the context of previous histological cryomicrospectrophotometric studies and minimally invasive MRI, PET, and deep-tissue optical studies. We also discuss the influence of model assumptions on the calculation of the index rCMRO2. Baseline optical properties, hemoglobin concentrations, and oxygen extraction fraction Baseline tissue saturation and oxygen extraction fraction are important measures of tissue status and are crucial to quantitative studies of relative changes since J Cereb Blood Flow Metab, Vol. 23, No. 8, 2003 they represent the denominator in differential measures, baseline values are crucial to quantitative studies of relative changes. We found a baseline StO2 value of 69% ± 4%. For comparison, Weiss et al. (1996) have used a cryomicrospectrophotometric technique to examine blood oxygen saturation in both arterioles and venules of the rat cortex ex situ (Narayanan et al., 2000). Depending on rat preparation, reported values of SvO2 for normal cortex range from 48% (Weiss et al., 1996) to 62% (Narayanan et al., 2000). To interpret these values in terms of StO2, we used Eq. 6 and derived a value of ␥. Assuming compartment ratios of 8% arteriole, 70% capillary, and 22% venule (e.g., k1 ⳱ 0.08, k2 ⳱ 0.7, and k3 ⳱ 0.22; Gesztelyi et al., 1993) and assuming capillary saturation equals the average of the arteriole and venule values (k5 ⳱ 0.5), then ␥ ⳱ 0.57, where ␥ ⳱ k3 + k2 × k5. With ␥ ⳱ 0.57, SaO2 ⳱ 98%, and SvO2 values from Weiss et al. (1996) of 48% and 62%, we find StO2 values of 69% and 77% respectively. Thus the cryomicrospectrophotometric values are in reasonable agreement with our transcranial in vivo measured value 69% ± 4%. Cerebral blood volume and cerebral blood flow It has been well documented in our laboratory and in the literature that filament occlusion of the MCA causes DIFFUSE OPTICAL TOMOGRAPHY OF rCMRO2 DURING FOCAL ISCHEMIA 917 FIG. 6. Regions of interest within the images were defined relative to bregma for; ROI-1, an ischemic region ( x = 0.3 to 4.8 mm, y = 2.7 to 4.5 mm); ROI-2, a peri-ischemic region towards midline (x = 0.3 to 4.8 mm, y = 0.9 to 2.7 mm); ROI-3, a posterior periischemic region (x = 4.8 to 6.6 mm, y = 0.9 to 4.5 mm); and ROI-4, a contra-lateral control region (x = 0.3 to 4.8 mm, y = 0.9 to 4.5 mm). a decrease in cerebral blood flow in the core of the middle cerebral artery territory to approximately 20% to 30% of pre-ischemic levels (Alkayed et al., 1998; Takahashi et al., 1997). The cerebral blood flow in region 1 in the present study exhibited a decrease to only 42% of control values very soon after MCA occlusion and remained at this level throughout the occlusion period. This apparently milder flow decrease may be due to the size of the ROI, which probably is not totally confined to the core territory—it appears medial to the center of the ischemia (Figs. 4–6). Similarly, a model-mismatch error in the depth of the reconstructed slice, as discussed below, may also report a milder flow decrease than expected. During hypercapnia in the nonhuman primate, CBV is parametrically related to CBF, with rCBV ⳱ rCBFa, where for healthy tissue ␣ ⳱ 0.2–0.4 (Grubb et al., 1974). In a previous study of hypercapnia in the rat, we obtained a value for ␣ of 0.23 (Cheung et al., 2001). During ischemia (present study) ␣ ⳱ 0.03, much lower than in hypercapnia. This flow-volume mismatch is consistent with magnetic resonance perfusion studies in stroke patients (Sorensen et al., 1999) and in rats (Zaharchuk et al., 2000). In the Zaharchuk et al. (2000) study, regions with flow at rCBF ⳱ 52% ± 17% and rCBF ⳱ 36% ± 18% of baseline were found to have decreases in total CBV to rCBV ⳱ 91% ± 17% and rCBV ⳱ 72 ± 21%, respectively, at 1 hour. Although we found essentially no change in rCBV, our results are in reasonable agreement with the small CBV changes observed in the magnetic resonance study, considering the variance in both measures. Tissue hemoglobin oxygen saturation and oxygen extraction fraction Narayanan et al. (2000) used cryomicrospectrophotometric methods to examine ischemia in a MCAO prepa- FIG. 7. The time traces of (a) [HbT], (b) StO2, (c) rCBF, and (d) rCMRO2, in four regions of interest. Both StO2 and rCBF are most reduced in the ischemic ROI-1 and reduced to lesser degrees in both peri-ischemic regions. Although rCMRO2 is reduced in the ischemic ROI-1, and peri-ischemic ROI-2, the changes in rCBF and StO2 are balanced in ROI-3. The cerebral blood volume is nominally constant through out all 4 ROI’s. ration in the rat and found SvO2 in ischemic cortex to be 12% ± 1.4% lower than control cortex. Using the compartment-model assumptions outlined previously and ⌬SvO2 ⳱ 11% yields ⌬StO2 ⳱ 7%. This decrease in StO2 is less than the decrease we observed; however, the TABLE 3. Relative hemodynamics and metabolism during focal ischemia ROI:1 ROI:2 ROI:3 ROI:4 rCBV rCBF ⌬StO2 (%) rOEF rCMRO2 1.02 ± 0.06 1.01 ± 0.12 1.04 ± 0.07 1.05 ± 0.05 0.42 ± 0.04 0.62 ± 0.06 0.83 ± 0.05 1.02 ± 0.06 −11 ± 4 −8 ± 4 −6 ± 3 +3 ± 2 1.39 ± 0.06 1.29 ± 0.06 1.21 ± 0.05 0.89 ± 0.12 0.59 ± 0.07 0.80 ± 0.1 1.1 ± 0.11 0.87 ± 0.12 * All values are mean ± SD (n ⳱ 5). rCBV, rCBF, rOEF and rCMRO2 are relative to respective baseline values before occlusion. ⌬StO2 is (%) change from baseline. J Cereb Blood Flow Metab, Vol. 23, No. 8, 2003 918 J. P. CULVER ET AL. FIG. 8. Relative changes in (A) [HbT], (B) rOEF, (C) rCBF, and (D) rCMRO2, during occlusion in the four regions of interest (see Fig. 6). Occlusion severely restricts blood flow in ROI-1, and although rOEF increased, the tissue experienced a net drop in rCMRO2. flow values in ischemic tissue of the Narayanan et al. (2000) study decreased to only 55% of baseline, whereas in our study, flow decreased to 42% of baseline. PET imaging of a cat MCAO preparation found a broad distribution of rOEF (120% to 200%) in the cortex for 60-minute occlusion (Heiss et al., 1994, 1997). Our results of a 139% increase in rOEF in ROI-1 are on the lower side of the PET observations and consistent with the lower flow numbers, indicating that ROI-1 is on the boarder of the infarct. Index of cerebral metabolic rate of oxygen consumption Narayanan et al. (2000) also calculated rCMRO2 values using the cryomicrospectrophotometric technique. In two studies, they found rCMRO2 values of 0.78 and 0.72 for ischemic regions with rCBF of 0.55 and rCBF 0.57, respectively (relative to control cortex). These decreases in CMRO2 are between those found in the current study for ROI-1 and ROI-2, and are consistent with the respective rCBF values in both studies. In PET studies in the cat using a bolus of inhaled 15O2, Heiss et al. (1994, 1997) found rCMRO2 decreases to 70% of control in the core during 60 minutes of occlusion. This value is for core tissue, presumably more ischemic than the tissue we sampled in ROI-1. The decrease in rCMRO2 is, however, not appreciably different from the value obtained in the present study (0.59 ± J Cereb Blood Flow Metab, Vol. 23, No. 8, 2003 0.07). There are no comparable PET MCAO studies in the rat with which to make a more direct comparison. Modeling assumptions for light propagation in tissues Traditionally, NIRS methods assume a semi-infinite model (Haskell et al., 1994) or use an empirical pathlength model, such as the modified Beer-Lambert law (Kohl et al., 1998b; Nomura et al., 1997), in which one assumes or measures an effective total pathlength at a particular wavelength and optode separation (Delpy et al., 1988; Fantini et al., 1999; Hueber et al., 2001; Kohl et al., 1998b; Patterson et al., 1989). We have taken a similar approach but with differential DOT imaging methods, which avoid focal NIRS errors (Boas et al., 2001). We note that more involved algorithmic solutions have recently been developed to model the complex features of the head. Layered-structure (i.e., scalp, skull, and brain) and boundary effects were modeled with finite difference and finite element methods(Schweiger and Arridge, 1999). Regions with lower scattering, such as the CSF, have been modeled with both Monte Carlo and analytic extensions to the diffusion approximation (Boas et al., 2002; Firbank et al., 1996; Ripoll et al., 2000). Use of anatomical data obtained from other imaging modalities has also been pursued (Barbour et al., 1995; Pogue and Paulsen, 1998). However, few studies using reflection mode imaging of the brain, as described here, have DIFFUSE OPTICAL TOMOGRAPHY OF rCMRO2 DURING FOCAL ISCHEMIA used the more advanced tomography methods. Because of the complexity of the flow measurement instrumentation used in these experiments, the data set has a relatively modest number of source-detector measurement pairs. These data are best served using the simpler linear approaches with analytic semi-infinite Green’s functions. We note that few quantitative measurements of rat brain optical properties have been made. For comparison in rat, we have looked to cryomicrospectrophotometric values of hemoglobin concentrations. Modeling assumptions for cerebral metabolic rate of oxygen One of the caveats in synthesizing CMRO2 is that NIRS traditionally measures tissue saturation. The accuracy of the calculated rCMRO2 depends on the accuracy of the various assumptions that were made in its derivation. In particular, the error in rCMRO2 will be dependent on the error in rOEF from Eq. 4. The error in OEF depends on both the actual measurement of StO2 and the assumptions made in the calculation of SvO2 from StO2. The relationship between SvO2 and StO2 (Eq. 6) contains ␥, which represents the percentage of blood volume contained in the venous component of the vascular system. The error in assuming that ␥ is constant during ischemia can be calculated as follows: Error in rOEF 共%兲 = 100 共␥ Ⲑ ␥⬘ − 1兲 (13) where ␥⬘ is the actual venous volume fraction during ischemia and ␥ is the venous volume fraction before ischemia (⳱venous volume fraction during ischemia assuming that ␥ does not change). Thus, a 10% increase in the effective venous volume fraction during ischemia will lead to a 9.1% underestimation of rOEF if ␥ is assumed to be constant, whereas a 10% decrease in the effective venous volume fraction leads to an 11.1% overestimation of rOEF. During ischemia there can be a decrease in both total cerebral blood volume and microvascular blood volume, with the microvascular blood volume decreasing approximately 10% more than total cerebral blood volume 1 hour into MCAO in the rat (Zaharchuk et al., 2000). Although this translates into a 10% decrease in k2, the effect that this has on ␥ is dependent on how this capillary volume is redistributed. Under steady-state control conditions, the fraction of cerebral blood in the arterioles is approximately 0.08, the fraction in the capillaries is approximately 0.7, and the fraction in the venules is 0.22 (Gesztelyi et al., 1993). We assume k5 ⳱ 0.5. Thus, we can consider the error in rOEF if the decrease in the capillary volume is 30% during ischemia (Zaharchuk et al., 2000). If the total volume remains constant and the capillary decrease (k2) is accommodated by a commensurate increase in the venous volume (k3), ␥ will increase by 10% to 27% depending on k5 and lead to a 9% to 21% underestimation 919 of rOEF (Fig. 9). If we assume the capillary volume decrease (k2) is accommodated by commensurate and equal increases in both the venous (k3) and arteriolar (k1) volumes, ␥ will change by −8.6% to 8.6% (again depending k5) and lead to a modulation in the estimation of rOEF (−8% to 9%). Another possible model error is in the assumption that SaO2 in the arterioles equals the systemic blood gas value SAO2 (Intaglietta et al., 1996). Weiss et al. (1996) found in cryomicrospectrophotometric measurements that SaO2 in the cortex arterioles was significantly lower (94%) than in systemic blood gas measurements (98%). Using a lower value of SaO2 ⳱ 94% would result in a 7% higher rOEF for the ischemic ROI-1 and a slightly smaller decrease in rCMRO2 (61% of control instead of 59% of control). Although the baseline optical property data are well modeled by the semiinfinite diffuse photon density wave solution, it is instructive to considered the influence of alternate baseline optical properties. Cheng and Boas (1999) have investigated the errors that are introduced into DOT reconstructions when the baseline optical properties are incorrect. They have found that whereas the absolute concentrations are strongly influenced, the relative changes in concentration are not significantly altered. A 100% change in baseline optical properties introduces a less than a 5% error in relative concentrations. If, for example, baseline [HbT] ⳱ 50 mol/L, this would not significantly affect the relative measures of rOEF and rCMRO2. We note that, in principle, it is also possible to reconstruct scattering using the frequency domain data. Although very interesting within the context of ischemia, scattering images warrant a detailed discussion beyond the scope of this article and will be pursued in a future publication. The emphasis of the present report is on hemodynamic and CMRO2 contrasts, which depend on absorption contrasts. Over the course of these observations (1 hour of MCA occlusion and 1 hour of reperfusion), the degree of cerebral edema is quite small, peaking at about 7% at the end of the reperfusion period (Lollmar et al., 2002). Reports of in vivo light scattering measurements during stroke are limited. The magnitudes are fairly small (e.g., for cortical spreading depression ␦⬘s/⬘s < 10%; Kohl et al., 1998a) and would have a minimal impact on our absorption analysis. With the current unresolved modeling issues, the calculation is better regarded as an index of CMRO2 rather than a direct measure. There are some promising methods that evaluate venous saturation through temporal correlations to breathing that may aid the compartmental analysis (Franceschini et al., 2001). Similar issues are present with MRI data in which the values of CBV, BOLD, and CBF measures are combined to calculate CMRO2 values (Hoge et al., 1999; Hyder et al., 1998; Mandeville et al., 1999). J Cereb Blood Flow Metab, Vol. 23, No. 8, 2003 920 J. P. CULVER ET AL. FIG. 9. Percent error in rOEF as a function of compartment (arteriolar, capillary, venous) parameters. The x-axis (arteriolar contribution) is the percent of the k5 changes that is absorbed by changes in the arteriolar fraction, and the y-axis is the change in k2 (capillary contribution) that may occur during ischemia. (A) Error in rOEF if it is assumed that k5 decreases by 20% during ischemia; (B) Error in rOEF if k5 remains constant during ischemia; (C) Error in rOEF if k5 increases by 20% during ischemia. Although most of the errors are quite small, under a confluence of unlikely changes in the compartmental contributions during ischemia (for example, a decrease in the capillary contribution of 20% with all of this decrease going to the venules) the errors can become significant. Ultimately, independent validation of rCMR O 2 through concurrent PET studies will be of great use, but such measurements are beyond the scope of this article. Instead, we have compared our measures with previous ex vivo cryomicrophotometric studies and in vivo PET studies and found reasonable agreement, though no PET rCMRO2 studies have been performed for the specific rat model used here. Comparison with previous diffuse optical studies A few recent studies used diffuse optical measures to image lesions in the brain. Benaron and coworkers (Hintz et al., 1999) carried out an extensive clinical optical imaging study. Tomographic images were obtained from time-resolved data on eight neonates in the intensive care unit. Examination of optical images of hemoglobin saturation revealed focal regions of low oxygenation after intracranial hemorrhage. Blinded clinical comparison of optical images with ultrasound, computed tomography, and MRI demonstrated that the optical scan correlated well with both computed tomography and MRI findings. Kusaka et al. (2001) topographically imaged CBF using the NIRT system by Hitachi and indocyanine green (ICG) bolus kinetic methods. The NIRT J Cereb Blood Flow Metab, Vol. 23, No. 8, 2003 CBF images of infants with infarcts and hemorrhage compared well with SPECT measures of CBF. In related animal studies, diffuse optical backprojection images of CBV were evaluated for detection thresholds of ischemia and hematoma in piglets (Stankovic et al., 1999). Importantly, the bolus kinetic flow images and the CBV detection threshold study used backprojection techniques, which lack the accuracy afforded by tomography methods with overlapping measurements. Exposed cortex reflectance imaging, with both spectroscopy (Mayhew et al., 2000) and speckle contrast flow (Dunn et al., 2001, Dunn et al., 2003), provides increased resolution over the images presented in this paper. However, our DOT imaging is transcranial in rat and the skull is left completely intact. Reflectance imaging will not work in these situations. The skin can also be left intact for DOT studies (Siegel et al., 2003), facilitating more practical longitudinal studies. Previous DOT with correlation flowmetry has been accomplished in phantoms (Boas and Yodh, 1997) and to a limited extent by backprojection in hypercapnia (Cheung et al., 2001). To the best of our knowledge, the present images are the first in vivo images of rCBF obtained using the DOT correlation approach. DIFFUSE OPTICAL TOMOGRAPHY OF rCMRO2 DURING FOCAL ISCHEMIA One general advantage that correlation flowmetry imaging shares with laser Doppler and speckle contrast measures is relatively high temporal sampling rate. The laser speckle methods do not require bolus injections, and are therefore not hampered by bolus clearance times. For example, ICG has a clearance time of longer than 6 minutes, and PET and single-photon emission computed tomography flow measures typically have repetition times of minutes to hours With MRI, gadolinium injections have a clearance time of approximately 20 minutes. Recently, arterial spin labeling MRI methods have afforded improved temporal sampling (minutes); however, signal-to-noise considerations generally require approximately 20 minute frame averaging (Zaharchuk et al., 2000). One advance of the Zaharchuk method was the ability to simultaneous image both CBV and CBF (Zaharchuk et al., 2000) with a signal-to-noise limited frame rate of ∼15 minutes. The DOT methods presented here simultaneously imaged flow, volume and tissue saturation concurrently with a frame rate of approximately 2.8 minutes. CONCLUSION We have derived images of rCMRO2 using static and dynamic diffuse optical tomography. To our knowledge these are the first such images. The rCMRO2 index is synthesized from diffuse optical measures of CBF and OEF obtained from correlation spectroscopy and absorption spectroscopy respectively. This index of metabolism yielded rCMRO2 for penumbral tissue in reasonable agreement with previous cryomicrospectrophotometric and PET studies of ischemia. In addition in previous papers, synthesis of the same variables during hypercapnia (Cheung et al., 2001) and hypoxia (Culver et al., 2002a) did not show a modulation in rCMRO2, though similar changes in flow and oxygen extraction fractions were observed. These results indicate that the synthesis of these independent optical measures correctly characterizes trends in rCBF, rCBV, rOEF, and rCMRO2. We also provided simultaneous rCBF and rCBV measures that show a flow-volume mismatch, which has been recently observed with MRI, and may have potential use for evaluation of ischemia progression. Therapeutic interventions can benefit greatly from quantitative, temporally dense serial mapping of brain function and pathophysiology. Optical imaging, as demonstrated in this article, affords the opportunity to simultaneously measure all of the relevant hemodynamic parameters including blood oxygenation, blood flow, and blood volume. Furthermore, optical technology is amenable to dense temporal sampling for longitudinal studies, something that can be impractical with fMRI and PET. Though correlation spectroscopy may be more limited than traditional NIRS methods with respect to depth 921 of penetration, there should be opportunities in pediatrics. Furthermore, bolus kinetic methods for flow can be used in adult humans and so the methods presented for generating rCMRO2 images can be extended to adults using DOT bolus flow images. We emphasize that the reported spatio-temporal performance is not limited by fundamental DOT physics, but rather by the current instrumentation. In particular, the system used in the present studies is limited by the channel count (4 detectors and 12 sources), the switching speed between source positions, and the data-acquisition rate of the correlation flowmetry instrumentation. In principle, these need not be limiting factors, and it is fairly straightforward to engineer solutions for them. The detector channel count can be increased, the source switch time can be drastically decreased through use of galvo-based systems, and the correlation instrumentation acquisition speed can also be increased. Collectively, these advances would significantly enhance imaging performance, providing approximately 10-Hz frame rates, full-head three-dimensional imaging, and cortical resolution of approximately 1 mm. For example, high sampling rates have already been achieved with continuouswave imaging systems for studies of functional activation (concentration only) (Siegel et al., 2003); we have also achieved large fields of view and threedimensional imaging in the context of diffuse optical breast imaging (Culver et al., 2003). These and other areas of system advancement have been realized with subsets of the demonstrated technology. As new systems synthesizing these advances are developed, we expect the quality of information obtained with DOT to greatly improve, yielding an important tool for studies of, for example, stroke physiology. APPENDIX Reconstructing hemoglobin concentrations We modeled frequency-domain diffuse photon density waves using an extrapolated zero boundary, semi-infinite media solution (Haskell et al., 1994). The diffuse wave fluence rate, ⌽i, for source position, rs(i), and detector position, rd(i), is ⌽共rs(i),rd(i)兲 = 3s⬘S0 4 冉 冊 eikr1 eikr2 − . r1 r2 (A1) The attenuation coefficient, k, is defined k2 ⳱ 3s⬘ (−i/ + a), where a is the tissue absorption coefficient, s⬘ is the tissue scattering coefficient, is the source modulation frequency, is the speed of light in the medium, and S0 is the point-source amplitude and phase. The distances to the real source, r1 = |rs(i) − zoẑⳮrd(i)|, and the image source, r2 = |rs(i) + 共zo + 2zB兲ẑ − rd(i)|, are defined by a source depth, zo ⳱ 1/s⬘, and zB ⳱ 2/3s⬘, the extrapolated zero boundary distance. J Cereb Blood Flow Metab, Vol. 23, No. 8, 2003 922 J. P. CULVER ET AL. Differential image reconstructions were obtained using a linear Rytov approximation approach (Kak and Slaney, 1988). In this scheme, the total diffuse wave fluence, ⌽, is written as field correlation function Gm 1 共r,i 兲 ≡ 具E共r,t 兲⭈E共r,t + 兲典 satisfies the following diffusion equation: 兵− ⵜ2 + k2d其Gm 1 共rd,i 兲 = 3 ⬘ s S共rs 兲 ⌽ = ⌽o exp共⌽scat兲 (A2) The total fluence, ⌽, consists of a background field, ⌽o, which depends on background optical properties, and a perturbed field, ⌽scat, which is linearly related to a set of spatial variations in the optical properties ␦a and ␦s⬘. Experimental measurements of ⌽ on the sample surface lead to images of the spatially varying absorption via solution of a least-squares problem. In this work, we only used the intensity data and only reconstructed absorption perturbations. The Rytov formulation of the scattered field is written in discrete notation as y ⳱ Ax with the following definitions (Culver et al., 2001; Oleary et al., 1995): 冋 yi = ln Ai,j = − ⌽共rs(i),rd(i)兲 ⌽o共rs(i),rd(i)兲 册 (A3) vh3 G共rs(i),rj兲G共rj,rd(i)兲 Do G共rs(i),rd(i)兲 For a point source at where kd 共兲 = 3s⬘a + rs(i), S共rs兲 = ␦共rs − rs(i)兲, the correlation function meam sured at a detector rd(i) is, Gm 1 共rd(i),i 兲 = 3⬘ sH1 m 共rs(i),rd(i),i兲, where H1 共rS(i),rd(i),i兲 is the appropriate greens function solution to the diffusion equation. Here the solution is for the semi-infinite medium, similar to that for diffuse photon density wave spectroscopy outlined previously, (A5) th Here, rs(i) and rd(i) are the position of the i source and ith detector, respectively, and G is the Greens function of the photon diffusion equation for the given the boundary conditions and optical properties. The semi-infinite solution discussed previously was used to calculate G. The inverse problem, with Tikhonov regularization, is expressed as minimizing the following objective function: min 兵㛳ymeas − Ax㛳22 + ␣㛳Lx 㛳22}. Aij = 6⬘s2k20i共⭸r3兲 Reconstructing flow Flow reconstructions followed a similar scheme as the hemoglobin reconstructions. The diffuse light electric 再 Gm 1 共rs(i),rd(i), i 兲 G01 共rs(i),rd(i), i兲 冎 H01共rs(i),rj,i兲H01共rs(i),rj,i兲 H01共rs(i),rd(i),i兲 (A9) (A10) In addition to the source and detector positions, the correlation data are parameterized by a correlation decay time (). To reduce the data size, a single time point was chosen for each source-detector pair. In particular, a time was chosen such that x = ␦⌫共rj兲, (A6) The penalty term for image variance, ␣㛳Lx㛳22, is a pseudonorm, and depth-dependent regularization was used where the diagonal of L ⳱ sqrt(diag(ATA)). A # solution, x = A,␣ ymeas, was obtained using a Moore# = L−1ÃT(ÃTà + Penrose generalized inverse with A,␣ −1 −1 ␣I兲 ymeas, where à = ÃL . Finally, the images were smoothed with a Gaussian filter with FWHM ⳱ 1.5 mm. The value of ␣ and the Gaussian smoothing kernel were optimized to provide even imaging across the field of view as judged by evaluating point, line, and half-space objects using a resolution matrix analysis and contrast to noise assessments (Culver et al., 2003). (A8) We assumed a homogenous semi-infinite baseline Go1 共rd(i),rs(i)i兲 and a spatial-temporally perturbed Gm 1 共rs(i),rs(i)i兲. For a flow perturbation, ␦⌫, the Rytov formulation of the scattered field is written, following the previous example, in discrete terms as: y = ln xj = ⭸a . J Cereb Blood Flow Metab, Vol. 23, No. 8, 2003 e−kD共i兲ⱍrs(i)−zoẑ−rd(i)ⱍ ⱍrs(i) − zoẑ − rd(i)ⱍ e−kD共i兲ⱍrs(i)+共zo+2zB兲ẑ−rd(i)ⱍ − . ⱍrs(i) + 共zo + 2zB兲ẑ − rd(i)ⱍ Hm 1 共rs(i),rd(i),i 兲 = (A4) j (A7) 6⬘s2k2o⌫. 2 (A11) and at which the correlation has decayed to 1/e from the ⳱ 0 value. An approximate solution, kD共i兲 − k共 = 0兲 = 1 Ⲑⱍrsi − ridⱍ, was used to define a i for each sourced detector pair and in turn defined the sensitivity matrix A. The flow sensitivity matrix was inverted using the same approach as discussed previously, and flow images were obtained using i = 1 ⱍrSi − i 2 rD ⱍ . 6⬘s2k20⌫0 The scattered fields at time were generated by fitting the individual curves to semiinfinite solutions for ⌫i(t) so as to integrate the signal over the entire decay curve acquired. The scattered field, yi(t), was then computed # ymeas. Because the flow perturfrom the fitted x = AF,␣ bations are quite large, the reconstructions were scaled to DIFFUSE OPTICAL TOMOGRAPHY OF rCMRO2 DURING FOCAL ISCHEMIA match the bulk semiinfinite calculations over matching tissue volumes. Once the inverted sensitivity matrices were computed, as outlined in this Appendix, they were stored and used to convert the raw data vectors for both hemoglobin concentrations and flow into time-series images for each rat. Acknowledgments: The authors acknowledge and are thankful for many useful conversations with Britton Chance and David A. Boas. REFERENCES Alkayed NJ, Harukuni I, Kimes AS, London ED, Traystman RJ, Hurn PD (1998) Gender-linked brain injury in experimental stroke. Stroke 29:159—166 Ances BM, Wilson DF, Greenberg JH, Detre JA (2001) Dynamic changes in cerebral blood flow, O-2 tension, and calculated cerebral metabolic rate of O-2 during functional activation using oxygen phosphorescence quenching. J Cereb Blood Flow Metab 21:511—516 Barbour RL, Graber HL, Chang J, Barbour SS, Koo PC, Aronson R (1995) MRI-guided optical tomography: prospects and computation for a new imaging method. IEEE Comp Sci Eng 2:63—77 Benaron DA, Hintz SR, Villringer A, Boas D, Kleinschmidt A, Frahm J, Hirth C, Obrig H, van Houten JC, Kermit EL, Cheong WF, Stevenson DK (2000) Noninvasive functional imaging of human brain using light. J Cereb Blood Flow Metab 20:469—477 Boas DA, Campbell LE, Yodh AG (1995) Scattering and imaging with diffusing temporal field correlations. Phys Rev Lett 75:1855—1858 Boas DA, Culver JP, Stott JJ, Dunn A (2002) Three dimensional Monte Carlo code for photon migration through complex heterogeneous media including the adult human head. Opt Express 10:159—170 Boas DA, Gaudette T, Strangman G, Cheng XF, Marota JJA, Mandeville JB (2001) The accuracy of near infrared spectroscopy and imaging during focal changes in cerebral hemodynamics. Neuroimage 13:76—90 Boas DA, Yodh AG (1997) Spatially varying dynamical properties of turbid media probed with diffusing temporal light correlation. J Opt Soc Am A Opt Image Sci Vis 14:192—215 Cheng X, Boas DA (1999) Systematic diffuse optical image errors resulting from uncertainty in the background optical properties. Opt Express 4:299—307 Cheung C, Culver JP, Yodh AG, Takahashi K, Greenberg JH (2001) In vivo cerebrovascular measurement combining diffuse nearinfrared absorption and correlation spectroscopies. Phys Med Biol 46:2053—2065 Cubeddu R, D’Andrea C, Pifferi A, Taroni P, Torricelli A, Valentini G (2000) Effects of the menstrual cycle on the red and near-infrared optical properties of the human breast. Photochem Photobiol 72:383—391 Culver JP, Choe R, Holboke MJ, Zubkov L, Durduran T, Slemp A, Ntziachristos V, Chance B, Yodh AG (2003) Three dimensional diffuse optical tomography in the plane parallel transmission geometry: evaluation of a hybrid frequency domain/continuous wave clinical system for breast imaging. Med Phys 30:235—247 Culver JP, Durduran T, Cheung C, Yodh AG, Takahashi K, Greenberg JH (2002a) Diffuse optical measurement of hemoglobin and cerebral blood flow in rat brain during hypercapnia, hypoxia, and cardiac arrest. Adv Exp Med Biol 510:48 Culver JP, Ntziachristos V, Holboke MJ, Yodh AG (2001) Optimization of optode arrangements for diffuse optical tomography: a singular-value analysis. Opt Lett 26:701—703 Culver JP, Siegel AM, Franceschini MA, Marota JJ, Mandeville JB, Boas DA (2002b) A comparison of hemodynamic contrasts for functional imaging with diffuse optical tomography. In: ISMRM 2002, Honolulu, Hawaii: ISMRM, p 650 Delpy DT, Cope M, van der Zee P, et al (1988) Estimation of optical pathlength through tissue from direct time of flight measurement. Phys Med Biol 33:1433—1442 Detre JA, Alsop DC (1999) Perfusion magnetic resonance imaging 923 with continuous arterial spin labeling: methods and clinical applications in the central nervous system. Eur J Radiol 30:115—124 Dunn AK, Devor A, Bolay H, et al (2003) Simultaneous imaging of total cerebral hemoglobin concentration, oxygenation, and blood flow during functional activation. Opt Lett 28:28–30 Dunn AK, Bolay H, Moskowitz MA, Boas DA (2001) Dynamic imaging of cerebral blood flow using laser speckle. J Cereb Blood Flow Metab 21:195–201 Fantini S, Hueber D, Franceschini MA, Gratton E, Rosenfeld W, Stubblefield PG, Maulik D, Stankovic MR (1999) Non-invasive optical monitoring of the newborn piglet brain using continuouswave and frequency-domain spectroscopy. Phys Med Biol 44:1543—1563 Firbank M, Arridge SR, Schweiger M, Delpy DT (1996) An investigation of light transport through scattering bodies with nonscattering regions. Phys Med Biol 41:767—783 Frackowiak RS, Lenzi GL, Jones T, Heather JD (1980) Quantitative measurement of regional cerebral blood flow and oxygen metabolism in man using 15O and positron emission tomography: theory, procedure, and normal values. J Comput Assist Tomogr 4:727—736 Franceschini MA, Boas DA, Zourabian A, Solomon GD, Nadgir S, Lin DW, Moore JB, Fantini S (2002) Near infrared spiroximetry: noninvasive measurements of venous saturation in piglets and human subjects. J Appl Physiol 91:372–384 Gesztelyi G, Finnegan W, DeMaro JA, Wang JY, Chen JL (1993) Parenchymal microvascular systems and cerebral atrophy in spontaneously hypertensive rats. Brain Res 611:249—257 Grinvald A, Lieke E, Frostig RD, Gilbert CD, Wiesel TN (1986) Functional architecture of cortex revealed by optical imaging of intrinsic signals. Nature 324:361—364 Grubb RL, Raichle ME, Eichling JO, Terpogos MM (1974) Effects of changes in Paco2 on cerebral blood volume, blood flow, and vascular mean transit time. Stroke 5:630—639 Hale GM, Querry MR (1973) Optical constants of water in the 200 nm to 200 m wavelength region. Appl Opt 12:555—563 Haskell RC, Svaasand LO, Tsay TT, Feng TC, McAdams MS (1994) Boundary conditions for the diffusion equation in radiative transfer. J Opt Soc Am A Opt Image Sci Vis 11:2727–2741 Heiss WD, Graf R, Lottgen J, Ohta K, Fujita T, Wagner R, Grond M, Weinhard K (1997) Repeat positron emission tomographic studies in transient middle cerebral artery occlusion in cats: residual perfusion and efficacy of postischemic reperfusion. J Cereb Blood Flow Metab 17:388—400 Heiss WD, Graf R, Wienhard K, Lottgen J, Saito R, Fujita T, Rosner G, Wagner R (1994) Dynamic penumbra demonstrated by sequential multitracer PET after middle cerebral artery occlusion in cats. J Cereb Blood Flow Metab 14:892—902 Hintz SR, Cheong WF, Van Houten JP, Stevenson DK, Benaron DA (1999) Bedside imaging of intracranial hemorrhage in the neonate using light: comparison with ultrasound, computed tomography, and magnetic resonance imaging. Pediatr Res 45:54—59 Hoge RD, Atkinson J, Gill B, Crelier GR, Marrett S, Pike GB (1999) Investigation of BOLD signal dependence on cerebral blood flow and oxygen consumption: the deoxyhemoglobin dilution model. Magn Reson Med 42:849—863 Hueber DM, Franceschini MA, Ma HY, Zhang Q, Ballesteros JR, Fantini S, Wallace D, Ntziachristos V, Chance B (2001) Noninvasive and quantitative near-infrared haemoglobin spectrometry in the piglet brain during hypoxic stress, using a frequency-domain multidistance instrument. Phys Med Biol 46:41—62 Hyder F, Shulman RG, Rothman DL (1998) A model for the regulation of cerebral oxygen delivery. J Appl Physiol 85:554—564 Intaglietta M, Johnson PC, Winslow RM (1996) Microvascular and tissue oxygen distribution. Cardiovasc Res 32:632—643 Jobsis FF (1977) Nonivasive, infrared monitoring of cerebral and myocardial oxygen sufficiency and circulatory parameters. Science 198:1264—1267 Kak AC, Slaney M (1988) Principles of computerized tomographic imaging. New York: IEEE Press Kohl M, Lindauer U, Dirnagl U, Villringer A (1998a) Separation of changes in light scattering and chromophore concentrations during cortical spreading depression in rats. Opt Lett 23:555—557 Kohl M, Nolte C, Heekeren HR, Horst S, Scholz U, Obrig H, Villringer J Cereb Blood Flow Metab, Vol. 23, No. 8, 2003 924 J. P. CULVER ET AL. A (1998b) Determination of the wavelength dependence of the differential pathlength factor from near-infrared pulse signals. Phys Med Biol 43:1771—1782 Koizumi J, Nakazawa T, Yoshida Y (1985) Reperfusable brain infarction model in the rat (abstract). In: Proceedings of the 10th Meeting of the Japanese Stroke Society, Kyoto, Japan: Japanese Stroke Society, p 159 Kusaka T, Isobe K, Nagano K, Okubo K, Yasuda S, Kondo M, Itoh S, Onishi S (2001) Estimation of regional cerebral blood flow distribution in infants by near-infrared topography using indocyanine green. Neuroimage 13:944–952 Lollmar R, Schabitz WR, Heiland S, Georgiadis D, Schellinger PD, Bardutzky J, Schwab S (2002) Neuroprotective effect of delayed moderate hypothermia after focal cerebral ischemia. An MRI study. Stroke 33:1899–1904 Longa EZ, Weinstein PR, Carlson S, Cummins R (1989) Reversible middle cerebral artery occlusion without craniectomy in rats. Stroke 20:84—91 Malonek D, Grinvald A (1996) Interactions between electrical activity and cortical microcirculation revealed by imaging spectroscopy: implications for functional brain mapping. Science 272:551–554 Mandeville JB, Marota JJA, Ayata C, Moskowitz MA, Weisskoff RM, Rosen BR (1999) MRI measurement of the temporal evolution of relative CMRO2 during rat forepaw stimulation. Magn Reson Med 42:944—951 Mayhew J, Johnston D, Berwick J, Jones M, Coffey P, Zheng Y (2000) Spectroscopic analysis of neural activity in brain: Increased oxygen consumption following activation of barrel cortex. Neuroimage 12:664—675 Mayhew J, Johnston D, Martindale J, Jones M, Berwick J, Zheng Y (2001) Increased oxygen consumption following activation of brain: theoretical footnotes using spectroscopic data from barrel cortex. Neuroimage 13:975—987. Mayhew J, Zheng Y, Hou YQ, Vuksanovic B, Berwick J, Askew S, Coffey P (1999) Spectroscopic analysis of changes in remitted illumination: the response to increased neural activity in brain. Neuroimage 10:304—326 Narayanan U, Chi OZ, Liu X, Weiss HR (2000) Effect of AMPA on cerebral cortical oxygen balance of ischemic rat brain. Neurochem Res 25:405—411 Nielsen AN, Fabricius M, Lauritzen M (2000) Scanning laser-Doppler flowmetry of rat cerebral circulation during cortical spreading depression. J Vasc Res 37:513—522 Nomura Y, Hazeki O, Tamura M (1997) Relationship between timeresolved and non-time-resolved Beer-Lambert law in turbid media. Phys Med Biol 42:1009–1022 Oleary MA, Boas DA, Chance B, Yodh AG (1995) Experimental images of heterogeneous turbid media by frequency-domain diffusing-Photon tomography. Opt Lett 20:426—428 Patterson M, Chance B, Wilson B (1989) Time resolve reflectance and transmittance for the noninvasive measurement of tissue optical properties. Appl Opt 28:2331—2336 Pogue BW, Paulsen KD (1998) High-resolution near-infrared tomographic imaging simulations of the rat cranium by use of apriori J Cereb Blood Flow Metab, Vol. 23, No. 8, 2003 magnetic resonance imaging structural information. Opt Lett 23:1716—1718 Prahl S (2002) Optical absorption of hemoglobin. Oregon Medical Laser Center, Portland, OR Ripoll J, Nieto-Vesperinas M, Arridge SR, Dehghani H (2000) Boundary conditions for light propagation in diffusive media with nonscattering regions. J Opt Soc Am A Opt Image Sci Vis 17:1671—1681 Schweiger M, Arridge SR (1999) Optical tomographic reconstruction in a complex head model using a priori region boundary information. Phys Med Biol 44:2703—2721 Siegel AM, Culver JP, Mandeville JB, Boas DA (2003) Temporal comparison of functional brain imaging with diffuse optical tomography and fMRI during rat forepaw stimulation. Phys Med Biol 48:1391–1403 Sorensen AG, Copen WA, Ostergaard L, Buonanno FS, Gonzalez RG, Rordorf G, Rosen BR, Schwamm LH, Weisskoff RM, Koroshetz WJ (1999) Hyperacute stroke: Simultaneous measurement of relative cerebral blood volume, relative cerebral blood flow, and mean tissue transit time. Radiology 210:519—527 Stankovic MR, Maulik D, Rosenfeld W, Stubblefield PG, Franceschini MA, Hueber D, Gratton E, Fantini S (1999) First RealTime optical imaging of experimental brain ischemia and hemorrhage in neonatal piglets. Pediatr Res 45:2050 Takahashi K, Greenberg JH, Jackson P, Maclin K, Zhang J (1997) Neuroprotective effects of inhibiting poly(ADP-ribose) synthetase on focal cerebral ischemia in rats. J Cereb Blood Flow Metab 17:1137—1142 Villringer A, Chance B (1997) Non-invasive optical spectroscopy and imaging of human brain function. Trends Neurosci 20:435—442 Vinogradov SA, Lo LW, Jenkins WT, et al (1996) Noninvasive imaging of the distribution in oxygen in tissue in vivo using nearinfrared phosphors. Biophys J 70:1609–1617 Weiss HR, Sinha AK, Lu XW (1996) Effect of up-regulation of NMDA receptors on cerebral O-2 consumption and blood flow in rat. Brain Res 730:193—198 Williams DS, Detre JA, Leigh JS, Koretsky AP (1992) Magnetic resonance imaging of perfusion using spin inversion of arterial water. PNAS 89:212—216 Wray S, Cope M, Delpy DT (1988) Characteristics of the near infrared absorption spectra of cytochrome aa3 and hemoglobin for the noninvasive monitoring of cerebral oxygenation. Biochim Biophys Acta 933:184—192 Zaharchuk G, Bogdanov AA Jr, Marota JJ, Shimizu-Sasamata M, Weisskoff RM, Kwong KK, Jenkins BG, Weissleder R, Rosen BR (1998) Continuous assessment of perfusion by tagging including volume and water extraction (CAPTIVE): a steady-state contrast agent technique for measuring blood flow, relative blood volume fraction, and the water extraction fraction. Magn Reson Med 40:666—678 Zaharchuk G, Yamada M, Sasamata M, Jenkins BG, Moskowitz MA, Rosen BR (2000) Is all perfusion-weighted magnetic resonance imaging for stroke equal? The temporal evolution of multiple hemodynamic parameters after focal ischemia in rats correlated with evidence of infarction. J Cereb Blood Flow Metab 20:1341—1351


© Copyright 2026