
02 A New Approach - BERA Brand Management
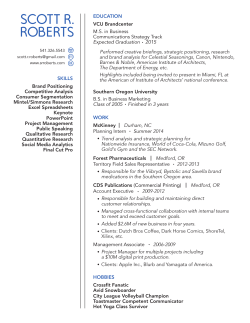
02
Brand Management
A New
Approach
Marketing Investment
and Brand Value
Introduction
One of the most challenging problems in marketing is determining the likely impact of
advertising and promotion investments on the value of a brand. The problem has three root
causes: (1) the true economic drivers of brand value are not clearly specified; (2) the way in
which marketing investment impacts the drivers is not well understood; and (3) there is no
reliable way to measure and monitor the drivers and their KPIs.
In most companies, mix modeling is used to estimate how marketing investments will impact
volume, sales and profit contribution. While mix models can be helpful, relying on their
forecasts presents two big issues. First, the models are built using historical data and the past
is seldom prologue in today’s fast moving environment; second, the models seldom, if ever,
incorporate how marketing investments change consumer perceptions and how these changes
impact brand value. By ignoring this crucial relationship, mix models tend to be biased toward
promotions that offer short-term lift often at the expense of long-term brand health. In
addition, the financial impact of brand response is typically far larger than the volume
response – for some brands, 2 to 4 times larger. This is because brand perceptions are key
drivers of the brand’s value multiple while the volume response only impacts current earnings
at the margin. The exhibit below provides a high level view of how both volume response and
brand response can be linked to provide a comprehensive solution:
Exhibit 1: Overview of Model
“Domain of
Mix Modeling”
Volume
Response
Marketing
Investment
“Spend-toScore”
“Issue for Some
Brands”
Brand
Value
Brand
Response
02/09
“Score-toPerformance”
Understanding Brand Response
We believe understanding brand response and linking it to brand value is a significant new
innovation. To understand how the innovation works, we first need a model that connects
brand perceptions to brand value so we can identify the key drivers, and then second need a
way of measuring the change in perceptions and estimating how they will impact brand
economics and value.
This model we use is illustrated below.
Exhibit 2: Brand Economic Framework
Category
Profitability
and Growth
Consumer
Perceptions
Uniqueness
+
Brand Pricing
Power and
Market Share
Differentiation
Position
Brand
Value
Meaningfulness
Brand
Costs,
Assets
and Risk
The model is based on the classic discounted cash flow analysis familiar to all CFOs. Cash flow
has two key financial drivers: profitability and growth over time (e.g., high profitability and
low growth generate a lot of cash flow). For any brand, profitability and growth depend
primarily on the economics of the category (overall category profitability and growth) and the
brand's differentiation position. When a brand is highly differentiated, consumers are willing to
pay a significant price premium that translates into higher margins, gains in market share or
both. And if the nature of the differentiation advantage is difficult for competitors to match,
the high margins and fast growth can be sustained over time. It is this combination –
sustained high profitability and growth that produce high valuation multiples.
03/09
Digging deeper, a brand's differentiation position has two key drivers: consumer perceptions
of distinctiveness or uniqueness and consumer perceptions of the brand's relevance or
meaningfulness. Perceptions of uniqueness cause consumers to be willing to pay a premium
price for the brand while meaningfulness causes the brand to be purchased at high volume
since it appeals to a large audience. Niche brands are those that are very unique but not very
meaningful or relevant; commodity brands are very meaningful but not unique. The sweet
spot of differentiation is a strong combination of both uniqueness and meaningfulness. Other
perceptions such as awareness and regard have roles to play in the buying decision but it is
these two that link directly to brand economics and value.
Measuring the levels and changes of a brand's uniqueness and meaningfulness requires a
large, frequent and consistent survey of consumers which is what BERA Brand Management
(BBM) has developed. The BERA survey is the largest, most comprehensive data base of brand
perceptions in the industry. The survey gathers 20,000 responses per week and includes over
4,000 brands in 200 different categories. Using a proprietary, on-line questionnaire, the survey
gathers perceptions of four key brand drivers -- the two drivers of differentiation --Uniqueness (U) and Meaningfulness (M) plus two additional drivers that help explain a brand's
current performance -- Familiarity (F) and Regard (R). For each of the four, BERA identifies
how consumers perceive the role of the Five P's -- promotion (includes all marketing
communication), product, pricing, place (distribution) and people (customer service).
In addition, BERA segments the market for the brand by 'consumer engagement', providing
estimates of the size of loyal consumers, switchers, prospects, win-backs, lapsed consumers
and rejectors. The ratio of loyals-to-switchers (L/S) is of particular interest as it provides
information on the durability of a brand's differentiation position -- the higher the L/S ratio, the
more sustainable the advantage. This has an important and direct impact on brand value since
the longer the duration of a differentiation advantage, the higher the stream of cash flow. (For
more information on the survey and how it can be used, click on this link
www.BERAfindlove.com).
Linking these measures of differentiation to brand value requires two steps depicted by the
two legs of the southern path in Exhibit 1.
First, the ‘spend-to-score’ relationship for a brand can be estimated in two ways: by analyzing
historical spend and score data to build a predictive model and by running highly tailored
surveys that re-contact participants in the big BERA survey. The base level of U and M are
established and then the respondents are asked to re-rate their brand perceptions in light of
04/09
the marketing investment (new advertising, promotions, changes in functional performance,
etc.).
Second, the ‘score-to-performance’ relationship can be estimated using a predictive model that
based on how changing U and M scores correlated to changes in profitability, growth and
value multiples for 200 mono-brands from 20 sectors. For example, in one category, a 1%
increase in U and M resulted in a 3% increase in the ratio of brand value-to-revenue so for a
brand with revenue of $1B, a small 1% increase in both U and M would be worth in the zone
of $30m. In addition to the predictive model, we can use the brand value model to solve for
the required increase in U and M that will cause the marketing investment to ‘break even’
(zero net present value) which, in light of all the BERA data on U and M scores enables better
judgement calls to be made.
A Note on Volume Response
As mentioned above, mix models estimate volume response based on rigorous statistical
analysis of historical data. There are two additional ways that volume response can be
estimated. First, one can use a tailored survey to ask questions about purchase intentions.
This is particularly powerful if respondents to the BERA survey are re-contacted so both the
volume and brand responses come from the same people. The big issues with survey-based
volume responses is the difference between what people say they will do and what they
actually do. To correct this, BBM partners with Lin Consulting which has proprietary algorithms
that adjust raw responses based on a large data base of surveys done over 30 years (Dr. Lin
was a founder of BASES now owned by AC Nielsen).
In the last few years, a second approach has been developed to predict volume lift based on
in-market testing. BBM has partnered with a highly innovative firm called Applied Predictive
Technologies (www.predictivetechnologies.com) that has patented software enabling either
back testing of "natural experiments" or running highly controlled and efficient A:B tests of
marketing investments.
So there are now three ways to estimate the consumers’ volume response: use traditional mix
models based on history, use tailored surveys with adjustments that provide current intent and
use in-market testing to provide actual lift data from a sample of consumers.
As noted in Exhibit 1, there are two parts of the northern path between the marketing
investment and brand value. So far we’ve been addressing the first part – estimating the
volume response. The second part involves translating the volume response or lift into brand
05/09
value. For those brands that are highly profitable as measured by ROI (earnings divided by
capital employed), incremental earnings contributed can be linked to brand value by a simple
value multiple. But for brands that have ROIs in the 5% to 15% zone, a reasonably positive
volume response may not translate into much, if any brand value. This is caused by not
allocating all costs and assets so positive contribution may not generate positive net earnings
and also by the math of brand value creation – when a brand ROI is near its cost of capital
(typically around 10%), increasing volume has a muted effect on brand value. For these
brands, a more rigorous value analysis should be undertaken.
Using the Full Marketing Investment to Brand Value Model
The easiest way to visualize the results of the two different paths is to plot the location of
specific marketing investments on a simple matrix where the y-axis shows the volume
response and the x-axis shows the brand response as seen below.
Exhibit 3: Combined Impact of Marketing Investments
EP Accretive
Volume
Response
Concern Over
Commoditization
Win-Win
Lose-Lose
Hole vs. Treasure
Problem
0
EP Dilutive
Decline in
Differentiation
0
Increase in
Differentiation
Brand Response
The northeast quadrant is nirvana for marketing professionals as the investment produces
both positive volume and brand responses on brand value -- the classic win-win investment.
Equally clear is the southwest quadrant where investments diminish brand value both ways
(lose-lose). The other quadrants are more interesting and challenging.
06/09
In the northwest, the investment adds brand value from volume lift but diminishes value by
reducing the brand's differentiation position. This is the area that many marketing
professionals fear since the odds are pretty good that the investments in this quadrant are
dominated by promotions. When effective, promotions provide significant lift in revenue with
high ROMI estimates. However, promoting too much can damage the brand equity by lowering
consumer perceptions of uniqueness (commoditizing the brand).
Investments in the southeast quadrant offer a similar dilemma only here there is no near-term
volume lift while the survey responses tell us BERA scores will increase. This then is a classic
investment problem -- will the volume hole we dig in the near-term produce a big enough
treasure in higher differentiation to make it worthwhile?
While we have been elaborating on how the matrix can be used to evaluate the total impact of
marketing investments on a single brand, the matrix can also be used to analyze a portfolio of
brands. By plotting the two responses to the A&P investments supporting each brand, it is
possible to identify opportunities to redeploy resources across the brand portfolio.
Case Study
BERA Brand Management has used the complete brand value model for several clients in the
past year. For one client, the model was used to evaluate a new campaign that emerged from
a detailed state-of-the-brand analysis. The SOTB revealed that the client's brand had average
Meaningfulness scores but a low Unique score relative to the category averages and two direct
competitors. It also had a lower mix of loyal consumers and a higher mix of switchers than the
category. In addition, consumer felt that the technology used to provide the service was
getting stale and the service was falling behind in ease-of-use. In response, the client and
BBM team came up with an idea to buy a new complementary device that could be easily
integrated into the brand's service offer solving the ease-of-use issue and providing the
impression that the core technology was cutting edge. In addition to the functional
enhancement, the campaign included a substantial marketing investment -- giving away the
new device in exchange for a two year service contract with at a low promotional price
accompanied by $25m of advertising.
Since the core part of the campaign was a new device, historical data couldn't be used to
estimate consumer response so we worked with Lin Consulting to field a tailored survey. The
survey asked a large sample of both existing subscribers and prospects to respond in terms of
both purchase intent and brand perceptions. Lin then used its proprietary algorithms to
07/09
discount the stated purchase intent so they could provide a more accurate volume response.
The results indicated the campaign would be a win on both dimensions.
The adjusted volume response was very positive, indicating a lift that translated into an
increase in brand value of roughly $75m. The brand response was also very positive –
Meaningfulness rose a bit but the Unique score rose by nearly 10 points when respondents
were presented with the new offer and advertising. Using the predictive model mentioned
above, we estimated the increase in BERA scores would translate into nearly $125m in
additional brand value. Combining the two produced a total net value added of around $200m,
a clear win-win investment given the investment of $50m ( a detailed case study is available).
Conclusion
The two main innovations of this new approach are the ability to accurately assess the key
consumer perceptions using the BERA survey and a robust economic model that links
perception data to brand value. There is a third innovation -- integration of brand value
analytics into a holistic process capable of producing better, faster resource allocation
decisions. This process, illustrated below, cuts across the typical organizational silos and is
highly automated using compatible software-as-service platforms that combine deep consumer
insights with robust economic modeling, in-market testing and brand tracking.
Exhibit 4: Integrated Resource Allocation
New Facts
CREATE
ANALYZE
TEST
TRACK
“BERA SOTB
+
Baseline
Value”
“New Ideas
and Options
“Consumer
Responses
and Value
Impact”
“Design,
Execute and
Interpret”
“Consumer
Perceptions
and Financial
Results”
Strategic Partners:
•
•
•
•
BERA Brand Management (facts, CREATE, ANALYZE, TRACK)
Draftfield Analytics, Inc. (Facts, CREATE, ANALYZE)
Lin Consulting (ANALYZE)
Applied Predictive Technologies (ANALYZE, TEST)
08/09
We refer to this process as CATT since it involves Create-Analyze-Test-Track activities. Since
we believe that a single firm is unlikely to be capable of delivering the best-in-class solution for
each of these activities, BBM has combined the talents and assets of several other firms into a
strategic partnership capable of serving all B2C as well as most B2B companies. We welcome
the opportunity to provide additional information on any or all of these activities.
09/09


© Copyright 2026