
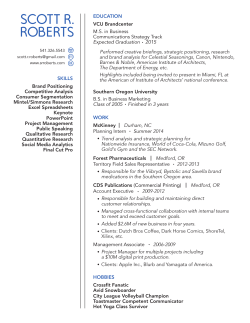
Session 2: Brand Equity
What’s Brand Equity? How do we measure it? What drives equity? How can we improve it? How do we make use of our knowledge and understanding of brand equity? Brand Equity 3 Brand Equity Brand equity is the incremental value that a brand derives from the thoughts and feelings that it evokes 4 iPod and ZEN … superior product features … superior brand equity (Sim Wong Hoo) Apple understood the teens and young adults market. 8 As people get to know a brand they develop thoughts and feelings about the brand. Brand equity is the incremental value that a brand derives from these thoughts and feelings. Awareness, interest, consideration Buzz, news, gossip, rumours, worries The persona that it exudes Images, symbols, emotions Benefits and their relevance Popular, fashionable, prestigious 10 Benefits of Brand Equity Loyal Customers Charge a price premium Trade co-operation Brand extensions Brand licensing Communication messages get through Brand equity yields profitability At a time when stakeholders are demanding greater accountability of marketing, the pursuit and measurement of brand equity should gain significance. No other asset compares with a high equity brand in its potential to generate future cash flow and sustain long term profitability. 15 Loyalty Pyramid Different levels of Engagement with Brand Recommenders Preferrers Dependables Regulars Consideration Trial Awareness Brand Loyalty Most Frequent Current Would Consider Ever Use TOM + Unaided + Aided 21 Measuring engagement at different levels of Loyalty Pyramid This example pertains to a market leader (?) ? +2: Recommenders has increased by + 2 % points versus prior period Recommenders 23 +2 Preferrers 25 +3 Dependables 24 +1 Use most often Regulars Considerers In customers repertoire Trialists Aware ensuring loyalty 44 63 70 52 ensuring performance Behavioural Loyalty providing relevance Relevance achieving presence Salience +4 +4 +6 44 100 Emotional Loyalty TOM Un-aided Aided 23 Brand Engagement: Personal Care Shopping (2006) FairPrice Guardian Sheng Siong Recommenders 33 +2 6 -3 11 +3 Preferrers 35 -1 7 -2 12 +4 Dependables 37 -1 7 -3 10 +3 Regulars Considerers Trialists Awareness +5 58 73 48 -4 89 71 29 99 Too Hard to Get to Unaided 27 16 +2 37 30 +4 -1 68 +2 Aided Unaided 52 45 0 58 TOM: 6% TOM: 40% Non considerers -5 28 +8 95 17 68 TOM: 7% Aided Unaided 70 86 +13 Aided 2 • Compared to Guardian, Sheng Siong has4much lower base of 12 regular shoppers and a significantly Not Aware higher base of recommenders and preferrers, reflecting relatively 1 14 weak behavioural loyalty and 5 relatively strong emotional loyalty. • Sheng Siong appears to be on high trajectory. On a relatively small base there are big increases at all levels of the loyalty pyramid. Take for instance that preferrers increased from 8 to 12%, reflecting a massive 50% increase. • Note also that Sheng Siong with only 17% unaided awareness is relatively unknown. The data suggests that it is a small, growing banner that offers some distinct advantages over competing stores. This is reflected in the high conversion from regular shoppers to dependables and recommenders. (It’s not clear at this juncture as to what factors are driving this behaviour). • FairPrice is exceptionally strong commanding 40% top-of-mind awareness and very high behavioural and emotional loyalty. Loyalty Matrix – Categorizing Brands (Banners) Bonded Reluctant Attracted Behavioural Loyalty Hi Tenuous Lo Lo Brand Loyalty Hi 29 Loyalty Matrix – FairPrice Segmenting Customers Hi Core Customers Behavioural Loyalty Potential Loss Tenuous 21% Reluctant 10% Bonded 37% Attracted 5% Potential Gain ? Non-Considerers 27% Lo Lo Brand Loyalty (attitudinal loyalty) Hi 34 Loyalty Matrix – Sheng Siong Segmenting Customers Hi Behavioural Loyalty Core Customers Lo Potential Loss Tenuous 2% Reluctant 13% Bonded 8% Attracted 7% Potential Gain ? Non-Considerers 70% Lo Brand Loyalty (attitudinal loyalty) Hi 35 Opportunity/Risk Analysis 35 Tenuous Attracted 21 31 13 Threat Opportunity Who To Defend Against Who To Target 38 Segment Strategies Reluctant Monitor What is undermining attraction? Tenuous Retention What is undermining Equity? How to preclude defection? Attracted Bonded Acquisition Maintenance What “hot buttons” need to be pressed to attain them? Reinforce, reward and retain. To answer some of these questions we need to understand what’s driving brand equity? 40 How can we measure brand equity? 43 The outcomes of brand equity can serve as a measures of brand equity Loyal Customers Charge a price premium Trade co-operation Brand extensions Brand licensing Communication messages get through 44 Simple approaches to measuring Brand Equity Net Promoter Index Net Advocacy Index Index based on a single measure – ‘willingness to recommend’ Unsolicited consumer generated media (CGM) The number of people willing to recommend your brand minus those who are not willing to do so. Sentiment analysis: NLP to assess the positive / negative / neutrality of the discussion Scale Promoters Willingness to recommend (Scale of 1 to 10) Detractors 10 9 8 7 6 5 4 3 2 1 0 NET = Promoters - Detractors % of Respondents Rating Promoters NET Detractors 45 Measuring Brand Equity – the Nielsen Winning Brand’s Approach Brand is said to command strong equity if it: • is a favourite brand amongst consumers • is a brand that consumers would recommend to their friends • is a brand that consumers are willing to pay price premium • (if consumers are willing to travel to secure this brand) • Brand Equity Index is calculated from analysis of a few key questions: - % who claim that it is their favourite brand … F% - % who say they will recommend the brand to somebody else … R% - % who state they are willing to pay price premium … P% Nielsen Brand Equity Index produces a weighted average score ranging from 0 - 10; the higher the better. Weights f, r, p are derived from factor analysis. 47 Nielsen’s Brand Equity Index > The Nielsen Brand Equity Index produces scores in range of 0 to 10; the higher the better. > Zero on this scale represents the lowest Index, meaning that a brand has no loyal customers, and nobody would pay any more than the cheapest price on the market. > Ten would be the highest Index, where everybody in the market is a loyal customer, and would willingly pay a significant price premium. > In competitive markets a score of 3+ is very strong. 0 No-one’s favorite No-one recommends No price premium None willing to travel to buy 3 10 Everyone’s favorite Everyone recommends Price acceptable to all All willing to travel to buy 52 Store Equity Index – Personal Care Shopping FairPrice appeals more to older age groups while Watsons and Guardian are preferred by younger age groups Store Equity Index 2006 by demographics (Age and Income) for key chains Age 15-24: 2.0 25-34: 2.6 35-39: 3.1 40-49: 4.0 50-65: 3.8 High – 3.4 Medium – 3.0 Low – 3.2 15-24: 25-34: 35-39: 40-49: 50-65: 4.3 2.5 1.9 1.8 1.3 High – 2.7 Medium – 2.5 Low – 1.4 15-24: 25-34: 35-39: 40-49: 50-65: 0.7 0.8 1.3 0.9 1.4 High – 0.5 Medium – 1.1 Low – 1.6 15-24: 25-34: 35-39: 40-49: 50-65: 1.3 1.2 0.8 0.7 0.7 High – 1.1 Medium – 1.0 Low – 0.7 15-24: 25-34: 35-39: 40-49: 50-65: 0.4 0.5 0.7 0.6 0.6 High – 0.6 Medium – 0.5 Low – 0.4 15-24: 25-34: 35-39: 40-49: 50-65: 0.5 0.4 0.6 0.6 0.6 High – 0.2 Medium – 0.6 Low – 0.7 Income 3.1 2.3 1.0 NTUC FairPrice Watsons Sheng Siong 0.9 Guardian 0.5 0.5 Giant Shop N Save What’s driving brand equity? Awareness, Consideration, Imagery, Attitudes What’s in their head determines what drives equity Drivers of equity How consumers engage with brand determines how much equity exists Recommenders Preferrers Equity Index 5.5 Dependables Regulars Considerers 2 2 2.5 Trialists Aware Brand 4 Brand 3 Brand 2 Brand 1 64 To understand what’s driving equity we need to determine what people know and how it influences their purchasing decisions … Awareness, Consideration, Imagery and Attitudes are driving brand equity Awareness, interest, consideration Buzz, news, gossip, rumours, worries The persona that it exudes Images, symbols, emotions Benefits and their relevance Popular, fashionable, prestigious 65 Product Attributes represent the perceived benefits, imagery, symbolism, attitudes (hypothetical example – personal care) Feelings • Feel feminine • Fashionable • Feel beautiful • Feel young • Feel joyous • Feel energetic & lively • Refreshing Ingredients, Health • With natural ingredients • Healthy skin Family Moisturizing • Reliable and trusted • Down to earth • Good value for money • Suitable for the whole family • Moisturizes effectively • Makes skin soft and smooth • Nourishes skin • Gentle on skin Lather, Fragrance • Lot of lather • Lingering fragrance • Like fragrance Brand Image Attributes Factor analysis used to summarize 20 attributes into 5 factors 67 Illustration of Correlation If the below pattern is observed across a large number of respondents, in that case attributes 1 to 3 and 4 to 6 are said to be highly correlated. Respondent Agreeing / Strongly Agreeing*: Brand A Brand B Brand C Brand D Yes Yes No No Yes Yes No No Yes Yes No No 4. Lot of lather No No Yes Yes 5. Lingering fragrance No No Yes Yes 6. Like fragrance No No Yes Yes Factor 1 1. Feel feminine 2. Feel beautiful 3. Feel young Factor 2 73 *Typically attribute rating is on 5 point rating scale . ‘Top-two’ box ratings (strongly agreeing, agreeing) used for factor analysis. Factor Analysis used to simplify data a multivariate statistical technique that is used to summarize information contained in a large number of variables into a smaller number of factors Inter dependence technique … no dependent variable Purpose – to simplify the data Based on patterns in the data (attribute ratings), the technique summarises many attributes into few factors - Attributes that are highly correlated with each other are grouped together under the same factor. - Attributes that have low or zero correlation with each other fall into different factors. Factor loading is the correlation between attribute and factor. Attributes with high loading help define the factor Factor naming: Usually some consistency among attributes that define a factor. Factor naming is a subjective process that combines understanding of market with inspection of variables that define the factor 78 Having measured brands’ Equity … it’s important to determine what’s driving it Factors driving Brand Equity 18% Consideration Drivers of Brand Equity 15% Awareness 19% Feelings 18% Ingredients, Health 14% Family 10% Moisturizing 6% Lather, Fragrance (personal care market) Brand Equity Index Output of Factor Analysis and Regression The factors plus awareness and consideration, are regressed to derive the importance or contribution of each factor to brand equity 79 Importance of factors in driving brand equity Regression to derive factor importance ƒ , , , … … The standardised coefficients ( , , … obtained from the multiple regression yield the importance of each factor in determining brand equity 88 Brand Equity Model: How to determine the importance of the drivers of brand equity 0. 1. 2. 3. 4. Compute Brand Equity Index. (Based on % of respondents that are emotionally loyal) The large number of attributes are summarize into a small number of factors using factor analysis Equity index is regressed on (i) factors obtained in step 1, (ii) awareness (% spontaneous awareness) and (iii) consideration (% who consider using) The coefficients of the multiple linear regression in step 2 reflect the importance or contribution of each factor to brand equity The importance of the individual attributes is derived from the factor weights and loading of the attributes on their factor 89 Consideration connotes the presence of brand in consumers’ repertoires High consideration score means: - Habit is a key driver of differentiation between brands … consumers have made up their minds - Consideration is also high if the inertia to move from one product offering to another is high. (Usually so with retail banking) - It also usually means that consumers’ repertoire of brands is limited - to change habits marketers will have to give people new reasons to switch Need to trigger trial and retention … persuasion Advertising, In-store media and packaging to draw attention Distribution to ensure availability and visibility - Where consideration has strong bearing on equity we may find brands with high % of tenuous consumers. (Behavioural loyalty is high due to inertia or prior habits, yet emotional loyalty may be lacking) 90 Awareness reflects familiarity, interest and knowledge of brand … usually a prerequisite for consideration / trial Top of Mind Pantene Top of Mind Dove 12 Organics Vidal Sassoon 13 7 Spontaneous 73 Total 100 98 25 21 2 35 Total 35 8 Head & Shoulders Elseve Spontaneous 98 49 95 85 19 84 92 Attribute Importance: Relative importance of each attribute in driving equity obtained from factor weights and loading of the attributed on their factor Example: Personal Care Feel beautiful 0.37 Moisturizes effectively 0.36 Feel feminine 0.33 Healthy skin 0.32 With natural ingredients 0.32 Fashionable 0.30 Feel young 0.30 Nourishes skin 0.28 Reliable and trusted 0.27 Good value for money 0.27 Feel energetic and lively 0.23 Makes skin soft, smooth 0.20 Gentle on skin 0.18 Feel joyous 0.15 Refreshing 0.15 Lingering fragrance 0.14 Suitable for whole family Like fragrance Lot of lather Down to earth 0.12 0.09 0.07 0.06 93 Bank Profiles Strengths - Bank National: Service; El Dorado: Competiveness; Bank of Columbia: Efficiency Accessibility National Branch Close to Home / Office Convenient ATM locations Superior i‐Banking facilities -10 Efficient Teller counters -13 Efficiency Low Waiting time at ATM -11 Customer Hotline ‐ Low Hold Time -15 Good customer Service Service Good Customer Care Personalised Service -7 CompetencyKnowledge of Bank's Services of ManagerMarket Knowledge / Expertise -3 One Stop Bank Range of Service Wide Range of Credit Cards -6 Wide Range of Mortgage Packages Wide Variety of Insurance Plans -3 Good Range of Treasury Services -3 Wide Variety of Loans -7 Lowest Mortgage Interest Rates Competitiveness Best Loan Rates High Fixed Deposits Interest Rates High Return on Investment Products Attractive Loyalty / Rewards Program -1 15 Joka El Dorado 15 -8 -1 9 -11 20 -8 9 -19 22 -3 3 12 7 27 11 -15 -3 -4 4 4 18 3 20 -28 13 -17 -2 3 -1 -16 -6 1 15 16 7 1 34 17 -16 3 -3 -6 9 3 -1 5 0 -5 -4 -12 9 1 1 9 -18 6 -3 -9 1 6 0 3 7 7 4 -1 1 2 15 4 -14 2 7 -1 -8 -3 -1 5 8 -7 -7 0 9 -1 7 10 Columbia 8 -15 -25 2 Lena -17 -3 -18 4 6 -31 99 Example Personal Care Shopping: Image rating comparison across banners In Personal Care, Watsons maintains a strong lead on low prices, attractive promotions and VFM. Guardian leads on Health and Staff (advise). Unity not perceived as specialist … not even in health care Personal Care: Image Profile Analysis Relative Importance Most Least Staff provides good advice on health/pharmaceutical products Watsons Convenient to get to 100 Good range of healthcare products Guardian Is close to home Unity Healthcare Low prices 75 Clean and hygienic store Good value for money 50 Provides their own brands of health and beauty products which are a good alternative to the main brands Modern, comfortable store Efficient checkout counters So that comparisons can be made, the data in these spider charts Good range of cosmetics products is based on respondents who shop regularly at Well the presented outlet. display of products 25 0 Attractive and interesting promotions Staff provide good service Easy to find products Always have what I want in stock Better selection of high quality products Good range of skincare products Wide product range and variety Good range of hair care products Base = Respondents who shop regularly at the outlet 106 Performance = % top two boxes out of 5 scale Example Food and Grocery Shopping: Image rating profile analysis FairPrice leads other supermarkets on key attributes … but Cold Storage is ahead on the “extras” Food & Grocery: Image Profile Analysis Fair Price Relative Importance Most Shop N Save Cold Storage Least Convenient to get to 100 Good range of fresh products Is close to home High quality fresh food Good value for money 75 Ease of parking Easy to find products 50 Spacious Has own brands of groceries 25 Good quality instant cooked foods What course of action should 0 Cold Storage take? Efficient checkout counters Wide product range and variety Modern, comfortable store Clean and hygienic store Better selection of quality products Base = Respondents who shop regularly at the outlet Staff provide good service Low prices for most items Attractive and interesting promotions Everything I need in the one shop Always have what I want in stock Well presented display of products 107 Performance = % top two boxes out of 5 scale Brand Equity Model - Summary Drivers Outcomes Awareness Consideration Brand Loyalty Factor 1 Factor 2 Brand Equity Price Premium Factor 3 Factor 4 120 Modelling Brand Equity Brand Equity models deliver an understanding of - Interaction: How strong is the brand’s relationship with consumers? What’s the brand’s ability to retain its consumers along each stage of their decision making process - What is the brand’s equity? How does it compare with other brands How has it changed over time - What are the key drivers of brand equity? - How can we strengthen the brand’s equity? - How to strengthen the brand’s interaction with consumers? 121 123


© Copyright 2026