
Grade 6 Unit Patterns & Functions
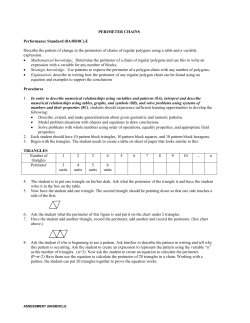
Patterns & Functions
Final Project – Summer 2008
Grade 6 Unit
Aaron Wall
Warren-Alvarado-Oslo School
[email protected]
Pam Bagaason
Clearbrook-Gonvick School
[email protected]
Stewart Wilson
Walker-Hackensack-Akeley School
[email protected]
1
Executive Summary
The 15-day unit that we have prepared is a Grade 6 Algebra unit. It addresses the following MN State
Standards:
Number and Operation:
Convert between equivalent representations of positive rational numbers.
6.1.1.7
For example: Express
10
7
as 77+ 3 = 77 + 73 = 1 73 .
Algebra:
Understand that a variable can be used to represent a quantity that can
change, often in relationship to another changing quantity. Use variables in
various contexts.
Recognize and
represent relationships
6.2.1.1
between varying
quantities; translate
For example: If a student earns $7 an hour in a job, the amount of money
from one
earned can be represented by a variable and is related to the number of hours
representation to
worked, which also can be represented by a variable.
another; use patterns,
tables, graphs and
Represent the relationship between two varying quantities with function
rules to solve realrules, graphs and tables; translate between any two of these representations.
world and
mathematical
6.2.1.2
problems.
For example: Describe the terms in the sequence of perfect squares
t = 1, 4, 9, 16, ... by using the rule
2
t = n2
for n = 1, 2, 3, 4, ....
Use properties of
arithmetic to generate
equivalent numerical
expressions and
evaluate expressions
involving positive
rational numbers.
Apply the associative, commutative and distributive properties and order of
operations to generate equivalent expressions and to solve problems
involving positive rational numbers.
6.2.2.1 For example:
32 × 5 = 32×5 = 2×16×5 = 16 × 2 × 5 = 16
15 6 15×6 3×5×3×2 9 2 5 9
.
Another example: Use the distributive law to write:
(
)
1 + 1 9 − 15 = 1 + 1 × 9 − 1 × 15 = 1 + 3 − 5 = 2 − 5 = 1 3
2 3 2 8
2 3 2 3 8 2 2 8
8
8
.
Represent real-world or mathematical situations using equations and
Understand and
inequalities involving variables and positive rational numbers.
interpret equations and
inequalities involving
6.2.3.1
variables and positive
rational numbers. Use
For example: The number of miles m in a k kilometer race is represented by
equations and
the equation m = 0.62 k.
inequalities to
Solve equations involving positive rational numbers using number sense,
represent real-world
properties of arithmetic and the idea of maintaining equality on both sides of
and mathematical
the equation. Interpret a solution in the original context and assess the
problems; use the idea
reasonableness of results.
of maintaining
6.2.3.2
equality to solve
equations. Interpret
solutions in the
For example: A cellular phone company charges $0.12 per minute. If the
original context.
bill was $11.40 in April, how many minutes were used?
MCA Connections: Questions from the MN Dept. Ed Sixth Grade Sampler – refer to sample problems at the end of the unit.
Our focus is to help students better understand Algebra through the use of models and manipulatives, to
connect their learning through the stages of concrete, representational, and abstract thinking where ultimately
they are able to explain “why” something is happening…and to help prepare the students for the MCA II
testing. ☺
Learning Opportunities:
1)
2)
3)
4)
5)
6)
Finding, creating and analyzing patterns
Creating tables and charts
Understanding functions
Creating linear graphs
Using Excel and graphing calculators(if available) to organize and graph data
Use manipulatives such as Algeblocks to investigate equations
3
Table of Contents
Day 1-2
Exploring and Describing Patterns
Day 3-4
Patterns and Expression
Day 5-6
Patterns and Tables
Day 7-8
Table and Chair Activity
Day 9-10
Introduction to Functions
Day 11-12
Functions and Equality
Day 13-14
Functions and Graphing Equations I
Day 15
Functions and Graphing Equations II
4
Day 1-2
Exploring and Describing Patterns
Lesson Objective: The students will learn to solve problems using patterns.
Materials: 2-3 patterned items (teacher)
Exploring houses worksheet (Navigating through Algebra Gr. 6-8) ©2001
Mini-Lab worksheet (Glencoe-Mathematics Applications and Connections-Course 1)© 2001
Patterns Worksheet
Launch: Bring in 2-3 items with different patterns and ask students to think of something that the items
have in common. (A: They all have patterns) (Ex. Checkerboard/quilt/striped shirt etc.)
Explore/Activity: Have students observe the classroom to find three patterns and draw them on their paper.
Ask for volunteers to share their finding on the over head and see if their classmates can guess what pattern it
is. Distribute worksheet (students draw next three patterns).
Share: Using manipulatives (shapes) have the students design two patters on their desk. Ask their partner to
recognize the next pattern. Continue, trading worksheets with partners. Ask for volunteers to share using
document camera/overhead.
Assign: “Exploring Houses” worksheets
Mini-Lab Activity
Summarize: Not only were we looking to see if students could recognize patterns, but that they could
analyze them. The next step is to recognize numerical and shape patterns, and describe it using a table/chart.
5
Day One Mini-Lab
A “staircase: that is 4 cubes high is shown at the right. Notice that 10 cubes are needed to build the staircase.
TRY THIS:
1. Copy the chart below. Then use centimeter cubes to find the number of cubes needed to build each staircase.
Height of Staircase
1
Number of Cubes
Needed
1
2
3
4
10
6
5
6
7
7
Day 3-4
Patterns and Expressions
Lesson Objective/Standard: Students will learn to use tables and record data while exploring patterns, and
understand that tables can help represent patterns using symbols.
Materials: -“I Spy Patterns” Worksheet (Navigating through Algebra Grades 3-5, pg 82) ©2001
- ©Algeblocks
- Centimeter Graph Paper
-Tables Worksheet
- Document Camera
Launch: Display “I Spy Patterns”. Show diamond pattern on overhead and discuss one pattern recognized.
Describe numerical pattern. Distribute worksheet to let students explore other design patterns. Label
number of diamonds in each row/design to introduce numerical patterns.
Explore/Activity: Introduce
symbol growth, analyze, and record in a
table. Have each student design a letter shape on their desktop using Algeblocks or other manipulatives.
Distribute centimeter graph paper and let students draw a letter design. Have them increase the letter design
and record on table. Trade papers with three other students to analyze and record results on their tables.
Share: Ask for volunteers to come up to document camera and share results of different letters as well as
make predictions for what the sixth stage of growth for their letter would be without drawing or use of
manipulatives.
Summarize: This is the perfect place to discuss the “first difference” column and add vocabulary words
“term”, “conjecture”, and “sequence”. Without realizing it, students are recognizing algebraic patterns and
learning recursive formulas! We also think it is important that students see tables in both horizontal and
vertical format.
8
Patterns
Complete the next three patterns in the sequence.
9
Tables
Mass (kg)
0
1
2
3
4
5
Length of Spring (cm)
5
9
13
17
21
25
6
7
8
9
Rule: _______________________________________
Mass (kg)
Length (cm)
0
4
1
7
2
10
3
4
5
Rule: _______________________________________
Weight in pounds
Shipping cost in dollars
1
4.00
2
5.50
3
7.00
4
5
Rule: _______________________________________
Solve with a table.
1. In some states people are refunded 5 cents for every bottle or can returned for recycling. Fill in the table to show
the relationship between the number of bottles returned and the amount refunded. Suppose you were given 7 cents
for each can returned. Create a graph and a rule for this situation.
# of bottles
1
2
3
4
5
6
Amount Refunded
$0.05
$0.10
Rule: ________________________________________
10
Tables
1
2
Rule: ____________________________
1
2
Rule: ____________________________
1
2
Rule: ____________________________
1
2
Rule: ____________________________
1
2
Rule: ____________________________
11
1
2
Rule: ____________________________
1
2
Rule: ____________________________
1
2
Rule: ____________________________
1
2
Rule: ____________________________
12
13
14
DAY 5-6
Patterns and Tables
Lesson Objective: Students will learn to transfer pictoral patterns to numerical tables and charts analyzing
the first difference. Also they will begin to see functions and rules.
Materials: - Dot Pattern worksheet (Glencoe-Applications and Connections- Course 1) ©2001
- Table and Chair worksheet (Teaching Mathematics, May 2008)
Launch: Display a triangular dot pattern on the board. Allow students time to analyze any patterns or
relationships. Together, record data on table and discuss first common difference
Explore/Activities: Pass out dot pattern worksheet and allow students to explore more dot patterns.
Challenge students to create their own dot pattern and exchange with a classmate.
Introduce “Table and Chair” activity chart/table to recognize “1st common difference”. Ask if anyone
recognizes a rule….? (Introduction to functions)
Share: As a group, review previous tables and discuss first common difference, second(if any)… eventually
identifying a rule to find “any” difference. Students will create charts representing the relationship between
a function table and a drawing.
Summarize: Students will be exposed to the algebraic terminology “function” and are now ready to be
introduced to the “function machine” and begin to analyze the “rules”.
15
16
Day 7-8
Table and Chair Activity
Students investigate properties of perimeter, area, and volume related to various geometric two- and threedimensions shapes. They conjecture, test, discuss, verbalize, and generalize patterns. Through this process
they discover the salient features of the pattern, construct understandings of concepts and relationships,
develop a language to talk about the pattern, integrate, and discriminate between the pattern and other
patterns. When relationships between quantities in a pattern are studied, knowledge about important
mathematical relationships and functions emerges.
Source: Illuminations, 2008 NCTM
Students will:
•
•
compute perimeter, area, and volume of various geometric figures
compute maximum and minimum area of geometric figures, given linear dimensions restrictions
Material needed:
Square tiles
A piece of grid paper for each student
Tables at a Birthday Party Activity Sheet
Investigation: Perimeter and Area
LAUNCH
Pose the following problem to the students:
Tanya Teen started her own summer business - putting on birthday parties for small children. Her neighbors agreed to
loan her square card tables to seat the children for refreshments. However, when some of the neighbors were away on
vacation, Tanya couldn't use their tables, and she really hated hauling the tables back and forth. Therefore, using as
few tables as possible was important to her. Because all the children wanted to sit together, she had to place the card
tables together into rectangles. Only one child could sit on each side of a card table. Her first party had eighteen
children. How many tables did Tanya need to borrow?
Students may use tiles to display a 1 × 2 banquet table on the overhead projector.
Ask, How many people can be seated? [6]
Alternatively, the problem can be posed as, What is the area of a rectangle with a perimeter of 18 units?
17
EXPLORE
Allow small groups of students to explore the problem with the square tiles.
Ask, Which rectangles used the fewest square tiles? [1 × 9 or 9 × 1]
The most square tiles? [4 × 5 or 5 × 4]
How many tables did Tanya need?
The language of tables and people sitting at tables is an appropriate story to link the world of students to the
world of mathematics. In this example, tables represent area, and people sitting at tables represent perimeter.
Translate the language of unit tables and people into area and perimeter. In describing the dimensions of a
rectangle, use bottom and side edge in place of length and width. This allows students to include rectangles
4 × 5 and 5 × 4 as different rectangles. Later the terms width and length can be introduced. Arrange all the
rectangles with a perimeter of 18 in a table, such as the one shown below.
Length (units) Width (units) Perimeter (units) Area (square units)
1
8
18
8
2
7
18
14
3
6
18
18
4
5
18
20
5
4
18
20
6
3
18
18
7
2
18
14
8
1
18
8
A blank table is found on the Tables at a Birthday Party activity sheet.
18
SHARE
Ask the students to observe patterns in the chart. As the length increases, the width decreases, and as the
length increases, the area increases to a certain point and then starts to decrease. The later pattern is a verbal
description of the graph called a parabola, as shown below. This question builds an understanding of the
effect of changing one variable, say length, on another variable, such as width or area.
If we allow lengths to be real numbers, is there a rectangle with a perimeter of 18 that has a larger area?
Students will usually try a rectangle with a side of length 4.5 units. The area is 20.25 square units. Trying
sides with lengths larger and smaller than 4.5, say 4.4 or 4.6 or 4.55, will yield areas that are smaller than
20.25. The shape of the rectangle with largest area for a perimeter of 18 is the square rectangle that is closest
in shape to a square, 4 × 5 (if we restrict our lengths to whole numbers).
Several graphs can be drawn to represent the data in the table above. The graph of the area versus the length
(or width) is a parabola, which is the graph of a quadratic function.
Area vs. Length
19
The graph of the length versus the width is a linear graph.
Length vs. Width
Using the graph of the parabola, ask students, What happens between the points (4, 5) and (5, 4)?
This is where the maximum point will occur if we extend our dimensions to include real numbers.
Ask, What are the dimensions of the rectangle whose area is 16 square units? [6.5 × 2.5]
What is the area of the rectangle whose length is 5.5 units? [19.25]
The graph visually describes the effects of increasing the length on the area.
Can a length be 9? [No, because the width would then be 0.]
Ask, What happens if the graph is allowed to cross the horizontal axis?
Investigation: Predicting the Maximum Area
Have students predict which rectangle has the maximum area for a fixed perimeter.
Discussion. Ask the class to predict when the area seems to "turn around." It reaches its maximum area when
the shape of the rectangle is as close to a square as possible. If we have real numbers, then the rectangle with
largest (maximum) area is a square. Try out this conjecture with perimeters of 20 units and 24 units. Have
students guess when the area turns around and then find all the rectangles with integer lengths that have the
given perimeter.
For a perimeter of 20 units, students may need to list all pairs of whole numbers whose sum is 20/2, or 10,
and note that the pair (5,5) is the turn around. Thus the square with sides of length 5 and area of 25 is the
rectangle with the largest area for a fixed perimeter of 20 units.
20
For a perimeter of 24 units, the rectangle with the largest area is also a square, with sides of length 6 units
and area of 36 square units.
For a perimeter of 34, which rectangle has the maximum area? If the dimensions are whole numbers, then
the rectangle with dimensions 8 × 9 has the maximum area. If the dimensions are real numbers, then the
square whose sides have length 8.5 has the maximum area.
Investigation: Generalizing the Process for Finding the Maximum Area
Have students generalize the pattern for finding the area of a rectangle given a fixed perimeter.
Discussion. Ask the students to describe how they found all the rectangles. Allow the students time to talk
about the process and then to translate the process into symbols. Find all pairs of whole numbers whose sum
is half the perimeter. Use these pairs of numbers as the lengths and widths of the rectangles and then
compute the areas. Or find the pair of numbers that are almost equal; this rectangle has the maximum area.
For real numbers, since we know that the rectangle with the maximum area for a fixed perimeter is a square,
use the number that is one-fourth the perimeter for the length of the side of the square. The following sets of
equations could also be used:
Basic Equations
2(length + width) = Perimeter, or
length + width = Perimeter ÷ 2
length × width = area
Advanced Equations
21
Looking toward Algebra: The equation that describes the area of a rectangle with fixed perimeter is a
quadratic equation, which is studied in more detail in algebra. Quadratic equations always have the shape of
a parabola (as shown previously), except some open down and have a maximum point and some open up and
have a minimum point. The maximum or minimum pint can also be found algebraically.
Have students observe the symmetry of the parabola and how this relates to the pairs of rectangles; for
example, the rectangles 4 × 5 and 5 × 4 have the same area. They lie on the same horizontal line. The
perpendicular line drawn from the maximum point to the horizontal axis is the line of symmetry. This
problem provides intuition and understanding for some very important concepts of algebra and calculus.
Maximum and minimum points of more general functions are studied in calculus. Geometrically, the
maximum or minimum points occur when the tangent line to the graph is a horizontal line or has slope zero.
As the students generalize the patterns they have observed and discussed, they are "sneaking" up on the
notion of variable in a very natural way.
Investigation: Factor Pairs
Have students find all the factor pairs for 36.
Discussion. Ask students to describe all the rectangles that have an area of 36. Let them use square tiles or
grid paper. Some students will recognize that this task is equivalent to finding all the factor pairs of 36. To
find the rectangle with the least perimeter, students need to find the rectangle with a shape closest to a square
or the factor pair where the factor pairs begin to repeat. For 36, these are the factor pairs:
1 × 36
2 × 18
3 × 12
4×9
6×6
9×4
12 × 3
18 × 2
36 × 1
The factor pairs repeat after the pair of factors (6, 6). The factors in this pair are equal, thus 36 is a square.
Let students explore an area of 12, 28, or 64.
Ask them to conjecture about when the factor pairs will begin to repeat.
Ask, If you were going to find all the factor pairs of a number, how many numbers would you have to check?
22
[1 through the number that when squared is closest to the number; for 12 it is 3; for 28 it is 4; for 64 it is 8.]
Ask students if they can predict which numbers are perfect squares (square of a whole number). The number
is a square number if it has a factor pair with both factors equal or with an odd number of factors.
Assessment options:
1. To evaluate students' understanding of the concept of "maximum area," the teacher can ask them to write about
the process of dinging the rectangles with a greatest area, given a fixed perimeter. This question asks the
students to reflect on the class exploration and discussion and helps the student (and teacher) assess the level
of understanding.
2. Find the perimeter of all rectangles with whole-number dimensions whose area is 72 square units.
Make a table and graph your data. Use the table or graph to answer the following questions:
Which rectangle has the least perimeter? The greatest perimeter?
If we allow the dimensions to be rational numbers (fractions), which rectangle has the least perimeter? The
greatest perimeter?
NCTM Standards:
Algebra 6-8
1. Use symbolic algebra to represent situations and to solve problems, especially those that involve linear
relationships.
2. Identify functions as linear or nonlinear and contrast their properties from tables, graphs, or equations.
3. Model and solve contextualized problems using various representations, such as graphs, tables, and equations.
Geometry 6-8
1. Create and critique inductive and deductive arguments concerning geometric ideas and relationships, such as
congruence, similarity, and the Pythagorean relationship.
Number & Operations 6-8
1. Understand the meaning and effects of arithmetic operations with fractions, decimals, and integers.
Phillips, Elizabeth, et al. Patterns and Functions, 1, 41 - 46. Reston, VA: NCTM, 1991.
23
Name______________________
Tables at a Birthday Party Activity Sheet
Work with your group to solve the following problem. You may use square tiles or grid paper to help you.
Tanya Teen started her own summer business – putting on birthday parties for small children. Her neighbors
agreed to loan her square card tables to seat the children for refreshments. However, when some of the neighbors were
away on vacation, Tanya couldn’t use their tables, and she really hated hauling the tables back and forth. Therefore,
using as few tables as possible was important to her. Because all the children wanted to sit together, she had to place
the card tables together into rectangles. Only one child could sit on each side of a card table.
Her first party had eighteen children. How many tables did Tanya need to borrow.
Record all of the arrangements in the table below:
Length (Units)
Width (Units)
Perimeter (Units)
24
Area (Square Units)
Day 9-10
Introduction to Functions
Lesson Objective: Students will use tables to record and describe patterns with expressions. Then, they use
expressions to extend their tables.
Materials: Input/Output worksheet
Launch: A good analogy for “function machine” (rule) would be to make a pitcher of Kool-aid as a
demonstration. By just adding water to the pitcher, stirring it up, and pouring it out, students can see that a
change has occurred. The same concept can be applied to numbers. If a number is added to a “machine” and
an operation is performed a new number will be produced.
Explore/Activity: Draw a “function machine” (see below) on the board, and starting with the number one
input that number into the left side of the machine and a two on the right side. Continue with this doubling
pattern (1,2) (2,4) (3,6) etc.
Share: Hand out Input/Output worksheet. Have students work along with teacher at the board, introducing
“input” and “output” vocabulary using function tables. Complete the first table together but challenge
students giving them less information for each table.
Input
Output
Input
Output
Input
Output
Input
Output
Summarize: Students have now been exposed to the algebraic vocabulary “input”, “output”, and
“functions”. Following these exercises students have become aware that when applying different rules or
operations to numbers the outcome changes. They are beginning to think of their own rules and are now
ready to apply them to tables, graphs and constructed response questions.
25
Input
Output
Input
Output
Input
Output
Input
Output
Input
Output
Input
Output
Input
Input
Input
Input
26
Output
Output
Output
Output
Day 11-12
Functions and Equality
Lesson Objective: Students will review the concept of equality and be able to describe (verbally and
symbolically) and make a connection with the “rule” or function of the pattern with the numbers.
Materials: Input/Output worksheet
Graph worksheet
Classroom computer and projector
Computer lab
Website: www.nlvm.usu.edu/
Launch: Introduce the www.nlvm.usu.edu/ website under algebra grades 6-8 using the balance scale
activity and function machine activity with classroom computer and projector.
Explore/Activity: Take students to the computer lab. Using their “input/output” worksheets have them
record results of the function machine activities.
Share: Bring “input/output” worksheet back to classroom and discuss how to record data on graph paper.
In doing so, we will analyze rules that occurred in the computer lab. These graphs will be constructed as an
in class activity setting up for tomorrow’s lesson.
Summarize: Students should have a good sense of what the “1st difference” is and be able to recognize it
quickly. This activity has helped them to understand the rule, or “function” that occurred within each input
and output. They are now prepared to use variables and begin graphing equations.
27
Input
Output
Input
Output
Input
Output
Input
Output
Input
Output
Input
Output
Input
Input
Input
Input
28
Output
Output
Output
Output
29
Day 13-14
Functions and Graphing Equations
Lesson Objective: Students will take yesterday’s input/output tables and begin transferring data to create
linear graphs.
Materials:
Graph Paper
Computer and projector
Launch:
Review a function machine activity, create a table, and as a group create a graph.
Explore:
Review yesterday’s function machine activity and have students create multiple linear graphs.
Share: Have students share their individual work using the document camera or overhead and discuss the
similarities between the various graphs.
Summarize: By now, the students should be quite familiar with the four points of algebra: patterns,
functions, tables, and graphs. It’s a perfect lead-in to introducing equations with emphasis on different
variables using a variety of operations.
Day 15
Functions and Graphing II
Lesson Objective: Use tables from previous lessons the students will create graphs with their information
Materials: Graph/ worksheets from previous lessons
Classroom computer and projector
Computer lab access
Launch: Show examples of how tables can be graphed using ©Microsoft Excel spreadsheet.
Explore/Activity: Take students to computer lab to graph their equations using ©Microsoft Excel. Begin
doing a few as a class then allow students to use what they have learned to explore on their own.
Share: After returning from the computer lab, allow students to show some of the graphs that they have
created.
Summarize: Following this lesson students will have an understanding of how graphs are applied in the real
world.
30
MCA II Sample Questions:
Type of Food
Lettuce
Potatoes
Burger Patties
Delivered
Every 3 days
Every 6 days
Every 15 days
The Burger Hut receives regular deliveries of food. All the types of food listed in the table were delivered
today. In how many days will the Burger Hut receive another delivery of all 3 items on the same day?
A. 15
B. 30
C. 45
D. 60
Please write your response to question 20 on page 3 of your answer book.
Juice boxes are packaged two different ways.
• A package of 24 boxes costs $12.98.
• A package of 4 boxes costs $2.59.
You need 56 juice boxes.
Part A Find 2 different possible ways you could purchase the 56 juice boxes and the total cost for each way.
Show or explain your work.
Part B Using your answer in part A, what is the price per juice box if you purchase the lower priced
combination? Show or explain your work.
31


© Copyright 2026