
Economic Analysis of the Rubber Tire Manufacturing MACT Final Report
Economic Analysis of the
Rubber Tire Manufacturing MACT
Final Report
Prepared for
Lillian G. Bradley
U.S. Environmental Protection Agency
Office of Air Quality Planning and Standards
Innovative Strategies and Economics Group (ISEG)
(MD-15)
Research Triangle Park, NC 27711
Prepared by
Subhrendu K. Pattanayak
Brooks M. Depro
Tayler H. Bingham
Research Triangle Institute
Center for Economics Research
Research Triangle Park, NC 27709
with input from Abt Associates
EPA Contract Number 68-D-99-024
RTI Project Number 7647-001-010
August 2000
EPA Contract Number 68-D-99-024
RTI Project Number 7647-001-010
Economic Analysis of the
Rubber Tire Manufacturing MACT
Final Report
August 2000
Prepared for
Lillian G. Bradley
U.S. Environmental Protection Agency
Office of Air Quality Planning and Standards
Innovative Strategies and Economics Group (ISEG)
(MD-15)
Research Triangle Park, NC 27711
Prepared by
Subhrendu K. Pattanayak
Brooks M. Depro
Tayler H. Bingham
Research Triangle Institute
Center for Economics Research
Research Triangle Park, NC 27709
with input from Abt Associates
This report contains portions of the economic impact analysis report that are related to the
industry profile.
SECTION 2
INDUSTRY PROFILE1
2.1
Background
The rubber tire manufacturing industry is the subject of a New Source Performance
Standard (NSPS) published in 40 CFR Part 60 Subpart BBB, and promulgated on September
15, 1987. EPA is in the process of developing a regulation that would establish limits on the
HAPs emitted from the rubber tire manufacturing process. These emission limits reflect the
MACT. This section presents an industry profile developed to support an EIA for the rubber
tire manufacturing industry MACT rule.
Industry profiles provide a general understanding of the affected industry and a basis
for the EIA. This profile contains information, gathered from various sources, on key
characteristics that are crucial to understanding the rubber tire manufacturing industry. This
section describes the source category, environmental concerns associated with the
manufacturing process, and the industry’s current situation.
Section 2.2 focuses on the producers of rubber tires, the production process for rubber
tires, and the costs associated with rubber tire production. Section 2.3 describes consumers
of rubber tires and the product characteristics they value. Section 2.4 presents the
organization of the industry by using information both at the industry and facility levels.
Section 2.4 also contains information on the specific facilities identified in the presumptive
maximum control technology (P-MACT) document. The market for rubber tires is described
in Section 2.5. This section includes information on market volumes and prices, production
and consumption, international trade, and future projections for the industry.
2.1.1 Category Description
The rubber tire manufacturing source category includes any rubber tire
manufacturing facility, or any facility that manufactures rubber tire components directly
associated with rubber tire production, that is a major source or is located at a major source
1
This industry profile was prepared by Abt Associates in April 1999.
2-4
facility site. The tires can be solid or pneumatic (filled with air) and made with natural or
synthetic rubber. Component facilities can include facilities that produce rubber compound
that is used in making rubber tires at another manufacturing facility. A major source is
defined as any stationary source or group of stationary sources located within a contiguous
area and under common control that emits or has the potential to emit, considering controls,
in the aggregate, 10 tons per year of any HAP or 25 tons per year of any combination of
HAPs. The primary product of the industry is rubber tires of any size or shape.
The primary Standard Industrial Classification (SIC) code associated with the rubber
tire manufacturing industry is 3011. This category includes establishments primarily
engaged in manufacturing: pneumatic casings, inner tubes, and solid and cushion tires for all
types of vehicles, airplanes, farm equipment, and children’s vehicles; tiring; camelback; and
tire repair and retreading materials. Establishments primarily engaged in retreading tire
services are classified in a different industry. The MACT rule is currently focused on tire
manufacturing facilities. As a result, much of the information from this profile reflects this
focus. Some data are presented for the entire 3011 SIC category, and other data deal
specifically with tire manufacturing facilities, particularly those facilities identified in the
draft P-MACT. The coverage of different data sources is noted throughout the profile.
Facilities manufacturing three components of tires are also potentially affected by the
MACT regulation. These facilities produce tire cord, inner tubes, and retreading materials.
Tire manufacturing companies might have their own tire cord or inner tube manufacturing
facilities or may purchase cord or tubes from another company that makes only tire cord or
inner tubes. It is estimated that approximately 90 percent of tire cord produced is from
facilities owned by tire manufacturing companies (EPA, 1998). EPA has not yet determined
whether tire cord or inner tube manufacturing are significant sources of HAPs.
Retread facilities are believed to operate in much the same way as tire manufacturing
facilities and are believed to be major sources of HAPs. There are two types of retread
facilities: those that make only tread and those that put the tread around a re-ground tire
carcass. The facilities that put tread around a re-ground tire carcass are smaller facilities.
The Rubber Manufacturers Association (RMA) believes that these facilities are not likely to
be major sources (EPA, 1998).
2.1.2
Environmental Concerns
In any type of rubber product manufacturing (including tires), the primary
environmental concerns are fugitive air emissions, solid wastes, wastewater, and hazardous
2-5
wastes. Fugitive air emissions can be released from the compounding areas, where dry
chemicals are weighed and put into containers prior to mixing. Most facilities have
eliminated this problem, however, by purchasing their chemicals in small, pre-weighed,
sealed polyethylene bags. Emissions are also generated from the rubber compounds
themselves and from solvents that are added for cement, inks, and lubrication (EPA, 1995).
Several other environmental concerns are also associated with rubber product
manufacturing facilities. Solid waste is generated from the mixing, milling, calendering, and
extruding processes. Most of this solid waste is recycled or sold to companies who use the
rubber for some other type of product. Waste water is generated from the cooling, heating,
vulcanizing, and cleaning operations (EPA, 1995).
Two kinds of HAP emissions from rubber product manufacturing are the subject of
the MACT standard: particulate matter hazardous air pollutants (PMHAPs) and volatile
organic hazardous air pollutants (VOHAPs). PMHAPS result mainly from the production
processes of mixing, milling, and grinding. VOHAPs are emitted when the mixing and
milling of rubber compounds generate heat, when solvents and cementing liquids are
incorporated on components for tire building, and when solvents are used in lubricating the
uncured (green) tire (EPA, 1998).
2.1.3
Current Industry Status
The mid- to late 1980s were difficult times for the world tire industry. Tire
manufacturers faced declining demand for new cars, declining tire prices, a record high U.S.
currency, and record high tire imports. As a response to this market distress, the industry
went through a period of significant restructuring and consolidation. Foreign firms bought
out several American firms, leaving the world tire industry with nine ultimate parent
companies that have annual sales in excess of $1 billion each. These nine companies account
for 80 percent of world tire sales (Ita and Gross, 1995). Four of the nine companies have
their headquarters in Japan (Bridgestone Corporation, Sumitomo Rubber Industries Ltd.,
Yokohama Rubber Co. Ltd., and Toyo Tire and Rubber Co. Ltd.), three are based in Europe
(Groupe Michelin, Continental A.G., and Pirelli), and two are headquartered in the United
States (Goodyear and Cooper).
Despite the extensive merger and consolidation activity triggered by the difficult
market conditions in the late 1980s, the industry continued to experience economic pressures
into the 1990s. In the mid-1990s, raw material prices were increasing, plants were closing,
and companies were competing in price wars. In more recent years, some of the economic
2-6
pressures on domestic producers have declined. While labor relations remain a problem for
the industry, sales and profitability are improving in both North America and Western
Europe. Tire companies are striving to control costs without raising prices by increasing
output per man-hour worked. This trend, coupled with a decline in tire industry real wages
of 0.7 percent in the last decade (Walters, 1995), prompted strikes at several plants. The
labor unrest can be seen in the strike of the Continental General Tire plant in Charlotte, NC,
in November 1998 and the strike at Titan Tire in Des Moines, IA (Rubberworld, 1999; Titan
International, 1999).
2.2
The Supply Side
The process of manufacturing rubber tires is complex and capital intensive. As a
result, facilities that produce rubber tires tend to be specialized and produce only tires.
Facilities generally specialize both by the tire product (e.g., passenger car, light truck) and
the type of tire (bias or radial) produced. This section describes the process used by tire
manufacturers to produce tires and the costs associated with this production process. Also
described are the products, by-products, and co-products produced by rubber tire
manufacturers.
2.2.1
Production Process2
The rubber tire manufacturing process consists of 11 steps:
1. Mixing involves weighing and combining various ingredients (natural and
synthetic rubbers, oil, carbon black, zinc oxide, sulfur, and other chemicals) to
create a homogenous rubber compound that is discharged to a drop mill.
2. Milling creates warm malleable sheets that are cooled and coated with an “antitack solution.” These sheets are then fed into an extruder.
3. Extruding forces the rubber compound through a shaped slot called a die that
forms the compound into various shapes.
4. Calendering involves coating fibers of cloth or steel with a rubber compound,
and then curing it in an irradiation oven that bevel cuts it to a desired length,
width, and angle.
5. Bead making involves the creation of beads that provide a proper seal between
the tire and the wheel rim when a tire is mounted on the rim and inflated. In the
2
The description here relies heavily on the production process presented in the P-MACT.
2-7
bead building process, bundles of wire are passed through an extrusion die where
a coat of rubber is added, and the wires are then wound into a hoop.
6. Cementing and marking processes are used at various stages throughout the tire
building process. Cements (adhesives or solvents) are added to improve the
adhesion of different components to each other throughout the process. Cement
usage can vary significantly among facilities depending on the type of tire being
manufactured and the process being used. Marking inks are used to aid in
identifying the components being managed. Typically they are applied to
extruded tread stocks to aid in identifying and handling cured tires. Marking
practices can also vary significantly among facilities.
7. The various tire components go through cooling and culture prior to tire
building. From the milling and extruding operations, the rubber sheets are placed
onto long conveyor belts that, through the application of cool air or cool water,
lowers their temperature.
8. The two main components of the tire-building process are the tire carcass buildup drum and the tread application drum. These drum machines assemble the cut
carcass plies and belts plus the extruded tread, sidewall, and beads into tires. The
process begins with the application of a thin layer of rubber compound, the inner
liner, to the innermost carcass ply. The carcass plies are placed on the drum one
at a time, after which the beads are set in place and the plies (reinforcing layers of
cord and rubber) are turned up around them. At this stage the belts and tread
rubber are added.
9. Lubricating involves preparing the uncured (green) tire for curing. The green
tire may be coated with a lubricant (green tire spray). The function of the green
tire spray is to ensure the cured tire does not stick to the curing mold during
extraction of the tire after curing.
10. Curing involves collapsing the drum and loading the green tire into an automatic
tire press to be cured (vulcanized) at high temperature and pressure. The
vulcanization process converts the rubber and also bonds the various parts of the
tire into a singular unit.
11. Tire finishing may involve some of the following processes: trimming, white
sidewall grinding, buffing, balancing, blemish painting, whitewall/raised letter
protectant painting, and quality control inspections. Some facilities also apply a
puncture sealant during production.
2-8
2.2.2
Major By-products and Co-products
There are generally no by-products or co-products associated with rubber tire
manufacturing. The Census of Manufactures calculates a primary products specialization
ratio on an industry-wide basis. For SIC 3011, this ratio is 98, which represents a highly
specialized industry at the manufacturing level. The primary products specialization ratio is
the primary products’ value of shipments divided by the sum of the primary products’ value
of shipments plus secondary products’ value of shipments (U.S. Department of Commerce,
1992).
A 1996 survey of tire manufacturing facilities conducted by the RMA asked
respondents to identify what type of tires they produce and what percentage of their
production is accounted for by tire production. Most facilities surveyed responded that they
only produce tires. A few facilities listed a percentage of their production as “Other.”
However, the percentage was so small that it is of no economic significance.
2.2.3
Types of Products and Services
Tires are distinguished by end use, type of construction, and performance
characteristics (EPA, 1998). Tires are produced for
&
passenger cars;
&
light, medium, and heavy duty trucks;
&
cycles/motorcycles;
&
go-carts;
&
racing cars;
&
industrial rolling stock;
&
buses;
&
off-the-road and all-terrain vehicles;
&
aircraft;
&
graders/earthmovers/loaders;
&
mining/logging equipment;
&
high performance or speed-rated tires for passenger cars; and
2-9
&
agricultural and forestry equipment.
There are also different types of tire construction. Bias-ply constructed tires use plies
that run diagonally from one bead to the other. One ply is set on a bias in one direction, and
succeeding plies are set alternately in opposing directions crossing each other. Radial
constructed tires use plies that run radially from bead to bead under the tread. This
construction requires a belt to stabilize the tread and define the tire diameter
(dunloptire.com). Radial tire construction and tread design permit more tread contact with
the road surface during hard cornering for a safer ride and also provide less forward rolling
resistance, thereby improving fuel economy. Most tire production in the United States is
now of radial-ply construction: virtually all car tires (with the exception of the temporary
spare) and more than 80 percent of truck and bus tires are of radial-ply construction. More
than 90 percent of tractor and farm implement tires as well as automobile temporary spares
are of bias-ply construction. Section 2.5 contains an in-depth description of the U.S. tire
market.
2.2.4 Costs of Production
Table 2-1 presents 1996 annual production cost information from the Annual Survey
of Manufactures for all establishments in SIC 3011 (U.S. Department of Commerce, 1996).
The table breaks down the costs of production into capital expenditures, raw material costs,
labor costs, electricity costs, and fuel costs. The cost of production combining all of these
inputs totals approximately $10.1 billion, which is 71 percent of the value of shipments for
1996. The largest input to the cost of production is raw materials, as shown in Table 2-1.
Table 2-2 lists the raw materials.
There are certain input substitutions for the production process available to tire
manufacturing. The clearest input substitution is to use synthetic rubber instead of natural
rubber. Many manufacturers now use synthetic rubber in addition to natural rubber.
Synthetic rubber has not completely replaced natural rubber, however, because natural
2-10
Table 2-1. Annual Production Costs, 1996
Category
Costs of Production
($103)
Capital expenditures
Percentage of Total
Production Cost
Percentage of Value of
Shipments
578,500
5.7
4.1
Raw material costs
7,091,400
70.3
49.9
Labor costs
2,140,400
21.2
15.1
191,300
1.9
1.3
86,000
0.9
0.6
Electricity costs
Fuel costs
Total
$10,087,600
100
71
Source: U.S. Department of Commerce. 1985-1996. Annual Survey of Manufactures, Statistics for Industry
Groups and Industries. Tables 2 and 4. Washington, DC: Government Printing Office.
Table 2-2. Raw Material Consumed By Kinda
Latex and dry natural rubber
Reclaimed rubber
Inorganic pigments
Rubber compounds and mixtures purchased
Plastic resins consumed in the form of
granules, pellets, powders, liquids, etc.
All other fabricated rubber products
Synthetic rubber
Nylon, polyester, and metallic tire cord
Rubber processing chemicals
Polyester tire cord
Plasticizers
Fabricated metal products
Carbon Black
Castings
Other chemical and allied products
Forgings
Steel wire
Paper and paperboard containers
Nonferrous shapes and forms
a
Data on value of materials consumed not available in consistent reporting terms.
Source: U.S. Department of Commerce. 1992. Census of Manufactures—Rubber Products: Industry Series.
Table 7. Washington, DC: Government Printing Office.
rubber is a necessary input in the production of radial tires (RMA, 1997). Whether to use
cement and how much to use is another substitution possibility. The cement can be
2-11
reformulated or eliminated altogether, reducing or eliminating the HAPs associated with its
use (EPA, 1998).
2.3
The Demand Side
This section describes the characteristics of tires, the major uses and consumers of
tires, and the substitution possibilities that exist for tires. This information supports analysis
of the demand for tires in the economic analysis.
2.3.1
Product Characteristics
In 1975, tire demand began to switch significantly from bias-ply tires to radial tires.
This switch is now almost complete in the passenger tire market and nearing completion in
the light truck market. Nearly all passenger car tires and more than 80 percent of highway
truck tires are radials. Radial tires have a longer life than bias-ply tires, and the switch to
radials has been a factor in reducing growth in domestic demand for replacement tires.
Using industry standards, tire performance is rated on qualities such as speed, tread
wear, traction, and temperature grade. For tires within the same category that have similar
ratings, there is little product differentiation between tire producers; thus, price is the main
distinguishing characteristic for consumers of tires within the same category of tires.
There has been continuing improvement in tire technology and tire performance over
time. Tread longevity, reduced rolling resistance, improved handling, durability, and safety
are key characteristics consumers value in tires. Typical warranties on tires have increased
to 80,000 miles from 20,000 miles just a few decades ago. The newest attribute that attracts
customers is the run-flat tire. This type of tire can continue to operate safely with a flat for
up to 200 miles. Most manufacturers have already introduced this product line. Goodyear
and Michelin lead the development and Continental is set to launch its line soon.
2.3.2
Uses and Consumers
There are two distinct markets for tires: the original equipment market and the
replacement tire market. Original equipment (OE) tires are the tires that come as equipment
on a new vehicle. The initial purchasers of OE tires are vehicle manufacturers. Replacement
tires are sold to vehicle owners through tire dealerships, chain stores, service stations,
department stores, and warehouse and discount clubs. The tires sold in the two markets are
generally the same.
2-12
Brand loyalty is exhibited by car owners who often replace tires on their cars with the
same brand as originally installed. As a result, tire manufacturers strive to obtain original
equipment contracts. Original equipment contracts are also attractive to tire companies
because they save on distribution expenses and advertising costs (Standard & Poor’s, 1998).
The two separate markets, original equipment and replacement tire, are expected to
have somewhat distinct demand functions.3 Estimated demand functions for tires have not
been identified. Generally, it is expected that both markets have inelastic demand functions
overall. For example, every new car and light truck require four tires and a spare tire, and
there are no substitutes for this standard equipment. Tires also make up an insignificant
portion of the cost of a new automobile or light truck. Market volumes for original
equipment tires are closely tied to the demand for new automobiles and light trucks, and the
demand for new automobiles tends to follow the general economic cycle of the United
States. For these reasons, the overall demand for tires is expected to be relatively inelastic
with respect to price. The new run-flat tires could eventually eliminate temporary spare
tires, a component of the original equipment market.
The overall market demand for replacement tires is also relatively inelastic, because
tire replacement is not an option that can be deferred for long, particularly when a tire is
damaged. Further, the cost of replacement tires makes up a small percentage of the operating
cost of a car. Market volumes for replacement tires are closely related to tread wear and
vehicle miles driven. Technological improvements in durability and life have decreased the
overall rate at which replacement tires are being purchased.
While we expect inelastic demand for tires at the market level, individual producers’
ability to raise prices without losing market share is limited by competition among tires with
similar characteristics. Some flexibility in pricing may be allowed by brand loyalty, but
producers are not likely to be able to deviate much from the competitive price without losing
sales. Section 2.5 presents detailed information on market volumes for the different types of
tires.
2.3.3
Consumer Substitution Possibilities
Although there are no real substitutes for tires, consumers have choices with respect
to replacement tires that can affect the demand for specific types of replacement tires. They
3
Because passenger car and light truck tires typically account for about 90 percent of total tire sales, the
discussion of demand is focused primarily on information about these two types of tires.
2-13
can choose to purchase new tires or used tires, have their tires retreaded, or purchase highperformance tires. At this level, the demand for a specific type of tire is probably elastic and
more dependent on price. Specifically, higher prices for new replacement tires may lead
some consumers to postpone replacing worn tires or to purchase used or retreaded tires.
Vehicle manufacturers and consumers of replacement tires have several options as to
the type of tire they put on a vehicle. They can choose from different qualities of tires,
including high-performance and speed-rated tires, and they can also choose among different
brands.
High-performance and speed-rated tires have been increasing in popularity recently.
These premium-priced tires, which produce wider profit margins for tire companies, now
account for 36 percent of all original equipment passenger car tires and about 34 percent of
all replacement passenger car tires. Although these premium tires are of radial design, they
tend to wear out much faster than conventional radials and thus increase the frequency at
which tires are replaced (Standard & Poor’s, 1998). This change in consumers’ preferences
contributes to the demand for replacement tires.
2.4
Facilities and Ownership
This section describes the manufacturing plants that were identified in the draft
P-MACT, including the capacity utilization and employment of these facilities, trends for the
overall industry, characteristics of the firms that own the facilities potentially affected by the
regulation, and information on vertical and horizontal integration in the industry.
2.4.1
Manufacturing Plants
The entire domestic rubber tire industry, including all establishments in SIC 3011, is
composed of 104 companies owning 152 establishments (U.S. Department of Commerce,
1992) and employing 64,800 people (U.S. Department of Commerce, 1996). The draft
P-MACT identifies 14 companies and 43 facilities that manufacture tires.4 Figure 2-1 shows
4
Rubber and Plastics News (1998) identifies 16 companies operating 53 tire manufacturing facilities in the
United States. Most of these ten additional facilities are very small or have very recently begun
operations.
2-14
GA
1
MS
2
AL
5
TN 3
KY 1
CA
1
TX
1
KS
1
OK
3
IA
1
AR
1
IL
5
IN
1
OH
4
SC
4
VA
2
NC
4
PA
2
NY
1
Figure 2-1. Rubber Tire Plants in the United States, 1998
Source: U.S. Environmental Protection Agency (EPA). June 1998. Draft Presumptive Maximum Achievable
Control Technology (P-MACT) for the Rubber Tire Manufacturing Source Category.
2-15
the distribution of these facilities throughout the United States. The facilities identified in
the draft P-MACT are found in 19 states. Twenty-two of the 43 identified facilities are
located in Alabama, Illinois, North Carolina, South Carolina, and Ohio.
2.4.1.1 Tire Manufacturing Facilities
The group of tire manufacturing facilities examined in this profile consists of 43
manufacturing facilities owned by 14 companies. The MACT regulation will affect only
those U.S. facilities that are major sources. Table 2-3 lists the rubber tire manufacturing
facilities that the regulation will potentially affect, their location, the year they opened, their
employment, the type of tire they produce, and their estimated capacity. The average age of
the tire manufacturing facilities identified in the draft P-MACT is 35 years (Rubber and
Plastics News, 1998).
2.4.1.2 Capacity Utilization
The measure of capacity utilization is based on output, measured in tires per year.
Rubber and Plastics News reported the total U.S. industry is currently capable of producing
961,780 tires per day.5 Annually, this amounts to a capacity of 344.3 million units, assuming
the facilities are open for 51 weeks a year. The RMA reported 1997 total domestic
production for its membership as 286.4 million tires. Because the RMA membership
represents 90 percent of the total domestic shipments, EPA inflated the number of tires
members of the RMA produce to provide an industry total. The estimate of total domestic
production is 318.2 million units per year. EPA derived capacity utilization for the entire
domestic tire industry by dividing the estimate for actual production of 318.2 million tires by
total production capacity 344.3 million, or 96 percent.
2.4.1.3 Manufacturing Facility Employment
Rubber and Plastic News reports the total employment of all U.S. tire manufacturers
as 59,700. Assuming the firms are using the same reporting basis, the facilities identified in
the draft P-MACT account for 56,352 of these employees, or 94 percent of total industry
employment. Table 2-3 shows the number of employees at each of the tire manufacturing
facilities identified in the draft P-MACT.
5
This figure is missing data for five facilities.
2-16
Table 2-3. U.S. Tire Manufacturing Facilities Identified in Draft P-MACT
Company Name
Bridgestone/
Firestone
Carlisle
Continental/
General Tire
Cooper Tire and
Rubber
Denman Tire
Dunlop Tire
Fidelity
Goodyear Tire
KellySpringfield Tire
(a subsidiary of
Goodyear Tire)
Facility
Location
Decatur, IL
La Vergne, TN
Warren County,
TN
Wilson, NC
Oklahoma City,
OK
Year
Facility
Opened
Employment
Tire Type
1963
1972
2,100
1,800
1990
885
1974
2,140
Passenger, light truck
41,000
1969
2,050
Passenger, light truck
43,500
Des Moines, IA
1945
1,777
Bloomington, IL
Carlisle, PA
Bryan, OH
Charlotte, NC
Mount Vernon,
ILa
Mayfield, KY
1965
1917
1966
1967
525
735
350
1,848
1991
431
Truck, bus
2,700
1960
350
5,000
Albany, GA
1991
900
Findlay, OH
1919
1,000
Texarkana, AR
Tupelo, MS
1964
1984
1,250
1,100
Leavittsburg,
OH
1919
340
Buffalo, NY
1923
1,000
Huntsville, AL
1969
1,640
Natchez, MS
1986
200
Akron, OH
Topeka, KS
Danville, VA
Gadsden, ALb
Lawton, OK
Union City, TN
Fayetteville, NC
1983
1944
1966
1929
1978
1968
1969
600
2,000
2,300
2,300
2,300
3,000
2,900
Passenger, truck, bus, farm
Passenger, light truck, truck,
bus
Passenger, light truck, truck,
bus
Passenger, light truck
Passenger
Passenger, light truck, truck,
bus, farm, large OTR,
industrial, racing
Passenger, light truck, truck,
bus, motorcycle
Passenger, light truck
Passenger, light truck, truck,
bus, farm
Racing
Truck, bus, farm, large OTR
Truck, bus, aircraft
Passenger, light truck
Passenger
Passenger, light truck
Passenger, light truck
2,000
8,100
13,000
33,000
63,000
55,000
64,000
Freeport, IL
1964
1,700
Passenger
30,000
Tyler, TX
1962
1,500
Passenger
37,500
(continued)
2-17
Passenger, light truck
Passenger, light truck, truck
Estimated
Capacity
(units/day)
Truck, bus
Passenger, truck, bus, large
OTR
Large OTR
Light truck, industrial
Farm, large OTR, industrial
Passenger
24,000
18,500
5,500
12,100
300
22,000
300
29,000
22,000
25,000
39,000
40,000
2,600
10,700
27,000
10,000
Table 2-3. U.S. Tire Manufacturing Facilities Identified in Draft P-MACT (continued)
Company Name
Pirelli Tire
Greenville, SC
Anderson, SC
Lexington, SC
Spartanburg, SC
Dothan, AL
Lexington, SC
Norwood, NC
Ardmore, OK
Fort Wayne, IN
Opelika, AL
Tuscaloosa, AL
Hanford, CA
Specialty
Titan
Yokohama Tire
Michelin
Michelinc
Total
a
b
c
Facility
Location
Year
Facility
Opened
Employment
1975
2,000
1997
400
1978
1979
1981
1987
1969
1961
1963
1945
1962
1,400
600
1,300
500
1,700
1,500
1,450
1,900
630
Indiana, PA
1915
300
Des Moines, IL
Salem, VA
1943
1968
1963
(Avg)
820
831
56,352
Tire Type
Passenger
Large OTR
Truck, bus
Light truck
Passenger
Aircraft
Passenger, light truck
Passenger, light truck
Passenger, light truck
Passenger, light truck
Passenger, light truck
Passenger, light truck, farm,
industrial, racing, aircraft
Light truck, farm
Passenger, light truck
Estimated
Capacity
(units/day)
23,000
NA
6,000
5,500
20,000
640
33,000
29,000
20,400
23,700
12,000
3,300
13,000
25,000
900,340
This plant is a joint venture between Continental/General Tires, Toyo, and Yokohama. The plant is managed
by Continental/General Tires.
Goodyear announced on February 3, 1999, that this facility will cease tire manufacturing by the end of 1999.
The plant will continue to mix rubber for other manufacturing plants.
These facilities were listed in the draft P-MACT as owned by Uniroyal/Goodrich, which is now owned by
Michelin.
Source: Rubber and Plastics News. September 7, 1998. “The World’s Tire Production Facilities: North
American Tire Production Facilities.”
2-18
Table 2-4. General Trends, SIC 3011, 1985–1996
a
Employment
Value of Shipments/
Employee
($1996 103)
Capital
Expenditures
($1996 103)a
$14,643,200
70,300
$208
$697,100
1986
$13,553,300
65,200
$208
$533,300
1987
$13,835,800
65,400
$212
$446,800
1988
$14,389,300
67,800
$212
$534,900
1989
$14,347,800
68,000
$211
$963,900
1990
$13,965,600
67,700
$206
$768,200
1991
$13,456,300
65,500
$205
$572,900
1992
$13,015,800
64,600
$201
$557,800
1993
$13,530,600
65,100
$208
$525,700
1994
$13,825,200
65,100
$212
$542,800
1995
$14,393,900
65,700
$219
$525,200
1996
$14,209,300
64,800
$219
$578,500
Year
Value of Shipmentsa
($1996 103)
1985
Constant 1996 dollars adjusted by GDP deflator, obtained from the Economic Report to the President (1998).
Source: U.S. Department of Commerce. 1985-1996. Annual Survey of Manufactures, Statistics for Industry
Groups and Industries. Table 2. Washington, DC: Government Printing Office.
2.4.2
Trends
The data contained in Tables 2-4 and 2-5 are for all establishments in SIC 3011.
Table 2-4 shows trends in constant dollar value of shipments, employment, value of
shipments per employee, and capital expenditures. Table 2-5 shows productivity trends.
These trends are discussed in more detail below.
2.4.2.1 Value of Shipments
The constant dollar ($1996) value of industry shipments for the U.S. rubber tire
industry was $14.2 billion in 1996. This represents a real decrease of 3 percent from 1985.
Constant dollar values of shipments varied from 1985 to 1996, reaching a low of $13.0
billion in 1992, and a high of $14.6 billion in 1996.
2-19
Table 2-5. Productivity Trends, SIC 3011, 1988–1996
Year
Annual Output per Hour
Annual Output per Employee
1988
$102.9
$104.7
1989
$103.8
$103.5
1990
$103.0
$101.1
1991
$102.4
$99.1
1992
$107.8
$109.3
1993
$116.5
$116.0
1994
$124.1
$125.0
1995
$131.1
$131.9
1996
$138.8
$136.8
Percentage Change
35%
31%
Source: Bureau of Labor Statistics, Office of Productivity and Technology. January 1999. Industry
Productivity Index and Producer Price Index, “Labor Productivity Tables, 1987 Forward, All
Published 4-Digit Industries.” <http://www.bls.gov/iprdata1.htm#Industry>.
2.4.2.2 Employment
Table 2-4 shows industry employment for the years 1985 through 1996. Employment
fell sharply from 1985 to 1986 and since then has fluctuated, rising somewhat in the late
1980s, and remaining between 64,600 and 65,700 through 1996. In 1996 employment levels
were 7.8 percent lower than 1985 levels (U.S. Department of Commerce, 1996). This
decline began as a result of the adverse market conditions in the mid- to late 1980s when the
industry experienced severe competitive pressures, excess capacity, and low prices. These
conditions made it necessary for companies to cut costs, eliminate plants, and avoid pay
increases (Sawinski, 1995). This, as mentioned earlier, has created labor relations problems
in the industry and has led to several strikes.
2.4.2.3 Productivity
The efficiency of both facilities and workers has increased over the past decade. The
average number of workers per factory has decreased over the years because of increased
productivity and automation (Sawinski, 1995). Table 2-4 shows trends in labor productivity
by using the average constant dollar value of shipments per employee from 1985 through
1996, which has increased in real terms from $208,000 to $219,000, or 5.3 percent over this
2-20
time period. Although the number of employees has decreased during these years, constant
dollar value of shipments have increased, indicating more productive workers, more efficient
processes, or both.
Productivity can also be examined with a few key ratios. These ratios are output per
hour and output per employee. For SIC 3011, both the ratios of output per hour and output
per employee have increased from 1988 through 1996, by 35 percent and 31 percent,
respectively (see Table 2-5).
2.4.2.4 Capital Expenditures
Another trend of importance to the industry is the amount of money spent on capital
investments. Table 2-4 lists annual capital expenditures for SIC 3011 from 1985 through
1996, in 1996 dollars. These include expenditures for “(1) permanent additions and major
alternations to manufacturing establishments and (2) machinery and equipment used for
replacement and additions to plant capacity if they were of the type for which depreciation
accounts are ordinarily maintained” (U.S. Department of Commerce, 1992).
Over this time period, annual capital expenditures decreased (in real terms) by
approximately 17 percent, from around $697 million to $579 million. Capital expenditures
peaked in 1989, reaching nearly $964 million (U.S. Department of Commerce, 1996). Since
August 1997, Bridgestone/Firestone, Goodyear, and Michelin have all invested to expand
their capacity at several facilities and to construct a few newer ones. While most of the
expansion is at existing facilities, some new U.S. facilities are under construction.
A few examples of new investments for the rubber tire industry include a $435
million plant currently under construction by Bridgestone/Firestone for passenger and light
truck tires. Bridgestone/Firestone also completed a $110 million expansion of its Warren
County, TN, plant in 1994. In June 1998, Dunlop Tire Corporation also announced plans for
a $25 million expansion at its Buffalo, NY, plant.
2.4.2.5 Technology
As described in the introduction, the rubber tire manufacturing industry has gone
through a major restructuring over the last decade or so. There have also been major changes
in tire production itself. Most, if not all, manufacturing plants for passenger and light truck
tires have switched from bias-ply design to radial-ply design technology. This technological
change in production has been nearly universally implemented by this time. Over 90 percent
2-21
of the passenger tires shipped in 1997 were radial (RMA, 1997). No other technology-driven
changes in manufacturing processes have been identified at this time.
2.4.2.6 Number of Establishments
Table 2-6 contains information gathered from the Statistics of U.S. Businesses on the
number of new and terminated establishments and information on establishments that
continued operation but either expanded or contracted their employment levels during the
years 1989 through 1995. The number of establishments includes all of SIC 3011. During
this time period, more establishments were opened than closed, and more establishments
expanded rather than contracted their employment.
Table 2-6. SUSB Data on 3011 Establishment Changes, 1990–1995
Current
Year
a
b
New
Establishment
Since Previous
Yeara
Terminated
Establishments
Since Previous
Yeara
Net
Changea
Continuing
Establishments
Expanding
Employmenta
Continuing
Establishments
Contracting
Employmentb
1990
7
13
–6
58
41
1991
12
3
+9
40
69
1992
10
7
+3
58
60
1993
8
8
0
62
42
1994
11
5
+6
56
49
1995
10
3
+7
63
54
Represents new or terminated establishments at any time during current year.
Represents activity from March of previous year to March of current year.
Source: U.S. Small Business Administration, Office of Advocacy. January 1999. “Dynamic Firm Size Data
for SIC 3011.” Statistics of U.S. Businesses. <http://www.sba.gov/ADVO/stats>.
2.4.3
Firm Characteristics
The information contained in this section focuses on both the domestic parent
companies that own the facilities potentially affected by the regulation, and their ultimate
corporate parents. This section describes the ownership pattern of the firms and their
employment size distribution, respectively; explains patterns of vertical and horizontal
integration of the rubber tire industry; and discusses financial conditions in the rubber tire
industry.
2-22
2.4.3.1 Ownership
Fourteen parent companies own the 43 facilities identified in the draft P-MACT.
Sales and employment data for domestic parent companies of the identified facilities are
important for the EIA, in particular for identifying affected small businesses. The
information on domestic parents contained in Table 2-7 was obtained from Dun &
Bradstreet. Table 2-7 also lists information on the ultimate corporate parent for information
purposes only. Data on ultimate parents were gathered from Rubber and Plastics News and
corporate websites. Goodyear and Sumitomo Rubber Industries, Ltd announced a series of
joint ventures in February 1999. The operating joint ventures in North America and Europe
will be owned 75 percent by Goodyear and 25 percent by SRI. In Japan, SRI will own 75
percent of two joint ventures and Goodyear will own 25 percent.
2.4.3.2 Size Distribution
The Regulatory Flexibility Act (RFA), as amended by the Small Business Regulatory
Enforcement Fairness Act (SBREFA) of 1996, requires federal regulatory agencies to
determine whether a proposed or final regulation will have a significant impact on a
substantial number of small entities. For SIC 3011, a small entity is defined by the Small
Business Administration as a firm with 1,000 or fewer employees. This cut-off is made
based on domestic parent employment; therefore, it is necessary to obtain employment
information at this level. At this time, there are no domestic parent companies identified that
have fewer than 1,000 employees. Table 2-7 provides employment information from Dun &
Bradstreet for both the domestic parent companies and the ultimate parents of the identified
facilities.
2.4.3.3 Vertical and Horizontal Integration
For the purpose of this profile, the Agency examined vertical integration of the
corporate parents. Vertical integration is the concentration of multiple stages of production
within a single firm. The rubber tire manufacturing parent companies tend to be highly
vertically integrated. For example, many tire companies own and operate their own
distribution systems.
2-23
Table 2-7. Domestic and Ultimate Parent Employment and Sales
Domestic
Parent
Bridgestone/
Firestone Inc.
Facilities
Bridgestone/Firestone
Decatur, IL
La Vergne, TN
Warren County, TN
Wilson, NC
Oklahoma City, OK
Domestic
Parent
Salesa
Domestic
Parent
Employmenta
$6.5 billion
45,000
Ultimate
Parent
Ultimate
Parent
Salesb
Ultimate Parent
Employmentb
Bridgestone
Corporation,
Japan
$17.9
billion
96,200
$1.3 billion
8,500
Carlisle
Companies
Inc.
Carlisle Tire and
Wheel
Carlisle, PA
$1.3 billion
8,500
Carlisle
Companies
Inc.,
U.S.
Continental
General Tire
Continental/General
Tire
Bryan, OH
Charlotte, NC
Mayfield, KY
Mount Vernon, ILc
$1.4 billion
7,000
Continental
A.G.,
Germany
$6.62
billiond
44,800
Cooper Tire
and Rubber
Co.
Cooper Tire and
Rubber
Findlay, OH
Texarkana, AR
Tupelo, MS
$1.8 billion
10,456
Cooper Tire
and Rubber
Co., U.S.
$1.8 billion
10,456
NA
Denman Tire
Leavittsburg, OH
NA
NA
NA
NA
NA
3,276
Sumitomo
Rubber
Industries,
Japan
NA
NA
91,310
Goodyear
Tire and
Rubber Co.,
U.S.
$13.2
billion
91,310
91,310
Goodyear
Tire and
Rubber Co.,
U.S.
$13.2
billion
91,310
Dunlop Tire
Corp.
Dunlop Tire
Buffalo, NY
Huntsville, AL
Goodyear Tire
Akron, OH
Danville, VA
Goodyear Tire
Gadsden, AL
and Rubber
Topeka, KS
Company
Lawton, OK
Union City, TN
Kelly-Springfield Tire
Goodyear Tire Fayetteville, NC
and Rubber Freeport, IL
Company
Tyler, TX
$751
million
$13.2
billion
$13.2
billion
(continued)
2-24
Table 2-7. Domestic and Ultimate Parent Employment and Sales (continued)
Domestic
Parent
Michelin
North
America
a
b
c
d
e
Facilities
Michelin
Anderson / Lexington,
SC
Ardmore, Ok
Dothan, AL
Fort Wayne, IN
Greenville, SC
Lexington, SC
Norwood, NC
Opelika, AL
Spartanburg, SC
Tuscaloosa, AL
Pirelli Tire
Corporation
Pirelli Tire
Hanford, CA
Polymer
Enterprises
Inc.
Specialty Tires of
America
Indiana, PA
Domestic
Parent
Salesa
Domestic
Parent
Employmenta
NA
NA
Groupe
Michelin,
France
$13.9
billion
119,800
$104.7
million
1,011
Pirelli
Group,
Italy
NA
NAc
$55 million
500
Polymer
Enterprises
Inc., U.S.
$55 million
500e
4,100
Titan
International
Inc.,
U.S.
$690
million
4,100
1,651
Yokohama
Rubber Co.
Ltd.,
Japan
NA
NA
Titan
International
Inc.
Fidelity Tire Mfg. Co.,
Titan Tire Corp.
Natchez, MS
Des Moines, IL
$690
million
Yokohama
Corp. North
America
Yokohama Tire Corp.
Salem, VA
$171
million
Ultimate
Parent
Ultimate
Parent
Salesb
Ultimate Parent
Employmentb
Dun & Bradstreet Marketing Identifier File, January 1999.
Corporate websites.
Reported 1,500 employees in Rubber and Plastics News.
Converted to U.S. dollars using a currency exchange rate of 0.5912 $/DM (www.x-rates.com, January 1999).
Reported 1,450 employees in Rubber and Plastics News.
In addition, many tire companies own their own rubber manufacturing
2-25
plants and therefore do not need to purchase rubber from independent rubber manufacturers.
For example, Goodyear Tire and Rubber Company is investing over $600 million over the
next 3 years for two new synthetic rubber plants. There is also a growing trend in the
industry to own rubber plantations because it creates a strong competitive advantage
(Goodyear, 1999). Michelin is following this trend by owning and operating six rubber
plantations.
Horizontal integration measures the extent to which corporations engage in
diversified product lines. The corporations owning tire manufacturing plants do engage in
activities other than tire manufacturing. However, the majority of their sales comes from the
sale of tires. In 1997, the top nine tire producers averaged 78 percent of their corporate sales
through tire sales. Several firms engage in activities other than tire manufacturing. For
example, Bridgestone Corporation manufactures a wide range of diversified products,
including industrial rubber and chemical products and sporting goods. Seventy-two percent
of Bridgestone Corporation’s corporate sales come from the sale of tires. Groupe Michelin
also manufactures other products, but to a lesser extent than Bridgestone. Tire sales make up
93 percent of Groupe Michelin’s total corporate sales. Goodyear has other lines of business
in chemicals and engineered products, but their tire line accounts for 85 percent of sales
(Tirebusiness, 1999).
2.4.3.4 Financial Condition
The financial condition of the industry’s firms will affect the incidence of impacts
associated with the costs of implementing the requirements of the MACT regulation. Each
year, Dun & Bradstreet publishes Industry Norms & Key Business Ratios, which reports
certain financial ratios for a sample of firms for different industries. Tables 2-8 and 2-9
present an analysis of selected solvency and profitability ratios for 21 establishments that
manufacture tires and inner tubes included in the 1997 Dun & Bradstreet study.
2-26
Table 2-8. Solvency Ratios for SIC 3011, 1997
Description
1997 Median for Tire
and Inner Tube
Manufacturinga
Cash + receivables to
current liabilities
(quick ratio)
Indicates the protection afforded short term creditors
by revealing the size of liquid assets available to
cover debt that falls due within one year.
1.0
Analysis: This industry is
in a liquid position.
Current assets to
current liabilities
(current ratio)
Measures the degree to which current assets cover
liabilities, indicating the ability to retire current
liabilities and cover any possible shrinkage in the
value of current assets.
2.0
Analysis: This industry
has adequate coverage.
Current liabilities to net
worth
Shows the level of risks creditors are assuming with
funds that the owners have used to make permanent
investments.
51.1%
Analysis: This industry
poses a low level of risk.
Ratios
a
Analysis provided by Abt Associates based on Dun & Bradstreet guidelines for interpreting financial ratios.
2-27
Table 2-9. Profitability Ratios for SIC 3011, 1997
Ratios
Return on sales
(profit margin)
Return on assets
Return on net worth
(return on equity)
a
Description
Median for Tire and Inner
Tube Manufacturinga
Reveals the profits earned per dollar of sales as a
measure of the efficiency of the operation.
Indicates the firms’ ability to achieve satisfactory
profits for owners and withstand adverse business
conditions.
2.5%
Analysis: The industry’s
profitability is low,
indicating a low tolerance for
business downturns.
Indicates firm profitability by matching operating
profits with assets available to earn a return.
Shows if firms are using their assets efficiently.
3.6%
Analysis: Indicates a low
level of operating profits
relative to investment.
Analyzes the ability of management to realize an
adequate return on owners’ investments.
4.6%
Analysis: The industry’s best
measure of return, but quite
low relative to other
industries.
Analysis provided by Abt Associates based on Dun & Bradstreet guidelines for interpreting financial ratios.
2-28
Table 2-10. Net Earnings, 1996
Ultimate Parent Company
1996 Net Earnings
($106)
Bridgestone
646.3
Michelin
609.0
Pirelli
300.0
Continental
128.3
Cooper
107.9
Goodyear
101.7
Sumitomo
43.0
Yokohama
34.5
Toyo
9.8
Total: Nine firms
3,976.5
Source: Tirebusiness. January 1999. <http://www.tirebusiness.com> and
<http://www.tirebusiness.com/subscriber>.
Solvency, or liquidity, measurements are significant in evaluating a company’s
ability to meet short- and long-term obligations. These figures are of prime interest to credit
managers of commercial companies and financial institutions. Table 2-8 presents three
solvency ratios for SIC 3011 and includes a brief analysis of these ratios developed by Abt
Associates.
Profitability ratios show how successful a business is in earning returns on invested
equity and assets. Table 2-9 presents three profitability ratios for SIC 3011 and includes a
brief analysis of these ratios developed by Abt Associates.
The rubber tire manufacturing industry profits are considered modest by other
industry standards. Within the rubber tire industry, profits for original equipment tires are
considerably lower than profits for replacement tires (Griffiths, 1997b). Recent reports of
corporate net earnings indicate that, for the last 3 years, the U.S. divisions of the major
rubber tire manufacturing companies have earned positive profits (Tirebusiness, 1999).
Table 2-10 shows positive recent net earnings for all the major producers.
2-29
Anecdotal information reported by the major tire producers indicates that the
companies are currently experiencing modest increases in various measures of profitability
and financial health. The examples below use data reported by the firms themselves, and no
attempt has been made to standardize the information, making comparisons difficult.
Goodyear reported a 4.4 percent increase in operating income from its tire business in
the first 9 months of 1998 over the same period in 1997. The company characterized this as
a sluggish performance relative to its competitors and attributed it to lower sales caused by
the strong U.S. dollar. Goodyear stated that increases in operating income are due to lower
raw material costs, improved productivity, and cost containment measures.
Bridgestone/Firestone, Inc., the U.S. subsidiary of Bridgestone Corporation, reported
that its net earnings for the first half of 1998 reached $149 million, a substantial increase
over the earnings of $101.3 million in the same period the prior year. The company forecast
its year-end net earnings to reach $300 million, up from $200 million in 1997 and $172
million in 1996.
In 1998, Continental reported that it experienced an increase in corporate profits for
the fifth year in a row, with a significant increase in after-tax profits over 1997. The U.S.
division, Continental General Tire, saw its 1998 earnings improve by 20 percent over the
previous year, despite the GM strike and a strike at their Charlotte plant.
2.5
Markets
This section discusses market structure; provides background on current market
volumes, prices and international trade; and presents information on future market volumes,
prices, and international trade. This section describes the current status of the industry and
supports the development and implementation of the EIA.
2.5.1
Market Structure
The global rubber tire manufacturing industry is fairly concentrated, dominated by
large multinational companies. This market concentration is most likely due to barriers to
entry such as the influence of brand loyalty, capital requirements related to building or
modernizing manufacturing facilities, and maintaining highly advanced research and
development facilities. However, anecdotal information and price data indicate that the
industry does behave competitively. The industry has several characteristics that classify it
as competitive:
&
Manufacturers have relatively low profit ratios.
2-30
&
Manufacturers compete to secure desirable original equipment contracts with auto
manufacturers.
&
Consumers of replacement tires have numerous choices.
&
Price is the main characteristic of tires within the same category.
&
Overcapacity exerts downward price pressure.
The 11 largest tire manufacturers accounted for about 81.5 percent of the world’s tire sales in
1996 (Tirebusiness, 1999). The leading three companies, Michelin, Bridgestone/Firestone,
and Goodyear, accounted for 53.5 percent of sales in 1996. Figure 2-2 shows the breakdown
of 1996 market share according to global tire sales.
Others
25%
Michelin
18%
Yokohama
4%
Pirelli
Bridgestone
5%
18%
Sumitomo
6%
Continental
7%
Goodyear
17%
Figure 2-2. Global Tire Sales, 1996
Source: Tirebusiness. January 1999. <http://www.tirebusiness.com> and
<http://www.tirebusiness.com/subscriber>.
In terms of market share, the “Big Three” of the tire industry (Bridgestone, Michelin,
and Goodyear) are twice as large as the next three largest companies—Continental, Pirelli,
and Sumitomo (owner of Dunlop-Europe). A study published in 1995 by Economist
Intelligence Unit reported that the Big Three had an average operating margin of 7.8 percent,
compared to an operating margin of 4.7 percent for the next smallest three firms (Griffiths,
2-31
1997b). The study authors reported that, with the exception of Cooper and Pirelli, it has
become more and more difficult over time for smaller manufacturers to earn profit margins
comparable to the Big Three. To compete with the Big Three, smaller manufacturers have
tended to focus on a specific niche (high performance or premium tires) or in regional
markets. Moreover, the report suggested this trend will continue. The Big Three are
expected to continue their acquisition activities and aggressive pricing strategies geared
toward increasing market share and profits (Griffiths, 1997b).
2.5.2
Current Market Volumes
The following section describes current market volumes in terms of domestic
production, domestic consumption, and international trade. The rubber tire market consists
of six production classifications:
&
passenger tires;
&
light truck tires;
&
medium, wide base, heavy and large-off-the-road tires (M/WB/H/LOR);
&
front farm implement tires;
&
rear farm implement tires; and
&
industrial, garden tractor, and utility tires.
Two subclassifications exist within each production classification: original equipment tires
and replacement tires.
In 1997, replacement tires of all types accounted for about 76 percent of the value of
domestic market shipments (RMA, 1997). In recent years, most of the growth in tire
shipments has come from the replacement tire market. Over time, technology improvements
resulting in greater tire durability may reduce consumer demand for replacement tires.
The annual growth rate for original equipment tire shipments has steadily dropped
from 13.9 percent in 1994 to 2.4 percent in 1997 with a low of –1.8 in 1996. It is also
expected that a small component of the original equipment market, the spare tire market
(“doughnuts”), will eventually diminish over the next few years if run-flat tires gain market
share. Table 2-11 presents total U.S. shipments by end-use market from 1993 to 1997. The
table also presents growth rates for the original and replacement markets, the total market, as
well as each market segment’s share of total market growth.
2-32
Table 2-11. Total U.S. Shipments by End-Use Market, 1993–1997 (103)a
Replacement Tires
Market
Sector
Growth
Market
Sector
Growth
Percentage
of Total
Growth
Total Tires
Year
Tires
Shipped
1993
200,659
1994
209,040
4.2%
3.2%
69,283
13.9%
3.2%
278,323
6.4%
1995
204,570
–2.1%
–1.6%
68,514
–1.1%
–0.3%
273,084
–1.9%
1996
214,932
5.1%
3.8%
67,283
–1.8%
–0.5%
282,215
3.3%
1997
221,289
3.0%
2.3%
68,924
2.4%
0.6%
290,213
2.8%
Tires
Shipped
60,840
Average
a
Percentage
of Total
Growth
Original Equipment Tires
2.7%
Tires
Shipped
Total
Growth
261,499
1.2%
2.7%
Represents 100 percent of U.S. domestic market excluding exports. Includes tires for passenger vehicles,
light trucks and medium, wide base, and heavy trucks only.
Source: Rubber Manufacturers Association. 1997. Tire Industry Facts, 1997. Washington, DC: Rubber
Manufacturers Association.
2.5.2.1 Domestic Production
In its 1997 publication, Tire Industry Facts, the RMA reported domestic production
(including production for exports) for its members. According to the RMA, its members
represent 90 percent of domestic tire production. From 1985 to 1997, the RMA report shows
domestic production of tires grew by almost 28 percent, from 207.0 million tires to 286.4
million tires. Over this time period, the production of passenger tires grew by 24 percent,
from 163 million units to 216 million units and accounted for 78 percent of the industry’s
total growth. Domestic production was at its lowest point in 1986 because the industry
responded to the declining demand for new tires and declining tire prices with major capacity
cutbacks during the 1980s.
In 1997, passenger tires comprised 76 percent of domestic production volumes, light
truck tires represented 12 percent, and the remaining four tire types made up the remaining
12 percent of the production volumes (RMA, 1997). Table 2-12 presents tire production data
by product classification from 1985 through 1997 as reported by RMA. Figure 2-3 presents
total production for the same period.
2-33
Table 2-12. U.S. Annual Production, 1985–1997 (103 units produced)a
Tire Category
Light
Truckb
M/WB/H/
LORc
Front Farm
Implementc
Rear Farm
Implementc
Ind/Gard/Utilc
Total
Tires
23,294
10,097
1,668
1,086
8,297
207,026
159,350
22,046
8,894
1,697
1,007
7,447
200,441
1987
167,522
26,202
9,253
1,944
1,111
9,201
215,233
1988
174,341
26,636
10,374
2,036
1,237
7,908
222,532
1989
175,026
27,074
10,770
2,194
1,337
8,870
225,271
1990
1991
174,859
169,580
25,855
23,014
9,948
9,796
2,085
1,906
1,299
1,144
10,822
9,360
224,868
214,800
1992
192,725
26,738
10,787
1,923
1,179
11,358
244,710
1993
197,520
27,826
12,101
2,030
1,310
11,510
252,297
1994
201,113
29,310
13,273
2,345
1,310
13,798
261,149
1995
210,127
30,897
14,497
2,367
1,436
14,794
274,118
1996
210,329
31,371
15,080
2,460
1,480
15,830
276,550
1997
216,236
33,459
15,680
2,550
1,530
16,930
286,385
5.5%
0.9%
0.5%
5.9%
100.0%
Year
Passenger
1985
162,584
1986
Percentage of Total 1997 Production
75.5%
a
b
c
11.7%
Includes shipments for domestic consumption and exports using RMA member production data only, which
represents approximately 90 percent of industry production.
Includes estimated data provided by RMA for production from non-RMA facilities.
Includes estimates for 1996 and 1997 using average annual growth rate for 1985–1995.
Source: Rubber Manufacturers Association. 1997. Tire Industry Facts, 1997. Washington, DC: Rubber
Manufacturers Association.
In 1998, the 7-week General Motors strike temporarily slowed overall production for
the original equipment tire market segment. However, since most of the growth in the rubber
tire industry came from the replacement tire market, manufacturers generally experienced
increased sales in 1998. For example, during the first 9 months of 1998, Goodyear’s
domestic tire production increased by 2.4 percent over 1997. Contending with a labor strike
at one of its own facilities, Continental General still increased its overall gross sales revenues
by 2.5 percent over 1997 by increasing passenger tire sales revenues by 2 percent and truck
tire sales revenues by 15 percent.
2-34
300
280
Millions
260
240
220
200
180
1985
1986
1987
1988
1989
1990
1991
1992
1993
1994
1995
1996
1997
Year
Figure 2-3. Total Domestic Tire Production, 1985–1997 (number of tires)
Source: Rubber Manufacturers Association. 1997. Tire Industry Facts, 1997. Washington, DC: Rubber
Manufacturers Association.
Foreign investment in U.S. production grew in recent years. As of 1994, foreignbased tire manufacturers acquired almost one-half of U.S. production capacity, and some
have built or are building their own new facilities in addition to those they acquired. Factors
contributing to the increase in foreign investment include the efficient performance of U.S.
production facilities and the devaluation of the U.S. dollar in the mid-1980s. This
development eliminated the previous price advantage foreign producers had exporting to the
United States when the dollar was stronger.
2.5.2.2 Domestic Consumption
Table 2-13 and Figure 2-4 present consumption of tires from 1985 through 1997 by
product classification as reported by RMA.6 The data presented include RMA member
shipments plus imports. Between 1985 and 1997, domestic consumption of tires grew by
just over 25 percent, from 246.9 million tires to 309.2 million tires. Over this time period,
the consumption of passenger tires grew by 21 percent and accounted for 66 percent of the
industry’s total growth. In 1997, the consumption of passenger tires consisted of 77 percent
of domestic consumption, the consumption of light truck tires represented 11 percent of the
6
RMA typically uses the term “shipments” to represent domestically produced and imported tires, called
consumption here.
2-35
Table 2-13. U.S. Annual Consumption, 1985–1997 (103 units)
Tire Category
Year
Passenger
Light
Truckb
M/WB/H
/LORc
Front Farm
Implementc
Rear Farm
Implementc
Ind/Gard/Utilc
Total
Tires
1985
196,294
23,800
15,996
1,936
1,055
7,810
246,891
1986
198,659
23,900
15,352
1,860
971
8,205
248,947
1987
204,805
26,026
16,333
2,161
1,104
9,349
259,778
1988
209,425
26,777
15,943
2,266
1,149
7,299
262,859
1989
202,326
26,430
15,109
2,342
1,213
6,318
253,738
1990
199,450
26,544
14,714
2,291
1,213
9,269
253,481
1991
197,259
24,761
13,296
1,943
1,089
9,484
247,832
1992
212,101
26,332
14,462
1,969
1,059
10,270
266,193
1993
217,481
28,198
16,076
2,033
1,210
11,762
276,760
1994
228,431
31,240
17,887
2,172
1,257
13,072
294,059
1995
223,809
31,579
17,914
2,133
1,304
13,350
290,089
1996
232,420
33,439
18,180
2,150
1,330
14,250
301,769
1997
237,272
35,079
18,160
2,160
1,360
15,220
309,251
Percentage of Total 1997 Consumption
76.7%
a
b
c
11.3%
5.9%
0.7%
0.4%
4.9%
100.0%
Includes RMA member shipments plus imports for domestic consumption only, which represents
approximately 90 percent of industry shipments.
Includes estimated data provided by RMA for production from non-RMA facilities.
Includes estimates for 1996 and 1997 using average annual growth rate for 1985 through 1995.
Source: Rubber Manufacturers Association. 1997. Tire Industry Facts, 1997. Washington, DC: Rubber
Manufacturers Association.
market, and the consumption of the remaining four tire types made up the remaining 12
percent of the consumer demand for rubber tires.
Table 2-14 and Figure 2-5 present the value of shipments for SIC 3011 from 1985 to
1997 expressed in both current and real 1996 dollars, using the rubber tire producer price
index.
2-36
320
Millions
300
280
260
240
1985
1986
1987
1988
1989
1990
1991
1992
1993
1994
1995
1996
1997
Year
Figure 2-4. Total Domestic Tire Consumption, 1985–1997 (number of tires)
Source: Rubber Manufacturers Association. 1997. Tire Industry Facts, 1997. Washington, DC: Rubber
Manufacturers Association.
2.5.2.3 World Production and International Trade
The Global Market. Overall, the 1996 global rubber tire production reached 73
million units (Table 2-15). Non-U.S. producers accounted for 65 percent of this production.
Most of the growth in global production has been from increases in replacement tire
production. In absolute terms, global production of replacement tires has increased by 249
million replacement units over the 25 year period ending in 1996, compared to 90 million
OEM units. As an example of annual growth rates, in 1996, world rubber tire production for
passenger and truck/bus tires increased by about 2.8 percent over 1995 production levels.
Recently, weak economic conditions, troubled financial markets, and
disadvantageous currency exchange rates resulted in a drop in 1998 rubber tire sales volumes
in Asia and South America. Some companies recouped their losses through increasing sales
in the mature markets of North America and Europe and expanding production in developing
countries where production costs are lower. Table 2-15 presents tire production for the
passenger and truck/bus categories for the United States and the rest of the world in 1996.
2-37
Table 2-14. Value of Shipments, 1985-1997
a
b
1996 Real Value of
Shipments
($106)
Year
Current Value of
Shipmentsa
($106)
1985
10,434.0
78.53
14,643.2
1986
9,909.5
80.58
13,553.3
1987
10,427.4
83.06
13,835.8
1988
11,240.1
86.09
14,389.3
1989
11,680.3
89.72
14,347.8
1990
11,860.8
93.60
13,965.6
1991
11,882.5
97.32
13,456.3
1992
11,810.0
100.00
13,015.8
1993
12,601.2
102.64
13,530.6
1994
13,182.9
105.09
13,825.2
1995
14,073.9
107.76
14,393.9
1996
14,209.3
110.21
14,209.3
1997
14,013.2
112.40
13,740.2
GDP Price Deflatorb
U.S. Department of Commerce. 1985–1996. Annual Survey of Manufactures, Statistics for Industry Groups
and Industries. Table 2 and Table 4. Washington, DC: Government Printing Office.
Obtained from Economic Report of the President. 1998. Washington, DC: Government Printing Office.
Some company-specific examples are provided below to illustrate their roles in the
global market.
&
Goodyear (U.S.). In 1996, reported tire sales for Goodyear rose by 7.2 percent.
During the first 9 months of 1998, the Goodyear Company experienced weak
original equipment sales in Asia and South America but increased its worldwide
sales volume by 1 percent through increased sales to North America and Europe.
&
Bridgestone/Firestone (Japan). Bridgestone/Firestone reported that it
experienced significant increases in its domestic market share since 1992 and as a
result built a new plant to meet this increased demand and to reduce its reliance
on Japanese imports.
&
Continental General (Germany). In 1996, Continental General reported a 24
percent increase in net profits, in part by transferring production from Germany to
2-38
$16
Billions
$14
$12
Current $
$10
Adjusted $1996
$8
1985
1986
1987
1988
1989
1990
1991
1992
1993
1994
1995
1996
1997
Year
Figure 2-5. Value of Shipments, 1985–1997
Base year = 1982.
Source: U.S. Department of Commerce. 1985–1996. Annual Survey of Manufactures, Statistics for Industry
Groups and Industries. Table 2 and Table 4. Washington, DC:
D Government Printing Office.
Table 2-15. Global Rubber Tire Production, 1996 (passenger and truck/bus 103 units)
Product Category
Total
Passenger
210,329
356,761
567,090
Truck/bus
44,987
124,666
169,653
255,316
481,427
736,743
Total
a
Rest of Worlda
U.S.
Values contain estimates from several countries
Source: Tirebusiness homepage. January 1999. <http://www.tirebusiness.com> and
<http://www.tirebusiness.com/subscriber>. (primary sources: International Rubber Study Group,
individual national trade associations, World Service, Goodyear, Smithers Scientific Services Inc).
the Czech Republic and Portugal. During the first 9 months of 1998, Continental General’s
passenger tire market volumes in Europe rose by 10 percent over 1997, which increased their
gross sales revenues by 7 percent. Also in 1998, Continental acquired controlling interest in
a South African tire manufacturer that exports 3.5 million tires a year and supplies both
replacement and original equipment car and truck tires to domestic auto manufacturing
plants. Continuing to invest in developing markets, Continental also bought two plants in
Mexico and entered into a joint venture in Slovakia, where it is planning to increase the
2-39
annual capacity of a truck tire manufacturing facility from 0.5 million units to 1.5 to 2.0
million units.
&
Pirelli (Italy). In 1996, Pirelli reported that its tire sales fell by 4.6 percent due to
a strong lire, but operating profits rose by 6.9 percent.
&
Sumitomo/Dunlop-Europe (Japan). In 1996, Sumitomo/Dunlop-Europe
reported that its sales revenues rose by 6.1 percent and consolidated profits rose
by 29 percent, with a forecast for further gains in 1997.
U.S. Imports and Exports. U.S. imports of rubber tire products exceed its exports.
Table 2-16 presents a summary of the U.S. trade balance for SIC 3011, along with selected
trade ratios. These ratios show that while imports’ share of U.S. apparent consumption has
remained virtually the same (20 percent) from 1989 to 1996, exports’ share of shipments has
doubled, causing the ratio of imports to exports to decline by over 50 percent. It has not yet
been determined if the import data reflect original equipment tire imports that are installed
on new imported vehicles, tires shipped directly to domestic vehicle manufacturers for
installation on new vehicles, or replacement tires.
Imports and exports of both passenger and light truck tires increased between 1996
and 1997 and are expected to increase again in 1998. Table 2-17 summarizes the imports
and exports of passenger and light truck tires from 1996 through 1998.
U.S. Trading Partners. The United States engages in trading with Japan, Mexico,
South Korea, and Canada. The United States has the largest trading deficit with Japan,
followed by Canada and then South Korea. Recently, Canada has been the United States’
largest trading partner. Table 2-18a and 2-18b present the 1996 value and share of tire
imports and exports by region and by major trading partner for SIC 3011, as well as the
change between 1992 and 1996 for each trading partner’s share.
2.5.3
Prices
Table 2-19 shows that the average price per tire received by the seven largest
manufacturers. This price was derived by dividing the manufacturer’s total tire sales by the
estimated number of tires produced by each company. The weighted average price received
by the manufacturer for the top eight companies in 1996 was $66. Prices for individual tire
categories are not currently available.
2-40
2-41
11,810
12,601
13,183
14,074
14,209
1991
1992
1993
1994
1995
1996
14.6%
2,713
3,030
3,095
2,985
2,685
2,470
2,275
2,522
$2,644
Imports
146.8%
1,452
2,004
1,901
1,630
1,473
1,418
1,282
1,097
$812
Exports
–44.0%
–$1,261
–$1,026
–$1,194
–$1,355
–$1,212
–$1,052
–$993
–$1,425
–$1,832
Trade
Deficit/
Surplus
12.8%
13,924
15,235
15,268
14,538
13,813
12,862
12,876
13,286
$13,512
Apparent
Consumption
0.0%
0.19
0.20
0.20
0.21
0.19
0.19
0.18
0.19
0.20
Ratio of
Imports to
Consumption
100.0%
0.11
0.14
0.14
0.12
0.12
0.12
0.11
0.09
0.07
Ratio of Exports
to Product
Shipments
–53.7%
1.98
1.51
1.63
1.83
1.82
1.74
1.77
2.30
3.26
Ratio of
Imports to
Exports
Source: U.S. Department. of Commerce, Bureau of the Census, International Trade Administration. www.ita.doc.gov/industry/otea/usfth/t26.pm.
21.7%
11,883
1990
Percentage
change
1989–1996
11,861
1989
12,663
$11,680
Year
Average
Value of
Shipments
Table 2-16. U.S. Trade Balance and Selected Statistics (1989–1996) (current $106)
Table 2-17. Imports and Exports, 1996–1998
Passenger Tires (103)
Imports
Year
a
Light Truck Tires (103)
Exports
Imports
Exports
1996
42.6
23.7
4.8
3.5
1997
47.8
27.7
5.7
3.8
1998a
53.0
31.0
7.5
4.0
Forecast.
Source: Rubber Manufacturers Association. RMA Website. <http://www.rma.org>.
Table 2-18a. Exports by Region and Major Trading Partner, 1996
Trade Areas
NAFTA
1996 Value
($103)
Percentage of
1996 Share
Percentage Change
from 1992
1,039
53.2
9.0
Latin America
223
11.4
16.1
Western Europe
239
12.2
2.5
Japan/Chinese Economic Areas
257
13.2
7.0
51
2.6
18.2
146
7.5
10.5
Other Asia
Rest of world
World total
1,955
100
8.8
Top five countries
Canada
746
38.1
7.6
Mexico
294
15
13.1
Japan
235
12
7.4
Germany
71
3.6
Netherlands
40
2
6.6
–2.8
As Figure 2-5 demonstrates, beginning in 1985, the producer price index for rubber
tires subcategory within SIC 3011 fell sharply for 2 years. Tire prices reached their lowest
level in 1987 over the 1985-1997 period. After 1987, prices rose until 1995 when they
reached their highest point in the previous 10 years. Tire prices have declined by 5.5 percent
in the last 2 years, returning to levels roughly the same level as in 1985. One analyst
2-42
Table 2-18b. Imports by Region and Major Trading Partner, 1996
Trade Areas
NAFTA
1996 Value
($103)
Percentage of
1996 Share
Percentage Change
from 1992
1083
35.8
8.5
Latin America
158
5.2
5.2
Western Europe
419
13.9
–0.3
Japan/Chinese Economic Areas
972
32.2
5.9
Other Asia
327
10.8
2.8
62
2.0
–0.5
3020
100.0
5.2
Canada
977
32.3
6.7
Japan
758
24.9
4.5
South Korea
202
6.7
–0.7
Brazil
130
4.3
4.0
Taiwan
123
4.1
–1.6
Rest of world
World total
Top five countries
Source: U.S. Department of Commerce/International Trade Administration, DRI/McGraw-Hill and Standard &
Poor’s. 1998. U.S. Industry and Trade Outlook ‘98: Plastics and Rubber. Washington, DC:
Government Printing Office.
attributed this drop in prices to Bridgestone/Firestone’s recent capacity additions in the
Table 2-19. Average Passenger Tires Prices Received by the Manufacturer, 1996
Unit Sales (103)
Average per Unit
($1996)
Goodyear
178.6
$66
Michelin
171.3
$76
Bridgestone
169.0
$73
Continental
76.1
$61
Sumitomo
61.5
$65
Pirelli
48.0
$65
Cooper
37.0
$43
Company
Total
762.5
Wtd Average
$66
Source: Tirebusiness. January 1999. <http://www.tirebusiness.com> and
<http://www.tirebusiness.com/subscriber>.
2-43
United States (Griffiths, 1997a).
2.5.4
Market Forecasts
This section presents available information regarding forecasts of domestic
consumption and production, international trade, and market prices.
2.5.4.1 Domestic Consumption
According to the RMA’s Tire Market Analysis Committee, U.S. manufacturing
consumption7 in the passenger tire category is forecasted to reach 182.5 million tires in 1998
and 185.8 million in 1999. Passenger car replacement tires have an expected long-term
growth rate of 1.57 percent annually, which would bring consumption to 198 million tires by
2003. Passenger car original equipment consumption is projected to reach 56.1 million tires
in 1998, and at least 58.4 million in 1999 surpassing the peak in 1994. It is expected that the
increase in original equipment passenger car tire consumption will continue into the future,
reaching 59 million in 2002.
Light truck replacement tire consumption is expected to reach 30.5 million tires in
1998, and 31.5 million in 1999. A forecast for the 2002-2003 period was not provided.
Light truck original equipment consumption is forecasted to be 6.4 million in 1998, to
increase to 6.6 in 1999, and then dip to 6 million a year and remain constant through 2003.
Replacement highway truck tire consumption is expected to increase to 13 million
and 13.2 million units in 1998 and 1999, respectively, and to remain constant through 2002.
Growth in highway truck original equipment consumption is expected to continue into 1998
where shipment are forecasted to peak at 5.8 million. In 1999, OEM consumption of
highway truck tires is expected to decline slightly and then remain constant at about 5
million through 2003. Table 2-20 presents the forecast consumption data described above
for the three categories of tires and for both the OEM and replacement markets.
7
RMA typically uses the term shipments to represent domestically produced and imported tires, called
consumption here.
2-44
2-45
58.4
59.0
1999
2002/2003
Specific value not reported.
a
198.0
185.8
182.5
Replacement
6.0
6.6
6.4
Original
Equipment
Highway Truck Tires
Total
NAa
31.5
30.5
5.0
5.7
5.8
a
13.2
13.2
13.0
70.0
70.7
68.3
NA
230.5
226.0
Original
Original
Replacement Equipment Replacement Equipment Replacement
Light Truck Tires
Source: Rubber Manufacturers Association. RMA Website. <http://www.rma.org>.
a
NA = not available.
56.1
1998
Year
Original
Equipment
Passenger Tires
Table 2-20. Projected U.S. Tire Consumption (103 units)
NA
300.5
294.3
Original
Equipment +
Replacement
One source forecasts that the value of tire shipments for SIC 3011 will increase by
4.2 percent in current terms. Table 2-21 presents the forecast of the value of rubber tire
shipments for the 1998–2000 period.
Table 2-21. Projected Value of U.S. Rubber Tire Shipments ($103)
Year
Value
1998
$14,321
1999
$14,629
2000
$14,937
Source: Darnay, Arsen J. 1998. Manufacturing USA, 3011 Tires and Inner Tubes. 6th Edition. Detroit, MI:
Gale Research Inc.
Short-term prospects for demand growth of the original equipment market are
forecasted to be poor due to expected drop-offs in new car purchases (U.S. Department of
Commerce/International Trade Administration, 1998). Conversely, this decline will
contribute to increased demand for replacement tires for an aging national automobile fleet.
Growth in vehicle miles traveled is also expected to contribute to increased demand for
replacement tires. Demand growth is also expected in both the light truck and the truck and
bus markets. Near-term growth in demand during 1997 and 1998 was expected to be
between 1 and 1.6 percent. Long term growth in demand for all three main tire groups is
expected to be correlated to overall GDP growth, closer to 2 percent.
2.5.4.2 Domestic Production
In recent years, the major driver for increased domestic production has been growth
in exports and, to a lesser extent, domestic demand. This is evidenced by the doubling in
exports’ share of the value of shipments between 1989 and 1996, while the total value of
shipments decreased in real terms and imports’ share of value of shipments remained the
same.
Domestic production is expected to continue to increase to meet domestic demand
and export demand to the extent that
&
there is sufficient capacity,
&
domestic production efficiencies continue to result in competitively priced
products, and
2-46
&
domestic and export demand increases.
At this time, domestic production capacity is being increased by current capacity additions.
The recently announced plans to close Goodyear’s Gasden plant will probably offset this
trend somewhat. It is assumed that current production efficiencies of the new capacity will
meet or exceed current those of existing production.
2.5.4.3 International Trade
Demand in the global tire market is expected to rise by almost 20 percent from 1997
to 2005. Most of the growth is predicted to occur in developing countries, while demand in
North America and Europe are only forecasted to grow by 8 percent from 1997 to 2005
(Griffiths, 1997b). In the world market for tires, companies are seeking increased shares of
the growing market by cutting costs, investing in new technologies and efficiency gains, and
aggressively acquiring plants in countries such as Mexico and South Africa.
The factors that are expected to affect the future levels of international trade by U.S.
tire manufacturers are the relative strength or weakness of the world and regional economies
and currency exchange rates between the dollar and currencies of U.S. trading partners.
Despite the forecasts for growth in the world market, should the economic problems some
countries are experiencing continue or worsen, the tire manufacturing industry could again
face a crisis like the one in the early 1980s that led to price wars, plant closures, and
consolidation.
While the U.S. tire manufacturing industry sells primarily to the domestic market, the
United States has increasingly depended on the export tire market for growth. Since the
early 1990s, the ratio of exports to tire product shipments has grown by 100 percent. By
contrast, imports’ share of total consumption has remained steady at around 20 percent and is
not expected to change. By 2003, the long-term trade balance is expected to decrease to net
imports of about 10 million for passenger car tires and to net imports of 1 million for light
truck tires (RMA, 1999). Imports are also expected to decrease because foreign-owned tire
manufacturers are adding capacity in North America to reduce their exports to the United
States from their non-U.S. facilities.
2.5.4.4 Price Forecasts
While specific tire price forecasts are not available for this profile, the review of
anecdotal evidence suggests that there will be continuing downward pressure on tire prices in
the near term for several reasons. First, recent trends in the producer price index shown in
2-47
Figure 2-6 indicate falling prices over the last 2 years. In addition, it is expected that a
strong dollar relative to Asian currencies combined with a dropoff in demand in the Asian
and South American markets is likely to prompt overseas manufacturers to look to the
United States and European markets to sell their relatively less expensive tires.
100
98
96
94
92
90
1985
1986
1987
1988
1989
1990
1991
1992
1993
1994
1995
1996
1997
Year
Figure 2-6. Producer Price Index
Base year = 1982.
Source: U.S. Bureau of Labor Statistics (BLS). Producer Price Index—Commodities: WPU071201, Tires:
1990–1998. <http://www.bls.gov>. Obtained January 20, 2000a.
A strong dollar relative to other currencies is also likely to reduce demand for U.S.
exports. Some industry analysts expect U.S. firms to use near-term lower prices to gain
domestic and international market share as a way of increasing profits in the long run.
Finally, increasing efficiency and capacity of domestic production will also result in
decreased cost of production. Given the competitive climate anticipated in the future, these
conditions are expected to exert price pressure on domestic producers.
2-48
REFERENCES
Bridgestone/Firestone. January 1999. <http://www.bridgestone-firestone.com>.
Darnay, Arsen J. 1998. Manufacturing USA, 3011 Tires and Inner Tubes. 6th Edition.
Detroit, MI: Gale Research Inc.
Dun & Bradstreet. 1998. Industry Norms & Key Business Ratios Desk-Top Edition
1997–1998. Murray Hill, NJ: Dun & Bradstreet Information Services.
Dun & Bradstreet. 1999. Dun’s Market Identifiers [computer file]. New York, NY: Dialog
Corporation.
Dunlop Tire. January 1999. <http://www.dunloptire.com>.
Economic Report of the President. 1998. Washington, DC: Government Printing Office.
Goodyear. January 1999. <http://www.goodyear.com>.
Griffiths, John. June 12, 1997a. “Optimism Abounds in Spite of U.S. Price Wars.”
Financial Times.
Griffiths, John. June 12, 1997b. “Pressure on Profits Remain.” Financial Times.
Ita, P.A., and A.C. Gross. January 1995. “Industry Corner: World Rubber and Tire.”
Business Economics 30(1).
Jovanovic, Bryan, and Glenn MacDonald. 1994. “The Life Cycle of a Competitive
Industry.” Journal of Political Economy 102(2):322-47.
Michelin. January 1999. <http://www.michelin.com>.
Pirelli Tire. January 1999. <http://www.pirelli.com>.
Rubber and Plastics News. September 7, 1998. “The World’s Tire Production Facilities:
North American Tire Production Facilities.”
Rubber Manufacturers Association. 1997. Tire Industry Facts, 1997. Washington, DC:
Rubber Manufacturers Association.
R-1
Rubber Manufacturers Association. RMA Website. <http://www.rma.org>.
Rubberworld. January 1999. <http://www.rubberworld.com>.
Sawinski, Diane M. 1995. U.S. Industry Profiles, The Leading 100: Rubber Products. Gale
Research Inc.
Standard & Poor’s. March 5, 1998. Industry Surveys: Autos and Auto Parts.
StataCorp. 1999. Stata Statistical Software: Release 6.0. College Station, TX: Stata
Corporation.
Tirebusiness. January 1999. <http://www.tirebusiness.com> and
<http://www.tirebusiness.com/subscriber>.
Titan International. January 1999. <http://www.titan-intl.com>.
U.S. Bureau of Labor Statistics, Office of Productivity and Technology. January 1999.
Industry Productivity Index and Producer Price Index, “Labor Productivity Tables,
1987 Forward, All Published 4-Digit Industries.” <http://www.bls.gov/
iprdata1.htm#Industry>.
U.S. Bureau of Labor Statistics (BLS). Producer Price Index—Commodities: WPU071201,
Tires: All years available. <http://www.bls.gov>. As obtained on
January 20, 2000a.
U.S. Bureau of Labor Statistics (BLS). Producer Price Index—Commodities:
WPUSOP3000, Finished Goods: 1990–1998. <http://www.bls.gov>. As obtained
on June 22, 2000b.
U.S. Bureau of Labor Statistics (BLS). Producer Price Index—Commodities: WPU071102,
Synthetic Rubber: All years available. <http://www.bls.gov>. As obtained on
July 29, 2000c.
U.S. Bureau of Labor Statistics (BLS). Producer Price Index—Commodities:
WPUSOP3510, Finished Energy Goods: All years available. <http://www.bls.gov>.
As obtained on July 29, 2000d.
U.S. Bureau of Labor Statistics (BLS). National Employment, Hours, and Earnings:
EEU32301006, Average Hourly Earnings of Production Workers; Tires and Inner
Tubes (SIC 301): All years available. <http://www.bls.gov>. As obtained on
July 29, 2000e.
R-2
U.S. Department. of Commerce, Bureau of the Census, International Trade Administration.
www.ita.doc.gov/industry/otea/usfth/t26.pm. Washington, DC: Government Printing
Office.
U.S. Department of Commerce. 1992. Census of Manufactures—Rubber Products: Industry
Series. Table 7. Washington, DC: Government Printing Office.
U.S. Department of Commerce. 1985–1996. Annual Survey of Manufactures, Statistics for
Industry Groups and Industries. Table 2 and Table 4. Washington, DC:
Government Printing Office.
U.S. Department of Commerce/International Trade Administration, DRI/McGraw-Hill and
Standard & Poor’s. 1998. U.S. Industry and Trade Outlook ‘98: Plastics and
Rubber. Washington, DC: Government Printing Office.
U.S. Environmental Protection Agency (EPA). 1995. Rubber and Miscellaneous Plastics
Products Sector Notebook. Washington, DC: U.S. Environmental Protection Agency.
U.S. Environmental Protection Agency (EPA). June 1998. Draft Presumptive Maximum
Achievable Control Technology (P-MACT) for the Rubber Tire Manufacturing
Source Category. Washington, DC: U.S. Environmental Protection Agency.
U.S. Environmental Protection Agency (EPA). 1999. OAQPS Economic Analysis Resource
Document. Durham, NC: Innovative Strategies and Economics Group.
U.S. Small Business Administration, Office of Advocacy. January 1999. “Dynamic Firm
Size Data for SIC 3011.” Statistics of U.S. Businesses.
<http://www.sba.gov/ADVO/stats>.
Walters, Steve. March 20, 1995. “Overcapacity, Pricing Plague Tire Industry.” Rubber and
Plastics News II 16(12):4.
R-3
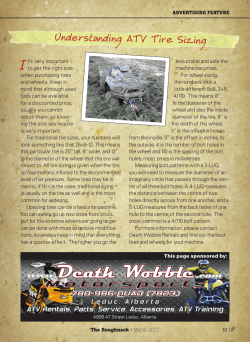


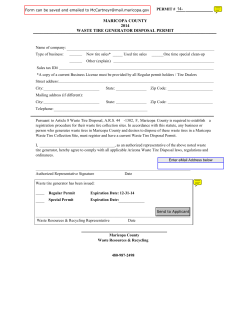


© Copyright 2026