
Apr 2015 - Indian Roads Congress
The Indian Roads Congress E-mail: [email protected]/[email protected] Volume 43 4 Number 4 April 2015 ContentsISSN 0376-7256 From the Editor’s Desk - Some Essential Measures Warranted in Road Crash Prevention Page 5 Technical Papers Pedestrian Level of Service Criteria for Urban Off-Street Facilities of Mid-Size Cities Using Som in Ann Rima Sahani 16 Founded : December 1934 IRC Website: www.irc.org.in P.K. Bhuyan Eco-Friendly Mulching - Enhancing Road Safety and its Aesthetics Through Value Engineering B.K. Thakkar 22 Uttarakhand Deluge - Man - Made W. Rahman 30 Tender Notice, NH Madurai 31 Tender Notice, NH Lucknow 32 Tender Notice, MORTH, NH Madurai 33 Tender Notice, NH Bareilly Jamnagar House, Shahjahan Road, New Delhi - 110 011 Tel : Secretary General: +91 (11) 2338 6486 Sectt. : (11) 2338 5395, 2338 7140, 2338 4543, 2338 6274 Fax : +91 (11) 2338 1649 A.K. Gupta Kama Koti Marg, Sector 6, R.K. Puram New Delhi - 110 022 Tel : Secretary General : +91 (11) 2618 5303 Sectt. : (11) 2618 5273, 2617 1548, 2671 6778, 2618 5315, 2618 5319, Fax : +91 (11) 2618 3669 No part of this publication may be reproduced by any means without prior written permission from the Secretary General, IRC. Edited and Published by Shri S.S. Nahar on behalf of the Indian Roads Congress (IRC), New Delhi. The responsibility of the contents and the opinions expressed in Indian Highways is exclusively of the author/s concerned. IRC and the Editor disclaim responsibility and liability for any statement or opinion, originality of contents and of any copyright violations by the authors. The opinions expressed in the papers and contents published in the Indian Highways do not necessarily represent the views of the Editor or IRC. From the Editor’s Desk Some Essential Measures Warranted in Road Crash Prevention S.S. Nahar Dear Readers, The severity of road crash primarily depends upon degree of over-speed (driver’s state of mind) and design of vehicle besides other contributory factors like road condition, weather, unexpected hindrance(s) etc. It is observed that in event of crash at speed of 30 km per hour or less, pedestrian have 90% chances of survival but in case of crash at speed of 45 km per hour or more, the chances of survival remain to be 50% or less. With the improvement of technology, it has been realized that apart of frame and material type, zoning is essential to enhance safety performance of vehicle. The crash worthiness of a vehicle depends upon the structural strength and restraint system. In case of rollover, the strength of cabin roof plays vital role. The restraint force per unit of weight (strength of roof) is the measure of the strength to weight ratio. Managing the release of kinetic energy of vehicle in the event of crash to minimize the intrusion is of vital importance in order to diminish chances of loss of life and property. In order to bring down the rate of fatalities, multiple air bags inside the vehicle, pre-tensioning devices in the seat belt lock and tightening the belt webbing and besides foolproof testing for frontal/side crash, rollover and whiplash of vehicles are recommended to be mandated. Besides, in order to ensure the positioning of vehicle within safe driving zone, provision of crash barriers and blinkers (preferably solar based) at hazardous locations like school, hospitals, zebra-crossings, inter-changes, blind curves, ramps to fly-overs/high embankments etc. are recommended to be mandated for identification through safety audit. “A great man is different from an eminent one in that he is ready to be the servant of the society”. Bharat Ratna Dr. Bhimrao Ramji Ambedkar Place : New Delhi Dated: 25th March, 2015 4 (S.S. Nahar) Secretary General INDIAN HIGHWAYS, April 2015 PEDESTRIAN LEVEL OF SERVICE CRITERIA FOR URBAN OFF-STREET FACILITIES OF MID-SIZE CITIES USING SOM IN ANN Rima Sahani* and P.K. Bhuyan** ABSTRACT Pedestrian Level of Service (PLOS) is a quantitative term which represents the quality of service of walking facilities. In this study an attempt has been made to define levels of service provided by the off-street pedestrian facilities in mid-sized cities of India, taking pedestrian space, flow rate, volume to capacity ratio and average walking speed as the Measure of Effectiveness (MOE). As defining PLOS is a classification problem, it has been observed that Self Organized Map (SOM) one of the clustering methods is used to classify the ranges of different measure of effectiveness in this regards. From the study it is observed that average space of >15.67 meter2/pedestrian, flow rate of ≤0.063 pedestrians/second/meter width, average speed of >1.22 meter/second and volume to capacity ratio of ≤0.4 pedestrian can move in their desired path at LOS ‘A’ without changing movements and it is the best condition for off-street facilities. But situation considered to be PLOS ‘F’ at which movement is severely restricted and frequent collision among pedestrians occurs, parametric ranges expressed as average space ≤4.48 meter2/pedestrian, flow rate of >0.145 pedestrians/second/ meter width, average speed of ≤0.62 meter/second and volume to capacity ratio of >1.00.The ranges of the parameters used for LOS categories found in this study for Indian cities are different from that mentioned in HCM (2010) because of differences in population density, traffic flow condition, geometric structure and some other factors. 1INTRODUCTION Indian cities have traditionally been cities of walkers, and many urban dwellers rely on walking, cycling and public transport for their daily travel. However, with the exponential increase in motorization, limited attention has been paid to pedestrian and public transport facilities. A change in focus is required which will allow people, not vehicles, to reclaim the urban environment. Growing motorization has also lead to a dramatic increase in the number of pedestrian fatalities and accidents, and high levels of air pollution-particularly exposing pedestrians who walk to work or access public transport to reach their destinations. There are few initiatives to promote the improvement of walking in Indian cities. The few civil society organizations and non government organizations working in this area can play key roles in promoting improvements on walk ability and pedestrian facilities in their cities. As Pedestrian Level of Service (PLOS) is an essential part for highly heterogeneous traffic flow on urban corridors in India, in this study an attempt has been made to define LOS criteria for mid-sized cities. Defining the PLOS criteria is a module of LOS analysis procedure of urban off-street pedestrian facilities. These methodologies affect the planning, design, and operational aspects of transportation projects as well as the allocation of limited financial resources among competing transportation projects. This envisages the importance of suitable methods that should be adopted while defining the PLOS criteria of urban streets in the context of cities in India. Considering the importance of LOS analysis for urban off-streets pedestrian facilities in Indian context, an in-depth research was carried out in the present study. In this study two important mid-size cities (population less than a million), Bhubaneswar and Rourkela of Odisha state, India are taken as the study area. By using video data collection procedure all the field data like speed of pedestrian, effective walkway width and pedestrian hourly volume are collected. For the determination of different LOS categories parameters like flow rate, pedestrian space and Volume to Vapacity (V/C) ratio are calculated. Then with the help of SOM clustering, ranges of PLOS are determined in establishing the evaluation criteria for PLOS of offstreet pedestrian facilities in urban Indian context. The overall framework of this study is illustrated in Fig. 1. Fig. 1 Overall Framework of the Study *Research Scholar, E-mail: [email protected], **Assistant Professor, E-mail: [email protected], Department of Civil Engineering, National Institute of Technology Rourkela. INDIAN HIGHWAYS, April 2015 5 TECHNICAL PAPERS 2BACKGROUND STUDY OF THE 2.1 General HCM (2000) describes that the LOS criteria for pedestrian flow are based on subjective measure, which can be imprecise. However, it is possible to define ranges of space per pedestrian, flow rates and speeds, which then can be used to develop quality-of-flow criteria. It defines six LOS categories for pedestrian facilities. The HCM (2010) also designates six LOS from “A” to “F,” for pedestrian facility, with LOS “A” representing the best operating conditions and LOS “F” the worst. It uses distinct average pedestrian space values as boundaries for the various LOS. HCM (2010) stated that as volume and density increase, pedestrian speed declines. As density increases and pedestrian space decreases, the degree of mobility afforded to the individual pedestrian declines, as does the average speed of the pedestrian stream. According to HCM 2000 pedestrian facilities can be of two types that are uninterrupted and interrupted. When pedestrian facilities are not affected by any motorized modes of travel then the facility is known as the uninterrupted pedestrian facility or off-street pedestrian facilities and vice versa. Several studies have been performed relating to the analysis of PLOS of pedestrian facilities. IRC:103-2012 has defined six ranges of pedestrian space and flow rate to provide PLOS categories in Indian condition, where LOS A is having pedestrian space >4.9 m2/p and flow rate ≤12 p/min/m. Dandan et al. (2007) quantificational analysed the correlation between the pedestrian LOS and the affected factors; then on the basis of the analysis of urban roads with typical road transect form it interpreted that the factors which significantly affected the pedestrian LOS were the bicycle volume, the vehicle volume, the pedestrian 6 volume, driveway access frequency and the distance between sidewalk and vehicle lane and also a pedestrian LOS model has been developed with the significant variables. Muraleetharan and Hagiwara (2007) focused on examining the influence of overall LOS of sidewalks and crosswalks on pedestrian route choice behaviour and attributes affecting overall LOS of sidewalks and crosswalks. Smith (2009) suggested that perceptions as well as objective assessment of the environment are significant in different ways in predicting walking behaviour. In Indian cities pedestrian’s side walk behaviour is different from that of pedestrians in developed countries. In this regard Rastogi et al. (2011) discussed about the development of adjustment factors for effective design of pedestrian facilities on the basis of pedestrian walking speeds under influences like age and gender, land uses, temporal variations, cell phone usage, carrying baggage while walking and moving in groups; on three types of facilities, e.g., sidewalks, widesidewalks, and precincts. The authors observed that pedestrians in India cross slower than their counterparts in other countries. Male pedestrian were found to cross the road faster (1.22 m/s) than female pedestrian (1.11 m/s) irrespective of road system and land use of surrounding area. The authors suggested that the design speed for specific locations such as school and recreational area can be taken as 0.98-0.99 m/s and the places where older pedestrian are dominant, a design speed of 0.79 can be adopted. Laxman et al. (2010) have carried out a study for medium-sized cities in India and analyzed the pedestrians flow characteristics under mixed traffic condition. The authors observed that the free-flow speed of Indian pedestrian is 80 m/min which is higher than that for China and Singapore, but slightly lower than that in Germany. 2.2Sidewalk Several factors have been observed to influence the service level of pedestrians while in movement along the sidewalk. Petritsch et al. (2006) incorporated traffic volumes on the adjacent roadway and exposure (i.e., crossing widths) at conflict points with intersections and driveway and the study reveals that traffic volumes on the adjacent roadway and the density of conflict points along the facility are the primary factors in the LOS model for pedestrians travelling along urban arterials with sidewalks. Sisiopiku et al. (2007) compared the various pedestrian sidewalk assessments and shown that the same sidewalk segment may receive multiple LOS ratings when different assessment methods are considered and the fact applies to sidewalks located on both urban and campus-like environments. Houten et al. (2007) stated that because pedestrian signal violations at midblock crosswalks are associated with pedestrian crashes, it is important to improve pedestrian signal compliance at these locations. One way to improve compliance is to decrease pedestrian delay by reducing minimum green time. Miller et al. (2008) investigated the approach speed and passing clearance that seg-way devices exhibit on encountering a variety of obstacles on the sidewalk. Keegan and Mahony (2003)indicated that the countdown timer units induced a reduction in the number of individuals who crossed during the red man (do not walk) signal and as a result of the positive outcome in terms of the analysis, the countdown timer-units are being introduced on a phased basis to a wider area in Dublin city. 2.3 Clustering Self-Organizing Map (SOM) is one of the techniques in Artificial Neural Network (ANN) having the inherent capability to learn the pattern of input and to detect regularities and shows the INDIAN HIGHWAYS, April 2015 TECHNICAL PAPERS correlations in their input with respect to its output. The application of SOM in ANN for this particular problem is to cluster the service levels provided by the urban off-street facilities measured by various parameters. Lingra (1995) compared grouping of traffic pattern using the Hierarchical Agglomerative Clustering and the Kohonen Neural Network methods in classifying traffic patterns. It has been mentioned that the Kohonen neural network integrates the hierarchical grouping of complete patterns and the least-mean-square approach for classifying incomplete patterns. It is advantageous to use hierarchical grouping on a small subset of typical traffic patterns to determine the appropriate number of groups and change its parameters to reflect the changing traffic patterns. Such an approach is useful in using hour-to-hour and day-to-day traffic variations in addition to the monthly traffic-volume variation in classifying highway sections. Florio and Mussone (1995) have taken the advantage of application of ANN in classification problem to develop the flow-density relationship of a motorway. The author defined the stability and instability of spacing of vehicle in traffic stream. Sharma et al. (1994) studied and compared the learning ability of both supervised and unsupervised type of learning method for clustering. Al-Garni and Abdennour (2008) developed a technique using the ANN to detect and count the vehicles plying on road from the video graph data. Yang and Qiao (1998) used neural network to classify traffic flow state. Author applied a self-organizing neural network pattern recognition method to classify highway traffic states into some distinctive cluster centres. Jian-ming (2010) developed a combined ANN and Genetic Algorithm method for the prediction of traffic volume in Sanghai Metropolitan Area. The accuracy of prediction of traffic volume of future traffic improved significantly with this INDIAN HIGHWAYS, April 2015 combined algorithm. Cetiner et al. (2010) developed a back propagation Neural Network traffic flow model for prediction of traffic volume of Istanbul City. The model uses the historical data at major junctions of the city for prediction of future traffic volume. From the background of this study it has been observed that there is a significant body of research featuring new ways of evaluating pedestrian service levels on urban sidewalks. These studies recommend everything from small amendments to the HCM’s PLOS calculation to completely new LOS methodologies, depending on local needs and characteristics. These studies suggest that the current tool for measuring pedestrian LOS prescribed by the HCM may not take into account important differences in pedestrian characteristics, location characteristics, and flow characteristics when evaluating midsized Indian City sidewalks. The issue is how to determine the threshold values for partitioning different PLOS categories. SOM clustering is the method that is applied to define urban off-street pedestrian LOS categories in this study. The major objectives of this study are: (1) To estimate the optimum number of PLOS categories using various cluster validation parameters and (2) To determine the ranges of PLOS categories using various Measure of Effectiveness (MOE) for urban offstreets facility in urban India context. 3 ARTIFICIAL NEURAL NETWORK (ANN) ANN is the result of academic investigations that use mathematical formulations to model nervous system operations. The resulting techniques are being successfully applied in a variety of everyday business application. ANN is used to learn pattern and relationship in data. The ANN mimics the human ability to adapt to changing circumstances and the current environment. They learn from the events that have happened from past apply this learning to future environment. ANN consists of many nodes i.e. processing unit analogous to neuron in the brain. Each node has a node function and also some local parameters. Modification of local parameter changes the node function. Neural network may be of single or multiple layers. Single layer consists of input neurons and output neurons. Multi layer artificial neural network consists of input layer, output layer and hidden layer. There are various types of ANN like Feed forward neural network, Radial basis function network, Self-organizing Map (SOM), recurrent neural network. For this study, SOM which is best among ANNs for clustering of data is used. 3.1Self-Organizing Map (SOM) A self-organizing map is a type of artificial neural network that is trained using unsupervised learning to produce a low-dimensional (typically twodimensional) map. Self-organizing maps are different from other artificial neural networks in the sense that they use a neighbour-hood function to preserve the topological properties of the input space. A self-organizing map consists of nodes. A weight vector is associated with each node and the weight vector is of the same dimension as the input data vectors. The usual arrangement of nodes is a regular spacing in a hexagonal or rectangular grid. The self-organizing map describes a mapping from a higher dimensional input space to a lower dimensional map space. The procedure for placing a vector from data space onto the map is to first find the node with the closest weight vector to the vector taken from data space. Once the closest node is located it is assigned the values from the vector taken from the data space. 3.2 Architecture of ANN and Parameters Used The architecture of the ANN is shown 7 TECHNICAL PAPERS in Fig. 2. SOM algorithm is used in this research to train the Input data. SOM basically has 2 layers architecture, containing Input and Output layer. The input layer contains nodes, through which input data is given to the neural network. The number of nodes varies according to the dimension of input data set. In this study the input layer contains 120 nodes because 120 data points are utilized for training of neural network. Each node is associated with a weight vector which changes in every iteration during training process. The output layer contains neurons and each neuron corresponds to the centroid of a particular cluster. The shape of the neuron depends upon the topology function. In this study hexagonal topology was chosen. Fig. 3 PLOS Methodology for off-Street Walk-Ways (Source: HCM 2010) Step: 1 Determination of Effective Walkway Width Effective walkway width is the portion of a walkway that can be used effectively by pedestrians. Various types of obstructions and linear features, discussed below, reduce the walkway area that can be effectively used by pedestrians. The effective walkway width at a given point along the walkway is computed as follows: Fig. 2 A Self-Organizing Map (SOM) Neural Network 4METHODOLOGY Off-street pedestrian facility serves only non-motorized traffic and is separated from motor vehicle traffic to the extent that such traffic does not affect their quality of service. There are different categories of exclusive pedestrian facilities: walkways, crossflow areas, queuing area, underpass, overpass, stairways etc. The LOS thresholds for each category are different, but all are based on the concept of space per pedestrian, which is a measure of pedestrian comfort and mobility. The HCM 2010 methodology for determining PLOS categories is followed in this study. Following are the steps shown in Fig. 3 taken to determine the LOS of exclusive offstreet walkways pedestrian facilities. 8 WE = Wr – WO ... (1) where, WE =effective walkway width, Wr = total walkway width at a given point along walkway, and WO =sum of fixed-object effective widths and linear feature shy distances at a given point along walkway. Step: 2 Calculation Rate of Pedestrian Flow An hourly pedestrian demand is used as an input to the analysis. Consistent with the general analysis procedures used throughout the HCM, hourly demand is usually converted into peak 15 min flows, so that LOS is based on the busiest 15 consecutive minutes during an hour: ... (2) where, V15 =pedestrian flow rate during peak 15 min (p/h), Vh = pedestrian demand during analysis hour (p/h), and PHF = peak hour factor. However, if peak-15min pedestrian volumes are available, the highest 15-min volume can be used directly without the application of a peak hour factor. Next, the peak 15-min flow is converted into a unit flow rate (pedestrians per second per meter of effective path width): ... (3) Where, VP is pedestrian flow per unit width measured by pedestrian /meter/second (p/m/sec) and all other variables are as previously defined. Step: 3 Calculation of Average Pedestrian Space The service measure for walkways is pedestrian space, the inverse of density. Pedestrian space can be directly observed in the field by measuring a sample area of the facility and determining the maximum number of pedestrians at a given time in that area. The pedestrian unit flow rate is related to pedestrian space and speed: ... (4) where, AP = pedestrian space (meter2/pedestrian (m2/p), Sp = pedestrian speed (meter/second (m/sec)), and Vp = pedestrian flow per unit width (p/m/sec). Volume to Capacity ratio (v/c) Calculation For determination of PLOS category of off-street pedestrian facility volume to capacity (v/c) ratio is one of the most important factor. For this study pedestrian hourly volume can be found out from video data collection and capacity of side-walks has been taken from IRC:103. Here width of side-walk for 1.5 m, 2 m, 2.5 m, 3 m and 4 m capacities in number of INDIAN HIGHWAYS, April 2015 TECHNICAL PAPERS persons per hour in both directions are 800, 1600, 2400, 3200 and 4000 respectively. Step: 4 Determine Pedestrian Level of Service (PLOS) PLOS categories are to be resolute on the basis of average pedestrian space (Ap). Six no of PLOS designated as “A” to “F” has to determine for offstreet pedestrian facilities. Not only on the basis of average space, other related measures like flow rate, average space and volume by capacity ratio are also considered for categorisation of PLOS. 5SOM CLUSTER ANALYSIS AND VALIDATION MEASURE 5.1SOM Cluster Analysis Among various types of ANN algorithms, in this study SelfOrganizing Map is used for clustering of speed data because of its inherent capability to learn the pattern of input. SOM is trained iteratively being inspired by neural networks in the brain. Self-Organization Map (SOM) uses a competition and cooperation mechanism to achieve unsupervised learning. In SOM, a set of nodes is arranged in a geometric pattern which is typically a 2-dimensional lattice. In the basic SOM algorithm, the neurons are connected to adjacent neurons by neighbourhood relation. This dictates the topology, or structure of the map and the arrangement of neuron may be grid, hexagonal or random topology. Usually the neurons are connected to each other via rectangular or hexagonal topology. One can also define a distance between the map units according to their topology relation. The topological relation may be rectangular or hexagon, it should be fixed from beginning. In this research Hexagonal topology is used. Each node is associated with a weight vector with the same dimension as the input space. INDIAN HIGHWAYS, April 2015 The purpose of the SOM is to find a good mapping. During training, each node is presented to the map so also the input data associated with it. An input weight vector of same dimension as that of input data dimension was given to the ANN. The clustering using SOM algorithm was done in two steps. Step: 1 The input data is compared with all the input weight vectors mi(t) and the Best Matching Unit (BMU) on the map is identified. The BMU is the node having the lowest Euclidean distance with respect to the input pattern x(t). The final topological organization of the map is heavily influenced by this distance. BMU mc(t) is identified by: For ... (5) Step: 2 Weight vectors of BMU are updated as .. (6) Here hb(x) is the function, which is neighbourhood ... (7) Where 0 < α(t) < 1 is the learning rate factor which decreases with each iteration. ri and rb(x) are the locations of neuron in the input lattice. α(t) defines the width of the neighbourhood function. The above two steps were repeated iteratively till the pattern in input was processed. 5.2 Validation Measure Cluster validity is concerned with checking the quality of clustering results. It has been mainly used to evaluate and compare whole partitions, resulting from different algorithms or resulting from the same algorithms under different parameters. Common application of cluster validation measure is to determine the correct number of cluster for a set of data (Bensaid et al., 1996). Different validity measures have been proposed in the literature, none of them is perfect by oneself, and therefore several indices are used in this study, such as: Silhouette Index, Davies-Bouldin Index, Calinski-Harabasz Index, Dunn Index, Krzanowski-Lai Index, Weighted inter-intra Index. A.Silhouette Index (SI) This index was proposed by Rousseeuw (1987) to evaluate clustering results. Silhouette width is a composite index which reflects the compactness and separation of the clusters. For each data point i the Silhouette width is calculated as follows: ... (8) Where a(i) is the average distance of a data point I to other data point in the same cluster, b(i) is the average distance of the that particular data point to all the data points belonging to the nearest cluster. The average s (i) of all data points reflects the quality of clustering result. Larger silhouette value signifies good cluster. B. Davies-Bouldin Index (DBI) This index is a function of the ratio of the sum of within-cluster scatter to between-cluster separation. This DB index is defined by (Davies and Bouldin, 1979): ... (9) Here Dc and dce are intra-cluster and inter-cluster distances respectively. The intra cluster distances are calculated by average of pair wise distances from points in the cluster to the cluster centroid. The inter cluster distance between two cluster is computed as the distance between their centroids. Xa any chosen arbitrary data that belongs 9 TECHNICAL PAPERS to cluster i. Ni is number of data that belong to cluster i. Ci and Cj cluster centre of I and j cluster. So, when the cluster is compact and far from each other the ratio is small. Consequently Davies-Bouldin index is small for good cluster. Dimitriadou et al. (2002) found that optimal numbers of cluster for a data set is the number of cluster for which the Davies-Bouldin index (DBI) value is the lowest. C. Calinski-Harabasz Index (CHI) Calinski-Harabasz (1974) suggested the index for cluster validation purpose. This index uses the quotient between the intra-cluster average squared distance and inter-cluster average squared distance. E. Krzanowski-Lai Index (KI) The index of Krzanowski and Lai (KLI) is defined as (Krzanowski and Lai, 1985): ... (12) Where, And p denotes the number of features in the data set, c denotes the number of clusters and c ≥ 2, W (c) denotes the within cluster sum of square of the partition. Dudoit et al. (2002) suggested that the highest value of Krzanowski-Lai index (KLI) gives the optimal number of cluster for a given data set. F. Weighted inter-intra Index (WI) This index tries to find the optimal number of cluster φ(Q) by high overall quality of cluster and a small number of cluster k. The quality of cluster is determined as follow: ... (13) Where ... (10) Here n is total number of input data points. c is number of cluster. nk is number of data points in cluster k (k = 1,2,…c), and Xi and are observation vectors for input data I and the centroid for group k, respectively. This parameter was found to be the best global statistic criterion in cluster evaluation by Milligan and Cooper (1985). D. Dunn Index (DI) The index was formulated by Dunn (1974) in order to check the quality of cluster resulted from a clustering algorithm. The equation is defined by: (11) Here d(ci,cj) is the dissimilarity function between two clusters ci and cj defined as d(ci, cj) = and diam(c) is the diameter of a cluster which is the measure of dispersion of the clusters. The diam(c) of the cluster can be defined as follows. 10 ... (14) And Here i and j are cluster indices Xa and Xb are two vertices. 6STUDY CORRIDORS AND DATA COLLECTION A century of industrialization and technical advancement has brought forth rapid urbanization in India. Statistics on census of India 2011 reveals that about 377 million of the total 1.21 billion population of India lives in urban areas. As per the census Odisha is having 41 million populations, that is 3.14 percent of population of India and the population is closest to country Argentina. However, decadal growth in the urban population of the State, during the last decade (2001-2011) has been enormous with a growth rate of about 26.80 percent, which is nearly that of national growth rate of 31.80 percent. It is noteworthy that the state’s population during the last decade has grown by about 13.97 percent while that of the urban population has grown at almost at double this rate. ... (15) Two important mid-size cities Bhubaneswar and Rourkela of Odisha state, India are taken up in the present study. Sampled area sees heavy foot traffic, because of sidewalks on the streets and transit points. Another feature of the selected area is the great variety of land uses: residential, commercial, office and institutional (e.g., school, hospital). Often, commuters need to walk at least a short distance to reach their final destinations. Bhubaneswar and Rourkela has straight, wide streets, unlike the narrow, winding, ancient streets found in most Indian cities and also the edge of the sidewalks are having sufficient distance from the window shopping, so that pedestrian don’t have to face problem for that. Streets are arranged in a grid, meeting at signalized intersections that are installed with pedestrian crosswalks. In the surveyed area, almost all the streets have sidewalks on both sides and crosswalks at intersections. INDIAN HIGHWAYS, April 2015 TECHNICAL PAPERS Bhubaneswar, the temple city enjoys excellent connectivity with other adjoining regions of strategic importance - however, the passenger transit option needs improvement of greater interaction. Bhubaneswar is primarily an administrative city and a tourism city. Bhubaneswar has emerged as a fast-growing, important trading and commercial hub in the state and eastern India. Tourism is a major industry, attracting about 1.5 million tourists in 2011. Bhubaneswar was designed to be a largely residential city with outlying industrial areas. The economy had few major players until the 1990s and was dominated by retail and small-scale manufacturing. There exists a significant level of disparity within this region in terms of accessibility to major urban centres. At intra urban level, incapacity of the existing traffic and transportation network will create a serious constraint to its future growth. The traffic demand management will play a key role as the role of supply management is near exhaustion. On the other hand Bhubaneswar enjoys a variable level of mobility at different parts of the city. Rourkela, the site for this study is commonly known as the steel city in all over world is one of the largest city located at northern west of the Odisha state. It is situated at the heart of mineral belt .The correct selection of sample sites is an important issue in designing the field survey. In reality, selection of a proper site is not an easy task because different routes need to appear in different LOS conditions to examine the influence of LOS on pedestrian route choice. Sampled area sees heavy foot traffic, because of sidewalks on the streets and transit points. Riders of public transportation (subway, bus, train) usually walk from transit points to their destinations. Another feature of the selected area is the great variety of land uses: residential, commercial, office and institutional (e.g., school, hospital). Often, commuters need to walk at INDIAN HIGHWAYS, April 2015 least a short distance to reach their final destinations. Bhubaneswar and Rourkela has straight, wide streets, unlike the narrow, winding, ancient streets found in most Indian cities. Almost all the streets have sidewalks that are separated from the carriageway by small trees and curbs. Since bicycle lanes have not been established in cities cyclists also use these sidewalks. Streets are arranged in a grid, meeting at signalized intersections that are installed with pedestrian crosswalks. In the surveyed area, almost all the streets have sidewalks on both sides and crosswalks at intersections. Study corridors for the study area are presented in Fig. 4. (a) Bhubaneswar Study Corridors (b) Rourkela Study Corridors Fig. 4 Map Showing the Road Corridors of the Study Areas Increasingly, researchers are using video camera to observe and collect data about pedestrians. Video data has plenty of advantages over direct observation: one can collect data from the video carefully back in the office or lab, can easily share video with others to illustrate a point, and there are tools available to automate data collection. High resolution video camera was fixed to the side of the foot-path that is the pedestrian off-street facilities with the help of a tripod stand. Always a length of 4m has been marked to observe the flow of pedestrian. However the start and end point of the stretch having four meter length of the footpath helped in determining the speed of the pedestrian. 11 TECHNICAL PAPERS Pedestrian speed and attributes on road features data were collected on a sample of 3,764 pedestrians observed at various sidewalk locations in both of the cities about 62 days in both peak and off-peak hours of working and non-working days. This shows that a large size data set is used for the development of LOS categories in this study. The speed of each pedestrian is recorded by using stopwatch. With the help of stopwatch pedestrian crossing time from the starting point to the end point of the observed portion of the off-street segment was recorded. From which pedestrian speed per meter is calculated and average speed of pedestrian for each segment is taken for further calculation. It is assumed that the average speed of pedestrians on the observed section of the facility represents the average speed of the street segment as a whole. In the same locations, over the same time period, all pedestrians were counted in order to determine sidewalk flow rates, and basic information about each of the 31 station points was recorded. Then the videos loaded to computer to play the recorded videos. Manually the pedestrian peak volume and flow rate were calculated from video data. It is observed that in these two cities pedestrian flow and density are comparatively lower because population sizes of these two cities are less than a million and also mobility due to commercial activities is comparatively lower. Based on these sets of data, two databases were built: a database containing speed and an aggregate database of each of the study locations. This aggregated locational database includes the calculated flow rate based on the count at the location, the effective width of the sidewalk, and land use proportions based on two cities. Effective walkway width is the portion of a walkway that can be used effectively by pedestrians. Various types of obstructions such as trees, electric poles, information sign boards, 12 projections of road side shops and linear features, reduce the walkway area that could have effectively used by pedestrians. Value of validation parameters were obtained for 2 to 7 number of cluster and were plotted in Fig. 5 and the validation indices are shown in Table 1. Bolshakova et al. (2005) shows that the largest silhouette value indicates a better quality of clustering result. Fig. 5(a) shows that the index value is largest for 6 number of cluster. Also Bolshakova et al. (2005) says that for Davies-Bouldin (DB) a low value indicates the optimum number of cluster. From the Fig. 5(b) it is observed that index value is minimum for 6 number of cluster. Dudoit et al. (2002) and Bolshakova et al. (2005) found that the maximum value of Calinski-Harabasz Index, Dunn Index and Krzanowski-Lai Index represents the optimum number of cluster respectively. Fig. 5(c) and 5(e) shows that the optimum number of cluster for Calinski-Harabasz Index and Krzanowski-Lai Index are 7 and 3 respectively whereas from Fig. 5(d), for Dunn index 6 is the optimum number of cluster. 7RESULTS AND ANALYSIS The average pedestrian space data acquired through Video Camera was clustered using SOM algorithm of ANN. For determination of the parametric values of validation measures, average pedestrian space data and cluster ranges found from ANN analysis were used. In this research six validation parameters were used. These six number of validation parameters were used to know the optimum number of clusters for these four parameters used; for example data set of average pedestrian space is explained in detail in this study. By knowing the optimum number of clusters we can classify the urban off-street pedestrian facilities into that number of LOS categories. It is always considered that lesser number of clusters is better if variation in validation parameters is minimal. a) Silhouette Index vs Number of Cluster b) Davies-Bouldin Index vs Number of Cluster c) Calinski-Harabasz Index vs Number of Cluster d) Dunn Index vs Number of Cluster e) Krzanowski-Lai Index vs Number of Cluster f) Weighted inter/intra Index vs Number of Cluster Fig. 5 Validation Measures for Optimal Number of Cluster using SOM Clustering INDIAN HIGHWAYS, April 2015 TECHNICAL PAPERS Table 1 Numerical Values of Cluster Validation Measures using SOM Clustering NC SI DBI CHI DI KI WI 2 0.0007 0.0005 0.4006 0.0035 0.0036 0.0006 3 0.0006 0.0005 0.5167 0.0033 0.0285 0.0006 4 0.0006 0.0004 0.4771 0.002 0 0.0006 5 0.0006 0.0005 0.7385 0.0033 0.0005 0.0006 6 0.00071 0.0003 0.2908 0.0038 0.0008 0.0007 7 0.0007 0.0004 1.211 0.0016 0.0008 0.0006 Here, NC = Number of Cluster SI = Silhouette Index DBI = Davies-Bouldin Index CHI = Calinski-Harabasz Index DI = Dunn Index KI = Krzanowski-Lai Index WI = Weighted inter/intra Index Again Dudoit et al. (2002) found that for Weighted inter/intra Index the first down –tick of the index during searching forward is the optimal number of cluster. In Fig. 5(f) it occurs at 6 number of cluster. Out of six validation parameter considered in this study four parameters give the optimal cluster value as 6 which are also same as suggested by HCM (2010). Also it is observed that the other parameters or measure of effectiveness (MOE) that is pedestrian flow, speed and volume to capacity (v/c) ratio considered to define ranges of LOS categories also satisfies classification LOS into six categories. That is the reason for which in this research the urban off-street pedestrian facilities are classified into six categories using the SOM in ANN. After getting the optimum number of clusters as six all the parameters that are the average pedestrian space, speed, flow and v/c ratio data acquired through video data collection was clustered using the SOM algorithm. The different ranges of the parameters are given in different symbols, also the legends in Fig. 6 (a-d) gives the ranges. All the clustered ranges of PLOS categories for off-street pedestrian facilities are shown in Fig. 6 and Table 2. (A) Average Pedestrian Space of PLOS Categories (B) Flow rate of PLOS Categories (C) AverageTravel Speed of PLOS Categories (D) v/c ratio of PLOS categories Fig. 6 PLOS Categories of Urban Off-Street Pedestrian Facilities using SOM Clustering on Various Parameters INDIAN HIGHWAYS, April 2015 13 TECHNICAL PAPERS Table 2 PLOS Categories for Urban Off-Street Pedestrian Facilities using SOM Clustering LOS Average Space (m2/p) Related Measures Comments Flow Rate (p/sec/m) Average Speed (m/sec) v/c ratio A >15.67 ≤0.063 >1.22 ≤0.4 Ability to move in desired path, no need to alter movements B >11.9415.67 >0.063-0.081 >1.11-1.22 >0.4-0.53 Occasional need to adjust path to avoid conflicts C >9.07-11.94 >0.081-0.103 >0.95-1.11 >0.53-0.68 Frequent need to adjust path to avoid conflicts D >6.49-9.07 >0.103-0.133 >0.78-0.95 >0.68-0.84 Speed and ability to pass slower pedestrians restricted E >4.48-6.49 >0.133-0.145 >0.62-0.78 >0.84-1.00 Speed restricted, very limited ability to pass slower pedestrians F ≤4.48 >0.145 ≤0.62 From SOM cluster analysis it is found that for PLOS “A” average pedestrian space is greater than 15.67 m2/p and for PLOS “F” it is less than 4.48 m2/p. Pedestrians will face frequent contact with other users and speed is restricted when flow rate is greater than 0.145 p/sec/m and at that time volume to capacity ratio is at extreme level i.e. near about 1. Whereas pedestrians can move at their desired speed at less than 0.064 p/sec/m flow rate and less than 0.4 volume to capacity ratio. This occurs in PLOS “A” condition and here pedestrians move at near about 1.22 m/sec speed. In PLOS “F” speed is about 0.62 m/sec, where it is difficult to walk for a pedestrian. Applying this method it is found that all the ranges for urban off-street pedestrian facilities for six PLOS categories are significantly different from those values mentioned in HCM 2010. In this study, these two cities are having less than a million populations, for which pedestrian movement is comparatively low than the highly populated metropolitan cities. In Indian cities highly heterogeneous traffic flow on the main carriageway occasionally influence the pedestrian’s movement on off-street facilities. Due to poor enforcement of laws for traffic on main carriageways 14 >1 Speed severely restricted, frequent contact with other users as well as the off-street pedestrian facilities, a haphazard movement is perceived. Also it has been observed that inadequate road infrastructures lead to varying geometry conditions creates unwanted confusion to the users. Besides, some of the pedestrian facilities are unauthorized occupied by vendors for their commercial use and installation of advertisements boards. In some cases unplanned utilities such as electric and telephone poles become a natural obstruction to the pedestrian movements on the path. Illegal parking on off-street facilities becomes a common phenomenon for which the pedestrian has to forcefully reduce its speed and divert the direction of movement. For these reasons PLOS ranges in Indian cities are different from other developed countries. In India, social and cultural inheritance is also different as people love to move in platoons, which has a broad effect on off-street movements. Also the physical size of Indian population is also another contributing factor for which the PLOS categories in this study are different from the values described in HCM. 8 CONCLUSION Over the years, PLOS methods have been developed in a variety of ways for different walking environments and it has been suggested for substantial improvements in the analysis procedures. Majority of these methods and models have been developed by combining models that have been applied to other choice contexts and, as a result, are not suited to universal applications. Various models available are suitable for homogenous traffic flow condition as seen in developed countries. From the background studies it is found that HCM (2010) methodology for the prediction of PLOS can be used for Indian context after due modifications. Hence the PLOS methodology developed in HCM (2010) is adopted in this study. SOM clustering method is used to define PLOS criteria. Different LOS values based on pedestrian space, flow rate, speed of pedestrian and volume to capacity (v/c) ratio are defined from clustering analysis method which gives numeric ranges for LOS categories. From this study it is observed that pedestrian data collection using video cameras is a very simple and accurate procedure. SOM clustering is highly efficient in terms of time saving and provides a very accurate solution to this kind of classification problem. By using SOM cluster analysis, ranges of parameters for six pedestrian levels INDIAN HIGHWAYS, April 2015 TECHNICAL PAPERS of service categories i.e. A, B, C, D, E and F are defined for off-street walking facility in Indian context; where LOS “A” represents the best operating conditions and LOS “F” the worst. The PLOS ranges defined in this study are significantly different from that mentioned in HCM (2010) because of highly heterogeneous traffic flow on main carriageway, poor enforcement of traffic laws, varying road geometry, unauthorized vendors activities, unwanted obstructions from utilities, and illegal parking on offstreet facilities. Considering the local condition, data collection method using video cameras and SOM in ANN clustering techniques can be applied in other countries to define the PLOS categories. One limitation to the application of SOM in ANN cluster analysis is that it require large INDIAN HIGHWAYS, April 2015 amount of data set for which is cumbersome. The relationships among the variables at each step of the methodology followed in this study are empirical only. Hence this methodology can be applied to define the PLOS ranges irrespective of city size or population size. In the populated cities of population more than million are having large commercial, industrial, educational and residential activities, which give rises to heavy pedestrian activities. The method followed in this study can be applied to define the PLOS ranges for off-street pedestrian facilities for populated cities as the ranges defined in this study are different; hence similar studies can be carried out for other bigger cities having population size more than a million to develop comprehensive PLOS criteria. References 1. 2. 3. 4. 5. Al-Garni, S., Abdennour, A. (2008). “A Neural Network Based Traffic Flow Evaluation System for Highways.” Journal of King Saud University of Engineering Sciences, 20(1), 37-46. Highway Capacity Manual. Transportation Research Board, 1965, Washington, D.C. IRC. (2012). Guidelines for Pedestrian Facilities, IRC:103, New Delhi. Laxman, K.K., Rastogi, R., Chandra, S. (2010) Pedestrian Flow Characteristics in Mixed Traffic Conditions. Journal of Urban Planning and Development, American Society of Civil Engineers, 136(1), 23-33. Smith, A.L. (2009), Contribution of Perceptions in Analysis of Walking Behavior. Transportation Research Board, Washington, D.C., pp. 128–136. 15 Eco-friendly Mulching – Enhancing Road Safety and its Aesthetics through Value Engineering Bhavesh Kantilal Thakkar* ABSTRACT Not only in Construction Phase of Road Projects, but even in Operation & Maintenance (O&M) Phase also, there is a need to adopt Value Engineering approach in achieving Green objectives. However many a times these aspects during O & M Phase are overlooked. Value Engineering Process needs to be practiced for maintaining the standards of Quality and Reliability with reduced Costs in every phase of Activities for which Kaizen approach could be successfully adopted. Study was undertaken at 100 km Road Project constructed on Build Operate Transfer (Annuity Model) in Andhra Pradesh by Gammon India Limited. Untapped Mulching Technique in Road Works was explored to convert one of the easily available nearby waste Materials (i.e. Paddy grass) into Green Resource to enhance aesthetics of Highways besides improving Safety to Commuters by virtue of better growth to Road Plantations and reduction in glaring effect especially in Medians. The Qualitative and Quantitative benefits attained using these approaches are: ● Growth of plant : 3 times ● Foliage Coverage : 2 times ● Savings in water consumption : 52% ● Reduction in Weed Growth : substantial Thus, Eco-friendly Mulching Technology is aimed to preserve Natural Environment by going Green apart from reducing costs by 10 – 12%. 1INTRODUCTION Value Engineering approach can be used to achieve one or more benefits like optimizing Project Life Cycle Costs, saving time, Increasing Profits, Expanding Market Share, solving Problems and/or using resources more effectively. Some of the approaches for Continual Improvement can be through various processes as listed below: ● Innovation of methodology by rebuilding a new Technology ● Continuous slow Improvements from the existing process ● Reverse Engineering in the usage of alternate or similar materials for intended use; ● Lean Concepts Innovative Eco-friendly concept of Mulching never attempted in Gammon of its existence and also found no records in either Internet or any records of its application elsewhere while developing Road Works in India is used as Value Engineering concept to especially reduce the Cost of Operation and Maintenance of Median Plantation on National Highways Fundamentals of Value Engineering Resources are measured in terms of summation Material, Labor, Price, Time etc. required to accomplish the function in its Project Life Cycle. 2.1 Value It is defined as fair return or equivalent in Goods, Money or Services for something exchanged. It can be commonly represented by the relationship as below: Value ≈ Functions/Resources Where Function is measured by the Performance requirement of the Customer in terms of summation of its functionality, Performance and Quality of its Deliverables. 2.2 Application of Value Engineering Concepts Value Engineering can improve Decision Making that leads to optimal expenditure of Owner funds while meeting required function and Quality level. Hence, the timing of the application of Value Engineering concepts is critical to determine the results of its benefits to the Project which can be graphically represented as below: besides preserving Environment using Kaizen Approach. 2 Graph 1 Pictorial Representation of Value Engineering Benefits * Dy. Manager, Gammon India Limited, E-mail: [email protected] 16 INDIAN HIGHWAYS, April 2015 TECHNICAL PAPERS The above graph clearly enunciates the following: ● The Value Engineering benefits attained are very high when conceived during the Initial Stages of Project Construction where the Cost to Change is very low. ● In case of O & M Phase of Project Life Cycle, Cost to Change is not that significant but potential savings continue to rise with the passage of time if pursued. 2.3Tools and Techniques The success of Value Engineering is due to the ability to identify the opportunities to remove unnecessary costs while assuring the other factors as listed above. The basic approach to improvement in Quality Parameters can not only be through Proprietary approaches like ISO, principles recommended by Deming, Juran, Cros by and others but also from Non Proprietary Approaches such as TQM, Six Sigma, FMEA, Voice of Customer, Cost of Quality and also through Continual Improvement. Tools for Continual Improvement are 2.3.1Functional Analysis System Technique (FAST) Diagram The FAST model has a horizontal directional orientation described as the HOW-WHY dimension. This dimension is described in this manner because HOW and WHY questions are asked to structure the logic of the system’s functions. Starting with a function, we ask HOW that function is performed to develop a more specific approach. This line of questioning and thinking is read from left to right. To abstract the problem to a higher level, we ask WHY that function is performed. This line of logic is read from right to left. Graph 2 Pictorial Representation of FAST Methodology 2.3.2Creative Thinking The creativity thinking is adopted through various Group Creativity Techniques like Brainstorming, Idea/Mind Mapping, Affinity Diagram, Nominal Group and Delphi Techniques on any process execution or Improvement works. 2.3.3Life Cycle Costing The sum of all recurring and one time (non-recurring) costs over the full life INDIAN HIGHWAYS, April 2015 span or a specified period of good, service, structure or system. It also includes Purchase Price, Installation Cost, Operation Cost, Maintenance and upgrade costs, and remaining salvage value at the end of the Ownership or its useful life. 2.3.4Analytical Hierarchy Process (Weighing Score Technique) It provides a comprehensive and rational framework for structuring a decision problem, for representing and quantifying its elements, for relating those elements to overall goals, and for evaluating alternative solutions. 2.3.5Kaizen Costing Life cycle costing anticipates cost improvements during the Project Life Cycle well as recognizing the importance of the design stage. This is sometimes referred to as Kaizen costing. Kaizen costing, unlike Target Costing, is not accompanied by a set of techniques or procedures that are automatically applied to achieve cost reductions. Workers are given the responsibility of improving the processes and reducing costs. 3Project Brief on Median Plantations 100 km of 4 Lane divided carriageway was executed by Gammon – Punj Lloyd JV in BOT Annuity Model for National Highways Authority of India which achieved Commercial Operations in Oct 2004. Presently, it is in ninth year of Operations and one of maintenance activities is to Enhance Safety measures, prevent Weeds, improve aesthetics besides periodic Overlay works and other routine Maintenance activities. Graph 3 Relationships Between Target Price, Profit and Cost 17 TECHNICAL PAPERS Approximately 57 km of Total length of 100 km is encompassed by Median Plantations on a 4-lane divided Carriageway from Rajahmundry to Tuni on NH 16 in the state of Andhra Pradesh. The quantitative details of the Project are tabulated as below: ● ● ● Table 1 Median Plantation Details in the Project S. No. Package Identification Plants in Nos Approx. Length of Corridor 1. Rajahmundry Expressway Ltd (Contract Package : AP 15) 12,024 21.75 km 2. Andhra Expressway Limited (Contract Package : AP 16) 16,326 35.00 km Grand Total 3.1 Deliverables to Customer at any Point of Time ● No Weed growth should be visible ● Foliage of Plant should cover the entire median ● Height of the Median Plants restricted to max 2.0 m 3.2Present Methodology of Execution Conventional system of using Water tankers of 10 KL Capacity are deployed daily (4 Nos) to water the plants for the entire stretch which used to make 3 trips per day/ per tanker and regular labor are deployed for cleaning the basin and removal of Weeds periodically, every 2-3 months to ensure the deliverables as mentioned in the above paragraph. 4Selection of Process Improvement Methodology Considering the balance Concession period of six years only, Process Improvement through completely new innovation was out of reach. The activity being related to Environment Oriented, Reverse Engineering cannot be implemented. The Project is already in Lean Management and further optimization was not possible and therefore, the only option left out for process Improvement was Kaizen Approach. 18 ● ● ● ● Decreases water loss due to evaporation; Works against the Weeds; Protects the roots from drying and temperature Extremes; Adds organic matter to the soil; Adds Nutrient to the soil; Feeds soil life and improve soil structure; 56.75 km 4.1Method Approach Kaizen approach brings small improvements at a time and participation of team members is the key element for its success. ● Project Team was enthusiastic on change process and PM had a buy-in from team Members and the Independent Engineer to undertake the Experiment; ● Team was given the task of Brainstorming the Ideas for alternative and better performance in terms of the Job requirements; ● During Brainstorming Exercise, Drip Irrigation and Exploiting Mulching were identified and Drip Irrigation was eliminated by using analytical hierarchy process and Mulching was selected as Process Design to test the performance of the Median Plantations; ● Team studied the results of Mulching in various landscaping activities of Hotels and other farming activities. 5 What is Mulching? It is a simple protective layer to cover the soil from the top by Organic or Inorganic Materials to improve the soil conditions and crop plants generally by Farmers. 5.1 Benefits of Mulching ● Helps in preventing the soil erosion; Picture 1 5.2 Different Type of Mulch Material which are Available that Includes ● Grass Clippings ● Straw ● Bark chips ● Stones ● Brick chips ● Plastic But Unfortunately, Mulch, being generally treated as green waste, by majority people to get rid of it but folks understands the value when this is treated as green resource. As it is known fact, Organic Material gets decomposes and it needs to be replaced at certain period depending on the type of material. The below table shows the various details like its availability on Earth, its anticipated life and its major benefits which will give the Professional, a ready reference to evolve the suitable design by constrained optimization techniques. INDIAN HIGHWAYS, April 2015 TECHNICAL PAPERS Graph 4 Details of Mulching Materials 6Broadly How Mulching Links to Process Improvement ofMedian Plantation Table 2 Comparison of Mulching Benefits vis-à-vis its Application Material Benefits Application in our Project Prevents the Soil Erosion Water requirement will be reduced and deployment of Water Tanker can reduce Decrease water loss in evaporation and decrease in OH and HSD expenditure (Eco friendly measures) Works against the weeds Reduced Labor for jungle clearance towards weeds removal will help in Protects from drying and optimizing the work force for other temperature in extreme conditions activities Adds Organic and Nutrients to soil, Early growth of plants will enhance if organic material used Aesthetics and reduce glaring effects Improve Soil Structure India, presently on mega Infrastructure platform, for developing Road Network across different corners is stressing on continual improvement process for sustaining Road Aesthetics and Improvement of Safety to the Commuters and Mulching is evolving into one of the Process Alternative at an reduced cost specifically to the Performing Organization which in turn will benefit Customer and Project Sponsor. INDIAN HIGHWAYS, April 2015 7Mulching Implementation at Site as Trial Experiment One km length of Stretch is considered for implementation of Mulch as Process Improvement Initiative to compare the Performance in the areas of Non-Mulch areas for understanding the Moisture Retention and Growth of Plants and its foliage as per the Methodology furnish below: 7.1Understanding Moisture Retention ● Form the basin at the girth of at least 0.75 m diameter; ● Clear the entire weeds existing in the basin; ● Apply Mulch 3-4” thick in the basin and in our case, we have considered as Straw (Paddy Grass) as easily available local material; ● Record the Moisture content @ 500 mm depth below the basin to know the present status of the Plant which was 5% in our case ● Apply Water to Plants in both the categories as per the Conventional practice; ● Monitor and Note the Moisture Content (@ 500 mm below the basin) twice a day at the fixed times to under the Retention Rate of the Soil ● Similarly, Monitor and Record the Temperature at the basin to understand the Evaporation rate of the Soil ● Apply the Water in the Mulch Areas only when the Moisture content attains 5%; ● Record the Readings for every cycle and determine the Retention Rate and Evaporation rate; 7.2 Understanding Plant Growth Selected 6 Plants of Big and Small Plants in both Categories were measured initially in terms of its Height, Girth, and Foliage Coverage; The above listed parameters were recorded at the end of the Experiment Cycle of one month and analyze the results in comparison to the Non Mulch Areas. The Pictorial Representation of Mulch Performance is shown below. 19 TECHNICAL PAPERS Picture 2 Experimental Results of Mulching in Site 8Experiment Results 8.1 The Results of Water Properties in terms of Moisture and Evaporation during one month of study in five cycles are tabulated below: Table 3 Test Results of Moisture Retention and Evaporation Observation 10 1. Moisture Retention and Evaporation Results Sl. No. Mulch Area Non Mulch Area Retention Loss Rate (Moisture Content/Hour Evaporation Rate (Moisture Content/ Deg C) Retention Loss Rate (Moisture Content/ Hour Evaporation Rate (Moisture Content/ Deg C) Cycle 1 0.045 0.36 0.090 0.72 Cycle 2 0.047 0.69 0.065 0.95 Cycle 3 0.038 0.42 0.053 0.58 Cycle 4 0.033 0.69 0.048 1.00 Cycle 5 0.046 0.46 0.063 0.63 Average 0.042 0.523 0.064 0.776 1.52 1.48 Variation Non Mulch Area requires 52% more of Water due to its direct exposure to Sun which also indicates evaporation is 9 Costing Parameters The Costing per plant per year for the maintenance of Median Plantations when being executed as per Conventional practice is around Rs.147/- per Plant as per the details as shown in Table 5. Incorporating the Experiment Results lead to the reduction of the following: ● Lower Consumption of Water resulting in reduction of Water Tanker by 1 No and corresponding Labor Helper: ● Fuel consumption reduced by 25% due to reduction of Water Tanker from 4 Nos to 3 Nos; ● Requirement of Periodical Labor for Weed Removal gets eliminated and on the other hand, Cost of Mulch has been added; With the above Methodology, the Revised Cost of Maintenance of Plant using Mulching works out to Rs.128/per Plant per year as per details tabulated as shown in Table 6. 2. 3. higher by 48% in Non Mulch Areas. 8.2 Plant Growth and its Foliage Growth rate are tabulated below: Table 4 Physical Growth Results of Plants Trend Results Area Type of Plant Mulch Big Non Mulch 20 Plant Growth Foliage/Canopy Rate (%) Coverage Rate (%) 2.01 4.5 small 0.86 NA Big 0.66 1.31 small 0.43 Conclusions 1) Growth rate is almost 3 times in Mulch zone than non culch zone 2) Canopy/Foliage increases almost by 2 times 3) Weed growth is substantially high 4. Conclusions Exploiting Mulching Technology (by converting the Waste) into Green Resource can yield around 12% reductions in Costs; Implementation of Mulching activity looks to be feasible and easily executable; The above Technology not only reduces costs but more importantly is contributing the Society (which is the Primary Responsibility of the Organization) by way of proper utilization of Scarce Resource Like Fuel and Water besides converting the Waste Material into Green Resource resulting in Preservation of Environment for a span of seven years to any project having around 50 odd km of 4 laning work; The Organization can have better Branding due to application of Go Green Initiatives; INDIAN HIGHWAYS, April 2015 TECHNICAL PAPERS 5. Small Improvement by using Straw will pave the way for the usage of Alternate Materials and subsequently can help in developing the Standard Operating Procedure by getting more inputs from other working Professionals across the Country. Table 5 Activity Based Costing of Median Plant using Conventional Methodology Item Description Hire Charges Water Tanker Charges Unit Qty Rate (Rs) Amount Equip. months 48 30,000 1,440,000 Lts 20,571 45 925,714 Kl 2,170 75 162,750 sqm 161,280 8 1,290,240 Man cays 1,460 200 292,000 4,110,704 Say 147/- HSD Consumption (50 kms/day*30 days* 12 months* 4 Nos)/3.5 Water charges (28000 Nos *50% free *20 Lts *365days/every 4th day Weed Removal (once in 2-3 months) Helper Grand Total Costing Per Plant 146.81 Table 6 Activity Based Costing of Median Plant using Mulch Technology Item Description Hire Charges Water Tanker Charges Unit Qty Rate Amount Equip. Months 36 30000 1,080,000 Lts 15,400 45 693,000 Remarks HSD Consumption (50 kms/day*30 days* 12 months* 4 Nos)/3.5 Water charges (28000 Nos *50% free *20 Lts *365/4 day) Kl 1,680 75 126,000 Mulch cost m 113,500 6.67 757,045 Man days 3,390 200 678,000 No 1,095 200 219,000 8,064 8 64,512 3,618,843 127.60 (2 times a year) (Rs. 5000/acre/1.5 tractor/500 m) Mulch Removal and Replacement Helper (man days) Weed removal (assumed 5%) Mulch prevent weeds Sq. m Total cost of Maintenance using Mulching Costing Per Plant 11 Acknowledgements The Author thanks PMI for giving the opportunity to present the paper. The Author also thanks entire team of Rajahmundry Site team comprising M/s. Bhagavan Raju, Kashinath, Apparao and other team members besides GIPL Management for facilitating this experimentation to give way for this new thought process. The Author also thanks Mr. M. U. Shah, member- BoM for his constant guidance and encouragement in submitting this paper. The Author also thanks Mr. E. Krishna Murthy, PMP and Mr. V. S. Pillai for their valuable INDIAN HIGHWAYS, April 2015 support to undertake this submission. The Author also thanks various authors shown in the references for providing their various valuable insights in their respective fields to culminate this overall innovation into possible new thought process of sustainable project execution. 4. References 5. 1. 2. 3. Project Management Institute, “A Guide to the Project Management Body of Knowledge”, Chapter 8, pp. 189-213. CTAHR, “Mulching for Healthier Landscape Plants”, Oct – 2007, L-3. MM Odendaal, thesis on the 6. Say Rs. 128/- Estimation and Management of Cost Over Life Cycle of Metallurgical Research Projects Submitted to University of Pretoria, Feb 2009. Giedrius Grondskis, Alfreda Sapkauskiene – Cost Accounting Information use for Product Mix Design, Eknomica IR Vadyaba, 2011:16. James R. Wixson, CVS, CMfgE, Function Analysis and Decomposition using Function Analysis Systems Technique. Hussein Ali Mohammed, University of Karbala, Role of Value Engineering in the Sustainable Construction Projects. 21 UTTARAKHAND DELUGE – MAN-MADE Er. W. Rahman* and Er. Akhilesh Kumar Gupta** ABSTRACT The upper Himalayan territories of Himachal Pradesh and Uttarakhand are full of forests and snow-covered mountains. They are home to several major and historic Hindu and Sikh pilgrimage sites besides several tourist spots and trekking trails. From 14 to 17 June 2013, the Indian state of Uttarakhand and adjoining areas received heavy rainfall, which was about 375 percent more than the benchmark rainfall during a normal monsoon, due to ecological imbalance, in the hills of Uttarakhand rainfall is becoming variable & unseasonal. This caused the melting of Chorabari Glacier at the height of 3800 metres, and eruption of the Mandakini River which led to heavy floods near Gobindghat, Kedar Dome, Rudraprayag district, Uttarakhand, Himachal Pradesh, Nepal and Northern India. Destruction of bridges and roads left about 100,000 pilgrims and tourists trapped in the valleys leading to three of the four Hindu Chota Char Dham pilgrimage sites. It is Man-Made factors, unscientific human interference with the youngest and fragile hills of Uttarakhand are responsible to a great extent, for the wreckage of Uttarakhand of June 2013. The incessant rain that hit Uttarakhand triggered flash floods and landslides, led to thousands of deaths, while thousands more missing. The Indian Air Force, the Indian Army, and paramilitary troops evacuated more than 110,000 people from the flood ravaged areas. The unplanned infrastructure development done in the past decade in the fragile hills of Uttarakhand, without taking in to consideration environmental aspects & ecological aspects i.e. unscientific way of roads and building constructions (heavy blasting), indiscriminating dynamiting& quarrying, felling of trees, and cutting of forest, power project build to next to each other on flood prone rives of Uttarakhand, and encroachment on river banks have totally damaged the hills of Uttarakhand resulting “Ecological Imbalance”, that led to uncontrolled flow of water in the flood prone rivers of Uttarakhand and heavy landslides, resulted to “Disaster Waiting to Happen". Until we find a vaccine for the two kinds of diseased developmental pragmatisms afflicting us – the rational and the rapacious, we might have to get used to such tragedies, as of the Uttarakhand Disaster June 2013. 1INTRODUCTION The Uttarakhand region has been target of intense development activities, since it was born on 9th November 2002. Bestowed with scenic beauty, bracing climate and excellent agro – climatic conditions, Uttarakhand is highly suitable for development of tourism, as well as have great potential for economic growth in development of agro – horticulture based economy, beside wild life, adventure or pilgrimage. Uttarakhand is very rich in natural resources too. Uttarakhand has a total area of 53,484 km2 of which 93% is mountainous and 64% is covered by forest. Most of the Uttarakhand part of the state is covered by high Himalayan peaks and glaciers. Two of India’s largest rivers, the Ganges and the Yamuna, originate in the glaciers of Uttarakhand. These two pilgrimage, Badrinath and Kedarnath form the Chota Char Dham lies in Uttarakhand. It is well know as the “Land of the Gods“. Uttarakhand is also well known for its “chhota char dham”: Kedarnath Temple Badrinath Temple Gangotri Temple Yamunotri Temple Kedarnath Temple *Ex-Chief Engineer UPPWD/Consultant, **Senior Vice President (Highways), ICT Pvt. Ltd., New Delhi. 22 INDIAN HIGHWAYS, April 2015 TECHNICAL PAPERS Badrinath Temple Several modes of transport are prevalent in our country, but unfortunately in hilly areas of Uttarakhand, because of the topography and other physical features, roads remains the only mode of transport for Uttarakhand people. The roads in hills not only provides the vital connection between the remotest Gangotri Temple corner of hill region, facilitating movement of goods and men , but also forms an important vehicle for social interaction and economic upliftment, bringing the backward people into the Nation’s mainstream. It goes without saying that good roads network is the pre-requisite for the social-economic development of Uttarakhand state. Existing Roads in Uttrakhand A View of Nanital Lake It is also a fact that good infrastructure development has taken place in Uttarakhand, in the past decade, or so, but unfortunately due care & INDIAN HIGHWAYS, April 2015 Panormic View of Nanital precautions had not been taken in the Himalayas region of Uttarakhand, being worlds, youngest mountain range, prone to landslides, floods, Yamunotri Temple folded and faulted. Hardly, any attention was given to environment & ecological consideration in the development plans of Uttarakhand. The concept of improvement without much degradation was missing. Indiscriminately dynamiting & quarrying, felling of trees, power projects built next to each other on Alaknanda & Bhagirathi Rivers – flood prone rivers. Encroachment on river banks, forest & dangerous slopes (hotels & restaurants), have damaged the hills of Uttarakhand. 2MAN AS THE AGENT OF CHANGE What took place in Uttarakhand on June 16th & 17th; 2013 was actually a tragedy waiting to happen, as Uttarakhand Himalayas region has seen unchecked construction activities, illegal & legal mining, unscientific way of road & building construction and, of course, hydropower projects built next to each other. In Kedarnath, large scale construction has been done on the land evacuated by glacier in the past few years. Unscientific human interference with the nature is responsible for the wreckage of Uttarakhand. In view of ecological imbalance in the hills of Uttarakhand, rainfall is also becoming variable and unseasonal. This is what happened in Uttarakhand on that fateful day June 16th, 2013, it rained without a break; some 200 mm came down within hours at few 23 TECHNICAL PAPERS places in Uttarakhand. Rain was also unseasonal; June is still not considered the beginning of the monsoon season in Uttarakhand, so pilgrims and tourists visiting the region were caught unaware. It brought down the mighty Himalayas. It is believed that in this period between June 16th & 17th 2013, large number of slides had occurred along the river valley of Mandakini, Mandaini, Kali and Madhya Maheshwar in Kedar Valley. What really compounded the disaster – made it truly man – made – is the scale of development intervention in the past decades or so. The mountain of Uttarakhand are bleeding and its NASA Satellite Imagery of Northern India on 17th June 2013, Showing Rainclouds that Led to the Disaster people have been left battered, bruised and dead. The images of building tumbling down like cardboard boxes in the ragging water of Bhagirathi, Mandakni and Alaknanda will stay with all of us for a long time. Numbers of villages wiped out, property damaged, road and bridges washed away and Hydropower projects damaged in the mountain state of Uttarakhand. So far as the estimates regarding the death toll in the calamity of Uttarakhand on June 16th - 17th 2013 is concerned nobody is quite certain. However, the figures are shockingly high. This is the deadly and painful cost of environment mismanagement. A View of Landslide Few Photographs of Kedar Valley after Uttarakhand Disaster June 2013 24 Several Environmentalists have described the death & damages of Uttarakhand of June 2013, as a Man – Made disaster. In other words we can say that a mixture of many lapses added to the severity of devastation in Uttarakhand in June 2013. The painful things which happen to us are not punishment of our misbehavior, nor are they part of God’s design. Tragedies are part of natural law, ecologically, it is Mother Nature’s balancing act. It is true that development of any infrastructure project in hilly areas in many ways goes in contradiction to conservation of nature and promotes encroachment upon echo system. To be honest, the infrastructure developments in hills, from the geological point of view are such that it can never be possible to eradicate them in totality. However, these problems could be minimized to the level of acceptability if proper & careful measures are taken from the stage of project conception. Mr. James Hutton, the founder of modern geology predicted more than 200 years ago that hills and mountains of Himalayas region of the present days are far from being everlasting and the surface of the land is made by nature to decay. Whereas his prophecy has largely come true, he certainly failed to realize that one day man himself will compound the problems and may even take it to the, point of no return. Memory is very short lived and we even forget the major catastrophe happened in the young & vulnerable Himalayas of Uttarakhand in the past. A few years ago before the new state of Uttarakhand was born, the Malpa rock avalanche tragedy of 18th August 1998, hit the newspaper headlines, as it instantly killed 220 people and wiped out the entire village of Malpa on the right bank of river kali in Kumaon region of Uttarakhand. INDIAN HIGHWAYS, April 2015 TECHNICAL PAPERS Photograph of Malpa Rock Avalanche One should not forget the severity of landslide problems in the youngest and vulnerable mountain range of Uttarakhand. The divesting debris flew in the year 1880 on the slopes of Sher-ka-danda in Nainital district of Uttarakhand. It was so swift that it traveled 1 km in 30 seconds, killed 150 people and swept away “Victory Hotel”, Naina Temple and other big buildings and filled part of the Naini Lake. A View of Nanital – Year 1880; Before and After Land Slide Hazard Now the Government of Uttarakhand shall have to rethink of the existing policies, regarding infrastructure development at Uttarakhand, unregulated urbanization, deforestation which triggers landslides and ill – planned development projects, which degrade the environment have to be stopped. Commercialization of pilgrimage routes with encroachment on the river banks, forest & dangerous slopes (Hotels & Restaurants) have to stopped and demolished if necessary. A numbers of hydropower projects on the Bhagirathi and Alaknanda rivers damaging hills and increasing the possibility of flashfloods have to be stopped. Tourists & Pilgrims entries are to be restricted. It is a wakeup call for Authorities of Uttarakhand to reconsider their infrastructure development model in the hilly areas of Uttarakhand to cater for the fragility & vulnerability of the region. Apart from the reduction in size and greenery of forests, instability of the hill sides in Uttarakhand, causing damages to property & lives has been reached to the INDIAN HIGHWAYS, April 2015 extent of disaster. It is a time to ensure that the infrastructure development in Uttarakhand blend with environment, facilitating its nourishment besides serving the people of the area. It cannot be anybody’s contention that Himalaya region of Uttarakhand must not see development. The question to consider is how it should develop, road constructions, building constructions and hydropower projects or local economics based on tourism, which do not work against nature. The way ahead is to give due respect to the vulnerability of the hilly region of Uttarakhand. A general awareness in the Engineering profession needs to be created, so that our environment is protected while planning of infrastructure development in Hilly areas of Uttarakhand. There is a need to understand that sustainable development is only possible by maintaining the ecological balance. It is the time to understand that drawing from the hill cannot be oneway process. The approach should be development activities in harmony with ecological balance, so as to promote the quality of life of hill people of Uttarakhand. Construction of roads in hills requires imaginative planning and methodical construction, adopting environmentally friendly construction techniques, environmentally friendly materials, and mechanized techniques. But when Engineers work against time, they may not even have the basic data on geological formation, topography, drainage pattern etc., and as a result, some of the hill roads begin. One should not forget that every kilometer of road when constructed in hills may bring about a stress relief equivalent to about 1-2 lakh tons of rock mass and if cuttings are not properly protected, as per the present practice of in discriminate dynamiting, the most fast & economical method of road construction, landslides and rock falls become imminent, adding additional of about 1,000 tone of land loss per km annually. At many major landslide locations, the debris clearance may well be of the order of 4000 – 5000 tons annually. The construction of hill roads, therefore, calls for a greater expertise. A little thought bestowed in the initial stages of planning, design & construction of hill roads will go a long way towards preservation of the environment. 3ECOLOGICAL CONSIDERATION IN DESIGN, CONSTRUCTION & MAINTENANCE OF HILLS ROADS IN UTTARAKHAND The construction of roads in Himalayan region of Uttarakhand calls for a greater expertise & skill by adopting the best engineering practice to have minimum effect on physical environment. The basic guiding principles in hill road construction should be improvement without much degradation, environmental friendly materials & environmental friendly constructions techniques are to be adopted. The hill road construction in 25 TECHNICAL PAPERS Uttarakhand by the normal & cheapest method by blasting operation needs to be avoided, as far as possible. However, if unavoidable well qualified and trained hands be entrusted with the task of designing and executing “controlled blasting”, as per prescribed specification, after taking due safety measures as prescribed in the code of practices. On one side execution of development plans are essential for the upliftment of backward areas of hilly regions of Uttarakhand, while on other side soil, vegetation and atmosphere has to be saved. It is vital to preserve various eco-systems which support human life. Every human activity effects the environment and environmental changes affect human life. Hill road development in Uttarakhand is a complex problem and all the activities involved in hill road construction are inter-related. Tackling each activity individually does not provide correct solutions; it should be taken as integrated system. Hill road construction is basically cutting a seat into natural hill face, the cutting can be either be full or part cut & part fill by doing so, the natural geo-physical setting is disturbed and problem of stability arise more often than not. The problem is more accentuated if the stratum met with, was already adversely placed from geological point of view. In Uttarakhand the Himalayan hills which are geologically quite young & fragile, highly folded and faulted, road construction is normally be set with large number of stability problems. It is therefore, necessary to properly investigate and design the hill slopes before execution of any hill road construction work in Uttarakhand, with the path breaking advance in space technology and remote sensing, it is possible to map landslides to a fair degree of accuracy. Thus, most landslide disaster in the hills of Uttarakhand could be averted by the 26 Engineers by taking timely appropriate action. Thus, careful & detail study of Stability of material slopes and control of landslides should be form an integral part of any hill road design & construction in the hilly regions Uttarakhand. Once the landslides problem is solved in the hills of Uttarakhand, no further loss of land, property & lives of the people will take place in the hills of Uttarakhand. No blockage/closure of Holy corridors in Uttarakhand will take place beside better transportation & communication will be available in the hilly region of Uttarakhand. In short, the performance of a hill road is directly proportional to degree of stability of slopes on which it has been built. Construction of the ropeways in Uttarakhand shall curtail the disturbance of the ecology. Viaducts and tunnel construction should be given preference in the Himalayan regions of Uttarakhand to have zero landslides & blockage problem. Suitably located and appropriately designed cross drainage work has to be provided in the entire length of the road so as to provide quick and efficient disposal of water to the valley side. Proper drainage not only reduces the weight of the mass tending to slide but also increases the strength of the slope-forming material. Mere provision of drains, culverts and drainage chutes does not help, if it is not ensured that the catchment would effectively feed them and the drainage system is firmly founded. Surface drains are to be located very carefully after detail study of the topography of the ground. As far as possible, cross drainage should be provided at right angles to the road. Environment assessment plays a very important part in the investigation for hill roads construction. It is necessary to identify, examine and evaluate all the natural and social environmental aspects so that they can be considered along with the Economic & Engineering factors and the broader planning issues during the initial development stage of the proposal for any road construction in the hilly regions of Uttarakhand. Plantation of new trees, herbs & vegetation should be done as much as possible on the exposed areas resulted from hill cutting operations, selection of proper types of plants & vegetation is necessary. The storm water should be properly intercepted and disposed of safely by providing interceptor drains, side drains & catch water drains should be provided at the right place. High velocity and falls in the cross drainage should be controlled by means of bed bars, check walls, water cushion and other energy dissipation devices so as to curtail down their scouring capacity. The present practice of preventing slope failure by, making random rubble masonry or dry masonry walls, sometimes with vertical and horizontal masonry bends has to be replaced by construction of Eco friendly gabion walls, which are flexible, permeable and hence can cope with differential settlement problem of foundation and require less space, than rock buttress. The combination of gabion wall and short cerate, the factor of safety comes well above the critical value. However, where earth fills with high retaining walls exists, it has to be ensured that the back fill used is having good drainage characteristics. Weep holes of retaining walls & breast walls should be cleared & all vegetative growth/blocked drains should be removed before onset of monsoon. Sealing of tension cracks present in all slopes, has to be done by short cerate & grouting to prevent any ingress of water. Slope treatment by vegetative turfing, jute mesh/coir mesh should be adopted to prevent erosion and help the INDIAN HIGHWAYS, April 2015 TECHNICAL PAPERS vegetation to grow on slope. Mulching treatment for protection of hill slopes is also extremely beneficial, as it reduces water loss from soil, minimize weed competitions and improves soil structure. Gabbion Walls Construction Mulching Treatment for Slope Protection on Hill Roads The hill road will remain safe after proper slope treatment has been carried out, and the same can also be repeated INDIAN HIGHWAYS, April 2015 in case required before and after every rainy season. All excavated materials from road construction & improvement in the hilly region of Uttarakhand, goes down the hills, deface and degrade the 27 TECHNICAL PAPERS land below & above, due to which the top soil adversely effects the growth of vegetation, trees etc. and thus causes ecological imbalance. Beside the enormous quantities of soil, rock fragments, debris which goes down to the stream of rivers below the hills on valley side, the rate of erosion in the catchment area of the Himalayan rivers of Uttarakhand has increased manifold, resulting rapid siltation of reservoirs and dams. It was estimated in the year 1990 each kilometer of road in hills require displacement of 40 to 80 thousand cubic meter of debris. The eroded debris carried by Himalayan Rivers of Uttarakhand shall always remain vulnerable to flash floods. This unhealthy construction practice has to be stopped by introducing some judicious technical method to avoid construction materials & debris going to the rivers on the valley side, such as build stones wall on the valley sides, then pour earth to widen hill roads, no debris or any materials be allowed to go down the valley side to increase the silting problem of Himalayan rivers of Uttarakhand. Modern earth work equipment may be used to remove the mass earth work & other materials from the construction site of work, to be deposited at safer & proper place. Proper monitoring of surface and subsurface movements and pore water pressures (Piezometric) in all sensitive & critical hilly areas of Uttarakhand has to be noted carefully and monitored. A proper data bank has to be developed, to forecast the possibility of landslides disaster. To minimize disturbance on hill side it is advisable to construct road in half cut & half fill, if not in all sections of hill road, but at sensitive locations the practice be gainfully employed. 4EARLY WARNING SYSTEM FOR UTTARAKHAND DISASTER In view of the prediction of the geologist, that the young Himalayan 28 hills of Uttarakhand, the surface of the land is made by nature to decay and is not everlasting, there is an urgent need to develop a proper warning system in Uttarakhand that alerts, residents, tourists and pilgrims across Himalayan regions of Uttarakhand. The need in Uttarakhand is to pre-empt the disaster by disseminating information available before it strikes. This is only possible, when several Government agencies have constant proper interaction and work closely. The Geological Survey of India (GSI) must identify vulnerable hilly area of Uttarakhand. Indian Space Research Organization (ISRO) though satellite mapping must identify all critical areas having cracks etc. in the hills of Uttarakhand. The MET department must give advance warning of inclement weather. Once in Uttarakhand the proper warning system is made effective, collateral damages of the kind unleashed in Uttarakhand on June 16th - 17th 2013, can be prevented to a great extent. However, the need of the hour for Uttarakhand infrastructure development is sustainable development with ecological balance. The bottom line is that the development authorities responsible for infrastructure development in Uttarakhand have to response on priority to the wakeup call of Uttarakhand wreckage of 16th - 17th June 2013. To accomplish the goal, the policy makers, concerned with the development project in Uttarakhand, must understand that a “Decade of Action” must be a “Decade of Change” to be effective. They cannot continue to do the same things and except better results. It is the time that the authorities responsible for infrastructure development in Uttarakhand should make a strong commitment to meet this great challenge to avoid further wreckage of Uttarakhand in the coming future. As one can see that a dark and lengthening shadow of an “Ecological Disaster” looms large across the future population living in Himalayan region of Uttarakhand. The development authorities of Uttarakhand have to ensure more ecological friendly construction processes, procedures, techniques and technology to not only reduce degradation of the eco-system but to create a process of rehabilitation of eco-system that has been degraded, destroyed or damaged in the hills of Uttarakhand. No development plans of Uttarakhand are to be cleared without proper geological and geotechnical investigations, besides till adequate provision is made for protective measures adopted to prevent degradation of environment. Construction and development activities for hilly region of Uttarakhand should be appropriately regulated with in-built provision for simultaneous implementation of protective measures, short and longterm interests should be safeguarded through systematically launched and strictly monitored with scientific studies, old constructions should be appropriately strengthened and maintained. The wreckage of Uttarakhand on 16th – 17th June 2013 is a wakeup call for the authorities of Uttarakhand; it is the time to treat the health of Himalayans hills of Uttarakhand. If your doctor is 98 percent sure you had a serious disease, one should immediately start looking for the cure, if not, and death is imminent. The way ahead is to respect the vulnerability of hills of Uttarakhand, to avoid the repeat of Himalayan tragedy. The development authorities of Uttarakhand had to now ensure zero tolerance against deliberate environmental violence & unhealthy construction practice in the young Himalayans of Uttarakhand. This may sound like a dooms day prediction but if the authorities of Uttarakhand are not waken up and human activities in Uttarakhand, relating to expansion on unstable slopes or locations, unscientific quarrying & mining, unsafe haphazard construction of roads, dams and river training works, ignoring environmental INDIAN HIGHWAYS, April 2015 TECHNICAL PAPERS & natural features are continued in Uttarakhand, the extent of calamities in Uttarakhand will only multiply, with point of no return. Few photographs of rescue operations of Uttarakhand Deluge – June 2013 only taken up, in phases as per the urgency & availability of funds with the Government of Uttarakhand. ACKNOWLEDGEMENT The pictures and data referred above are courtesy of government broadcasting agencies and literature provided by the newspapers, magazine, and reports etc. during the disaster of Uttarakhand in June 2013. REFERENCES 5 CONCLUSIONS A wakeup call for the authorities of Uttarakhand responsible for development work in the state, to rethink of the existing policies for development in the light of “Ecological Disaster” looms across the future population living in Himalayan region of Uttarakhand. The authorities of Uttarakhand have to make stringent rules & regulations for “Zero Tolerance” against deliberate environmental violence & unhealthy INDIAN HIGHWAYS, April 2015 construction activities prevailing in the hills of Uttarakhand. A holistic short term & long term policies for development of different regions (depending on Geological strata) of Uttarakhand is to be formulated at the Government level, with the involvement of local Panchayat, influential & experience people of that particular regions to make a “Disaster Free Model” for development of that particular region. The construction work in that region, 1. 2. 3. 4. Kala, C.P. Deluge, disaster and development in Uttarakhand Himalayan region of India: Challenges and lessons for disaster management. International Journal of Disaster Risk Reduction, 2014. Uttarakhand: Army Commander walks with 500 people out of Badrinath. “Uttarakhand: Rescue efforts in full swing”. 18 June 2013. Kedarnath temple in Uttarakhand survives glacier, floods Down to Earth. 29 Government of Tamil Nadu NATIONAL HIGHWAYS CIRCLE MADURAI- 625 002 Ph: 0452-2530540 e-mail: [email protected] TENDER NOTICE No. 4/2015/DO/Dt. 19.03.2015 For and on behalf of Governor of Tamil Nadu the Superintending Engineer, National Highways, Madurai invite tender (Two Cover System) through Online only for Construction works as detailed in the table. Sl. No. Name of the work 1 2 1 Periodical renewal in km 5/0-9/0, 11/0-16/0, 38/0-48/0 of Trichy Chidambaram Road on NH 227 Value of work in lakhs 3 912.20 Bid Security in Rupees 4 18,25,000 Cost of tender document plus VAT in Rs. (Not refundable) Concerned NH Division 5 6 15000/+ 750/- Divisional Engineer (NH) Thanjavur Period of Completion in months 7 9 (Nine Months) 1. Tender documents are available Online in the website https://morth.eproc.in upto 15.00 hrs. of 23.04.2015. 2. Submission of Tender through Online can be done upto 15.00 hrs. of 23.04.2015. 3. Bids will be opened on 30.04.2015 by 15.00 hrs in the office of the Chief Engineer (NH) at Chepauk, Chennai. 4. Pre bid meeting will be held on 07.04.2015 by 11.00 am at office of the Superintending Engineer (NH) Circle, Madurai -02 . 5. The bidders must possess Digital Signature Certificate of Class III (Signing & Encryption) for submission of bids through online in the above website. 6. The bidders shall be paid required tender processing fee as furnished in Tender Document (non-refundable) to M/s C1 India Pvt Ltd against tender Processing Fee through E-Payment gateway using Credit Card/ Debit Card- Master Card and Visa Card only 7. The original financial instruments such as cost of bidding document, Bid Security and the original / attested document shall be received by the Superintending Engineer (NH), Madurai / Divisional Engineers (NH), Thanjavur / Chief Engineer (NH), Chepauk, Chennai / Regional Officer, MORT&H, Chennai & Chief Engineer (P7), MORT&H, GOI, New Delhi on or before 29.04.2015, 15.00 hrs. failing which the bid shall be summarily rejected. 8. Further details can be seen on Web site https://morth.eproc.in DIPR/1469/Tender/2015 Superientending Engineer, N.H.Circle, Madurai-02 IRC - 23CMS X 17CMS 30 INDIAN HIGHWAYS, April 2015 INDIAN HIGHWAYS, April 2015 31 32 INDIAN HIGHWAYS, April 2015 INDIAN HIGHWAYS, April 2015 33


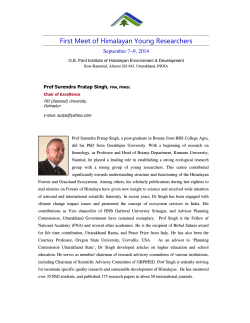
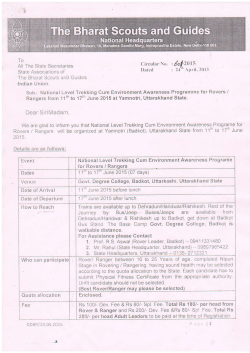


© Copyright 2026