April 2015 - Kelley Blue Book Media Center

USED
BLUE
BOOK
Market Report
CAR
EDITION
ARPIL
2015
Automotive Insights from Kelley Blue Book
Kelley Blue Book Public Relations Contacts:
Joanna Pinkham | Sr. Public Relations Manager
404.568.7135 | [email protected]
Chintan Talati | Sr. Director, Public Relations
949.267.4855 | [email protected]
Brenna Robinson | Sr. Public Relations Manager
949.267.4781 | [email protected]
In This Issue:
USED-CAR MARKET ANALYSIS:
Fuel Prices Relatively Flat in April; Remain Low
Year-Over-Year
USED-CAR MARKET ANALYSIS
Fuel Prices Relatively Flat in April; Remain Low YearOver-Year
Sports Car Values Heat Up Prior to Summer Months,
While Electric Vehicle Values Cool
Fuel Prices
$4.00
Chrysler, Buick Report Largest Gains on Strength of
Popular Models in April
Regular Conventional Retail
$3.75
Samantha Hawkins | Marketing Coordinator
949.268.2760 | [email protected]
$3.50
$3.26
Fuel Prices
$3.25
•
$3.00
•
$2.75
$2.50
$2.39
$2.25
$2.23
$2.00
$1.75
CY 2013
$1.50
Jan
CY 2014
Fuel prices in April remained relatively stable, increasing by
4 cents, or 1.9 percent, nationally.
Year-to-date, the average price for a gallon of regular
gasoline has increased 26 cents, or 12 percent; however,
compared to April 2014, fuel prices are down $1.22, or 34
percent.
CY 2015
Jan Feb March April May June July Aug Sept Oct Nov Dec
Source: U.S. Energy Information Administration
“Despite a 35 cent increase in fuel prices in February 2015, fuel prices are very low compared to this time last year,” said Sean Foyil, analyst for Kelley Blue
Book. “Low fuel prices are continuing to drive down demand for the hybrid and electric vehicle segments, while making less fuel-efficient segments such as
the trucks and full-size SUVs more attractive to shoppers.”
Sports Car Values Heat Up Prior to Summer Months, While Electric Vehicle Values Cool
•
Segment Comparison
April 24, 2015 vs. March 27, 2015
Four-Week Difference (%)
Model Years 2012 - 2014
Sports Car
2.6%
Full-Size SUV/Crossover
1.9%
Minivan/Van
1.5%
Full-Size Car
1.4%
Mid-Size Car
1.4%
Mid-Size SUV/Crossover
1.2%
Compact SUV/Crossover
0.7%
Full-Size Pickup Truck
0.7%
Luxury Full-Size SUV/Crossover
0.5%
Subcompact Car
0.3%
Entry-Level Luxury Car
0.2%
Mid-Size Pickup Truck
0.2%
Luxury Compact SUV/Crossover
0.1%
Compact Car
-0.2%
High Performance Car
-0.6%
Sporty Compact Car
-1.0%
Luxury Car
-1.1%
Hybrid/Alternative Energy Car
-1.3%
High-End Luxury Car
-10%
“The electric vehicle segment was the worst-performing segment in
April, down 8.5 percent, or $1,300, due primarily to the Nissan LEAF and
Mitsubishi i-MiEV, while the hybrid segment was down only 1.3 percent, or
$187 dollars. Low fuel prices as well as increasing lease returns have been the
largest contributing factors in pushing values for the Nissan LEAF lower” said
Foyil.
-0.4%
Luxury Mid-Size SUV/Crossover
Electric Vehicle
•
1.1%
Average
-1.6%
-8.5%
-8%
-6%
-4%
-2%
In April, the sports car segment reported the largest gain of any
segment, increasing an average of 2.6 percent, or $483 dollars. It is
typical to see the sports car segment gain momentum prior to summer
months, as consumers have more options to choose from due to
warmer weather. A few popular vehicles within the sports car segment
include the BMW Z4, Ford Mustang, Chevrolet Camaro, Dodge
Challenger, Scion FR-S and Mazda Miata.
Full-size SUV/crossovers, minivans, and full-size cars all appreciated in
April above the segment average. Low fuel cost is a large contributor to
this appreciation, and continues to help the full-size vehicle segments.
0%
2%
Source: Kelley Blue Book Automotive Insights
4%
USED-CAR
MARKET ANALYSIS:
continued
Chrysler, Buick Report Largest Gains on Strength of Popular Models in April
•
Manufacturer Comparison
April 24, 2015 vs. March 27, 2015
Model Years 2012 - 2014
3.2%
2.6%
2.4%
1.8%
1.7%
1.6%
1.5%
1.5%
1.1%
1.1%
1.1%
1.0%
1.0%
0.8%
0.8%
0.8%
0.7%
0.6%
0.6%
0.3%
0.3%
0.3%
0.1%
0.0%
Four-Week Difference (%)
Chrysler
Buick
Dodge
Subaru
Chevrolet
GMC
Jeep
Lincoln
Scion
Suzuki
Ram
Honda
Mitsubishi
Cadillac
Ford
Mazda
Average
Kia
Hyundai
FIAT
Toyota
Porsche
Audi
Infiniti
Land Rover
Acura
Volkswagen
Nissan
Lexus
MINI
Volvo
Mercedes-Benz
Jaguar
BMW
Smart
-1.7%
-5.7%
-7%
-6%
-5%
-4%
-3%
0.0%
-0.1%
-0.2%
-0.4%
-0.5%
-0.7%
-0.9%
-1.0%
-1.1%
-2%
-1%
0%
1%
2%
3%
Source: Kelley Blue Book Automotive Insights
•
•
Chrysler saw the largest appreciation in April 2015, with an
average increase of 3.2 percent across its lineup. This increase
is largely due to a 4.8 percent increase in the outgoing
generation Chrysler 200.
Buick also saw a large uptick in values throughout the month
of April, increasing overall by 2.6 percent due largely to the
Regal, which saw an average increase of 5.2 percent across the
2012-2014 model years.
Overall, the average manufacturer saw an increase of 0.7
percent in April 2015.
4%
Appendix
Top Five Performing Segments:
Bottom Five Performing Segments:
SEGMENT
4-Week (%)
Sports Car
2.6%
Full-Size SUV/Crossover
1.9%
Minivan/Van
1.5%
Full-Size Car
1.4%
Mid-Size Car
1.4%
MY 2012-2014, Kelley Blue Book Auction Value
Top 10 Performing Models:
MAKE
MODEL
Dodge
Dart
Ram
C/V
Ford
E350 Super Duty Passenger
Buick
Regal
Chrysler
200
Cadillac
CTS
Subaru
Legacy
Chevrolet
Malibu
Audi
A3
GMC
Savana 2500 Cargo
MY 2012-2014, Kelley Blue Book Auction Value
4-Week (%)
7.2%
6.1%
5.6%
5.2%
4.8%
4.6%
4.4%
4.3%
4.2%
4.1%
SEGMENT
4-Week (%)
Electric Vehicle
-8.5%
High-End Luxury Car
-1.6%
Hybrid/Alternative Energy Car
-1.3%
Luxury Car
-1.1%
Sporty Compact Car
-1.0%
MY 2011-2013, Kelley Blue Book Auction Value
Bottom 10 Performing Models:
MAKE
MODEL
Nissan
LEAF
Mitsubishi
i-MiEV
Smart
fortwo
Mercedes-Benz
CLA-Class
Toyota
Yaris
Mercedes-Benz
CL-Class
Jaguar
F-TYPE
Lexus
LS
Acura
ILX
BMW
7 Series
MY 2012-2014, Kelley Blue Book Auction Value
4-Week (%)
-16.2%
-15.2%
-5.7%
-4.3%
-3.5%
-3.4%
-3.4%
-3.2%
-3.2%
-2.9%
The statements set forth in this publication are the opinions of the authors and are subject to change without notice. This publication has been prepared for
informational purposes only. Kelley Blue Book assumes no responsibility for errors or omissions.
About Kelley Blue Book (www.kbb.com)
Founded in 1926, Kelley Blue Book, The Trusted Resource®, is the only vehicle valuation and information source trusted and relied upon by both consumers and the
automotive industry. Each week the company provides the most market-reflective values in the industry on its top-rated website KBB.com, including its famous Blue Book®
Trade-In Values and Fair Purchase Price, which reports what others are paying for new and used cars this week. The company also provides vehicle pricing and values through
various products and services available to car dealers, auto manufacturers, finance and insurance companies, and governmental agencies. Kelley Blue Book’s KBB.com ranked
highest in its category for brand equity by the 2014 Harris Poll EquiTrend® study and has been named Online Auto Shopping Brand of the Year for three consecutive years.
Kelley Blue Book Co., Inc. is a Cox Automotive company. For more information and news from Kelley Blue Book’s KBB.com, visit www.kbb.com/media/.
2
BLUE BOOK 
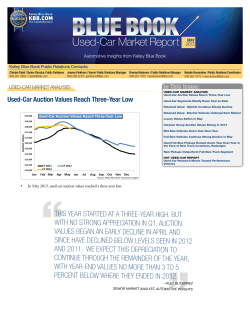
Used-Car Market Report
APRIL 2015