
Document 109443
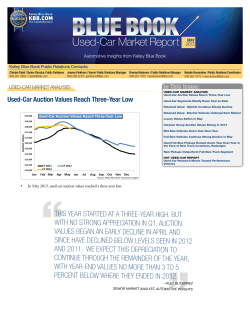
In This Issue:
BLUE BOOK
www.kbb.com
Market Report
NEW-CAR MARKET ANALYSIS
Analysts Determine Improved Economic Indicator
Levels Needed to Bolster Vehicle Sales Back to 15M
With Gas Prices Sliding, Mid-Size Sedan Sales Surge at
the Expense of Compacts; More
USED-CAR MARKET ANALYSIS
Drop in Gas Prices Drive Weakest Q2 Performance of
Wholesale Values Since 2008; More
JULY
2012
RESIDUAL ANALYSIS
Reconsidering Fuel Prices
Analysis from Kelley Blue Book’s Analytic Insights Team
LATEST HOT USED-CAR REPORT
Large Utility Models Make Up Top Five For June
Kelley Blue Book Public Relations Contacts:
Robyn Eagles | Senior Director, Public Relations
949.268.3049 | [email protected]
Joanna Pinkham | Senior Public Relations Manager
949.268.3079 | [email protected]
Brenna Robinson | Public Relations Manager
949.267.4781 | [email protected]
Natalie Kumaratne | Public Relations Coordinator
949.267.4770 | [email protected]
NEW-CAR MARKET ANALYSIS:
Analysts Determine Improved Economic Indicator Levels
Needed to Bolster Vehicle Sales Back to 15M
- Alec Gutierrez, senior market analyst, automotive insights, Kelley Blue Book
N
ew-vehicle sales hit 14.1 million seasonally adjusted annual rate (SAAR) in June 2012, a 22 percent increase year-over-year. Through the first six
months of the year, more than 7.2 million light vehicles were sold, keeping sales on pace to hit Kelley Blue Book’s projected forecast of 14.2 million
units for the year. This would mark the first time sales surpassed 14 million units since 2007, and the third consecutive year of 10 percent or greater
annual gains since sales hit a near 30-year low of 10.5 million units in 2009. The sales rebound predominately has been driven by a steady, albeit painfully
slow, economic recovery since the real estate bubble burst in 2008. Strong demand from consumers in need of a replacement vehicle, improved credit
availability, low interest rates and ample incentives are further aiding sales.
Sales have remained strong despite a flurry of negative economic developments during the past few months, including a soft job market and four
consecutive months of decline in consumer confidence. Although conditions in the economy have showed signs of weakness, Kelley Blue Book still believes
that the economy is strong enough to keep sales steady through the remainder of 2012.
Although industry sales are on pace to improve 11 percent in 2012, we may see industry growth stall in 2013. In order for sales to return to 15 million
units per year, we will need stronger economic growth, specifically in both unemployment and consumer confidence. Unfortunately for those banking on an
expedient recovery in auto sales, recent data suggests that it may be some time before the economy is healthy enough to support a return to 15 million annual
sales. With both unemployment and consumer confidence headed in the wrong direction, Kelley Blue Book analysts examined the historical relationship
between unemployment, consumer confidence and light-vehicle sales to determine how much overall economic improvement is necessary before sales once
again approach 15 million units per year.
Since 1976, light-vehicle sales have not surpassed 13 million units in a year where the unemployment rate averaged 8 percent or more. According to trend,
unemployment will need to reach 6 percent or less before light-vehicle sales can sustainably achieve 15 million units per year or more. Similarly, consumer
confidence needs to be at 80 or above before 15 million units a year becomes a reality. With the unemployment rate currently at 8.3 percent and consumer
confidence at 62, we have a long way to go before the industry reaches a point where sales will return to their pre-2008 norm.
2011
10
11
12
13
Vehicle Sales vs. Confidence
Consumer Confidence Index
Avg. Unemployment Rate %
Vehicle Sales vs. Unemployment
11
10
9
8
7
6
5
4
3
2
2012 (est.)
14
Annual Light-Vehicle Sales (Millions)
15
16
17
18
Source: economy.com
160
140
120
100
80
60
40
20
0
2012 (est.)
2011
10
11
12
13
14
Annual Light-Vehicle Sales (Millions)
15
16
17
18
Source: economy.com
NEW-CAR
MARKET ANALYSIS:
continued
With Gas Prices Sliding, Mid-Size Sedan Sales Surge at the Expense of Compacts
G
250,000
200,000
150,000
100,000
50,000
Compact Car
Mid-Size Car
Jun-12
May-12
Apr-12
Mar-12
Jan-12
Feb-12
Dec-11
Oct-11
Nov-11
Sep-11
Jul-11
Aug-11
Jun-11
Apr-11
May-11
Mar-11
Jan-11
0
Feb-11
While compact sales have been unable to keep pace with the rest of
the industry, mid-size sedan sales continue to flourish. Mid-size cars
accounted for 18.6 percent market share in June, a 44 percent increase
year-over-year. The surge in mid-size car sales can largely be attributed
to the strength of the redesigned Toyota Camry, which posted more than
32,000 sales alone in June. The Chevrolet Malibu, Honda Accord, Nissan
Altima and Ford Fusion also performed well, each selling more than
20,000 units due to strong incentives in anticipation of redesigns that
are expected to arrive for each model later this year. The Altima, Malibu
and Fusion currently are available with nearly $3,000 each in cash rebates
and close to zero-percent financing for up to 60 months. In many cases,
these deals are swaying consumers who otherwise would have considered
purchasing a compact.
Mid-Size Sedan Sales Surge While Compacts Stall
300,000
Monthly Light-Vehicle Sales
as prices have dropped more than $0.50 per gallon nationally since
April, and sales of compact cars have slowed significantly as a result.
Compared to last year, sales were relatively flat, increasing a scant
1.4 percent, which is well below the 22 percent average increase for the
industry. Fuel prices are expected to drop as low as $3.00 per gallon by
year-end according to some estimates; a mark that will send compact cars
sales tumbling further.
Source: Kelley Blue Book Automotive Insights
Alternative Energy Vehicle Sales Surge 164 Percent in June
W
35,000
$4.40
30,000
$4.20
25,000
$4.00
20,000
$3.80
15,000
$3.60
10,000
$3.40
5,000
$3.20
$3.00
Jun-12
May-12
Apr-12
Mar-12
Feb-12
Gas Prices
Jan-12
Dec-11
Oct-11
Nov-11
Sep-11
Jul-11
Aug-11
Jun-11
Apr-11
Mar-11
0
May-11
Alternative Energy Vehicle Sales
Source: Kelley Blue Book Automotive Insights and Energy Information Administration (EIA.gov)
Sales of alternative-energy
vehicles typically fall rapidly
after fuel prices peak, and
although sales are down from
the March 2012 high, they remain
stronger than in previous years.
- Alec Gutierrez
2 BLUE BOOK Market Report
JULY 2012
National Average Fuel Price/Gallon
$4.60
Jan-11
Sales of the Lexus CT200h also improved nearly 500 percent
year-over-year. In addition, the Chevrolet Volt was a strong
performer with sales improving more than 200 percent year-overyear. The Volt has outsold the Nissan Leaf nearly 3-to-1 so far this
year, even though it has a higher manufacturer’s suggested retail
price (MSRP) and is not considered a “true” all-electric from a
purists’ standpoint. Meanwhile, the Honda CR-Z, Honda insight
and Nissan Leaf all fell short of figures from just a year ago. Sales
of alternative-energy vehicles typically fall rapidly after fuel prices
peak, and although sales are down from the March 2012 high,
they remain stronger than in previous years.
40,000
Feb-11
The Toyota Prius was the most significant driver of segment
gains, with sales surging more than 300 percent from June of last
year. The Prius has been in high demand since the introduction of
the subcompact Prius c and wagon-esque Prius v. Sales numbers
for the Prius also look especially strong due to the inventory
shortages that plagued Toyota at this time last year.
Hybrid Sales Fluctuate Along with Fuel Prices
Monthly Light-Vehicle Sales
ith gas prices declining, sales of hybrid and electric
vehicles have remained surprisingly resilient. In fact,
sales of dedicated hybrid and alternative-energy vehicles
surged more than 164 percent in June. We could see hybrid and
electric vehicle sales slow as well; however, today it appears as
though the sales decline may be relatively mild.
USED-CAR MARKET ANALYSIS:
U
sed-car values dropped more than 2 percent in June, the second
consecutive monthly decline since values leveled off in early
April. Through Q2, values slid more than 4 percent, the most
pronounced quarterly decline since 2008. The market was especially soft
this year due to an earlier-than-anticipated jump in fuel prices, which sent
values of fuel-efficient compact and hybrid cars tumbling. Fuel prices
topped out in early April, well before the typical seasonal decline that
begins after Memorial Day weekend.
Since vehicle values peaked early as well, now they have slipped below
average prices seen in 2011. The average 1- to 3-year-old vehicle now
averages $18,000 at auction, approximately 4 percent below the amount
dealers were paying one year ago when used-car values hit an all-time
high. Although values are now down from the height of last year, they
remain 20 percent higher than the low point in 2009 and more than 10
percent above the average price paid from 2000 to 2008. With values still
high from a historical perspective, Kelley Blue Book believes there is room
for further softening through the second half of 2012.
Change in Auction Value (MY20092011)
Drop in Gas Prices Drives Weakest Q2 Performance of Wholesale Values Since 2008
Falling Gas Prices Lead to Weak Q2
4.00%
2.80%
2.00%
0.40%
0.00%
-0.30%
-2.00%
-4.00%
-4.30%
-6.00%
Q2 2009
Q2 2010
Q2 2011
Q2 2012
Source: Kelley Blue Book Automotive Insights
Used-Car Values Projected to Drop 3.5 Percent in Q3
L
ooking ahead, Kelley Blue Book expects used-car values to continue to decline moderately, especially as supply improves at auction. As it stands today,
supply has improved slightly but still remains tight. Trade-in volume has increased alongside new-vehicle sales, which is alleviating inventory shortages
plaguing dealers. In most cases though, dealers are opting to retain trade-ins, keeping trade volume low in the auction lanes.
Off-lease volume is expected to remain tight until at least the first quarter of 2013, but even then, auctions may not see an increase in volume. In many
cases, captive finance companies are selling their off-lease vehicles directly to franchised dealers, benefitting only those franchised dealers with access to
upstream sales channels. With auction supply expected to remain tight through the third quarter of 2012, Kelley Blue Book projects values to drop 3
to 4 percent on average. This decline will be less pronounced than the 5.6 percent decline that occurred during the third quarter of 2011, since values
started their decline earlier this year. Although values currently are down more than 4 percent year-over-year, we expect this gap to narrow as the pace of
depreciation levels off in the months ahead.
Change in Auction Value (MY2009-2011)
Q3 Declines in Used-Car Values
2.00%
0.70%
0.00%
-2.00%
-1.30%
-4.00%
-3.50%
-6.00%
-5.60%
-8.00%
Q3 2009
Q3 2010
Q3 2011
Q3 2012
(projected)
Source: Kelley Blue Book Automotive Insights
3 BLUE BOOK Market Report
JULY 2012
With auction supply
expected to remain tight
through the third quarter
of 2012, Kelley Blue Book
projects values to drop 3
to 4 percent on average.
- Alec Gutierrez
USED-CAR
MARKET ANALYSIS:
continued
Crossovers Underperform, Yet Values Retention Remains above Average
D
espite the fact that crossovers (CUVs) had the greatest percentage
decreases in the second quarter, they continue to outperform the
average vehicle in terms of retained value. Using model-year 2010
as an example, the average auction value for all vehicles is approximately
65 percent of the original MSRP, compared to 73 percent for the luxury
crossover segment, and 66 percent for mid-size and compact crossovers.
Declines in CUV values during the last three months are more of a return to
normalcy than an identifier of poorly performing segments, as strong values
for CUVs are unsustainable in a market with downward pressure on newvehicle prices and increasing affordability and credit.
Another contributing factor to the drop in crossover values is the April
peak in gas prices and subsequent decline through May and June. The
popularity of crossovers largely is due to the periods of high gas prices driving
many consumers away from inefficient SUVs. While crossovers continue
to offer a good compromise between mileage and carrying capacity, their
advantages are not as pronounced during periods of falling fuel prices,
especially considering American consumers’ infatuation with sport utility
vehicles.
Declines in CUV values during
the last three months are
more of a return to normalcy
than an identifier of poorly
performing segments, as
strong values for CUVs are
unsustainable in a market with
downward pressure on newvehicle prices and increasing
affordability and credit.
- Alec Gutierrez
Crossovers Lead Q2 Declines
Mid-Size Crossover
Luxury Crossover
Compact Crossover
Mid-Size Sport Utility
Mid-Size Car
Luxury Sport Utility
Minivan
Full-Size Sport Utility
Full-Size Car
Full-Size Pickup Truck
Average
Full-Size Crossover
Compact Car
Luxury Car
Mid-Size Pickup Truck
Hybrid Car
Compact Luxury Car
Premium Luxury Car
Sports Car
Near Luxury Car
Subcompact Car
-7.2%
-6.7%
-6.0%
-5.4%
-5.3%
-5.1%
-5.0%
-5.0%
-4.6%
-4.5%
-4.3%
-4.3%
-3.1%
-2.7%
-2.6%
-2.4%
-1.7%
-1.4%
-1.2%
-0.9%
-0.8%
Mid-Size Pickup Truck
Hybrid Car
Subcompact Car
Luxury Sport Utility
Near Luxury Car
Compact Crossover
Full-Size Pickup Truck
Compact Car
Mid-Size Crossover
Average
Full-Size Crossover
Luxury Car
Mid-Size Sport Utility
Compact Luxury Car
Minivan
Full-Size Sport Utility
Mid-Size Car
Premium Luxury Car
Van
-20.0%
-10.0%
0.0%
10.0%
Change in Auction Value (MY2009-2011)
Source: Kelley Blue Book Automotive Insights
4 BLUE BOOK Market Report
JULY 2012
75.3%
72.7%
72.3%
71.6%
70.2%
69.4%
67.6%
66.3%
66.1%
66.0%
65.6%
64.7%
63.5%
63.5%
63.0%
62.5%
61.2%
59.7%
58.8%
58.7%
56.3%
55.9%
Sports Car
Luxury Crossover
0.3%
Van
Crossover Retention Remains High
Full-Size Car
0.0%
20.0%
40.0%
60.0%
80.0%
Auction Value/MSRP(MY2010)
Source: Kelley Blue Book Automotive Insights
USED-CAR
MARKET ANALYSIS:
continued
Used Fuel Sippers Slide on Cheaper Gas
C
heaper prices at the pump continued the trend of weaker demand for fuel-efficient vehicles, which saw a drop of 2.5 percent in auction values since the
start of June, more than the overall average of 1.9 percent depreciation for the market. As dealers remain wary of purchasing these vehicles at auction,
Kelley Blue Book expects values to continue falling in line with fuel prices. The most significant declines will come from hybrid cars, which remain
up 10 percent on a year-to-date basis. The 2010 Toyota Prius, which we noted was due for a price correction last month, continued its swift decline of more
than $1,000 in June.
Although Kelley Blue Book expects continued weakening, we should note that fuel-efficient vehicles remain among the top performers when it comes
to value retention from original MSRP. The average 2010 model-year used compact car is worth 66 percent of its original MSRP, slightly better than the
aforementioned 65 percent average for the industry. Subcompact and hybrid cars remain especially strong, currently holding 70 and 72 percent of original
MSRP, respectively. Consumers that own a fuel-efficient vehicle should not be concerned with excessive depreciation. Today we merely are seeing a
correction from the run-up in values that occurred while fuel prices increased early in the year. These vehicles are highly sensitive to fluctuations in fuel prices
and as a result, there is a strong increase in values while fuel prices rise, only to be followed by a correction once fuel prices retreat.
KBB Used-Car Valuation Index (1- to 3-Year-Old Vehicles)
Consumers that own a fuelefficient vehicle should not
be concerned with excessive
depreciation. Today we merely
are seeing a correction from
the run-up in values that
occurred while fuel prices
increased early in the year.
125
Fuel-Efficient Segments (CY2011)
Fuel-Efficient Segments (CY2012)
120
Market Average (CY2011)
Market Average (CY2012)
115
110
CY 2011
105
100
95
CY 2012
90
Jan
Feb
Mar
Apr
May
Jun
Jul
Aug
Sep
Oct
Nov
Dec
Jan
Source: KBB Automotive Insights
- Alec Gutierrez
RESIDUAL ANALYSIS:
Reconsidering Fuel Prices
- Eric Ibara, director of residual value consulting, Kelley Blue Book
A
5 BLUE BOOK Market Report
JULY 2012
$12.00
$3.50
$10.00
$3.00
$2.50
$8.00
$2.00
$6.00
$1.50
$4.00
$1.00
$2.00
$0.50
Jan-17
Sep-17
May-16
Jan-15
Sep-15
May-14
Jan-13
U.S. All Grades Retail Gasoline Prices, ($ per Gallon)
Sep-13
May-12
Jan-11
Sep-11
May-10
Jan-09
Sep-09
$-
May-08
Jan-07
Sep-07
May-06
Jan-05
Sep-05
May-04
Source: Economy.com
$-
Natural Gas: ($ per MMBtu)
Natural Gas price in Dollars per MMBtu
$4.00
Jan-03
The technology that enabled this increase is called hydraulic
fracturing, a technique that allows previously inaccessible oil and gas to
be removed from the ground. This has resulted in a separation between
gasoline prices, which have risen since 2008, and natural gas prices,
which have dropped.
$14.00
Sep-03
The commonly held notion that gas prices will inevitably rise, could
likewise benefit from an occasional reality check. For starters, oil
production in the U.S. is rising. In the first quarter of 2012, according
to the Wall Street Journal, oil production in the U.S. averaged more
than six million barrels a day, a level not seen since 1998. This has been
a contributing factor to the recent drop in crude oil below $80 a barrel.
Gas and Natural Gas Prices Diverge
$4.50
Motor Gasoline Prices in Dollars per Gallon
few decades ago, the scientific consensus held that dinosaurs
became extinct when they failed to adapt to a changing world.
In fact, it was common practice to refer to a person who
refused to change as a “dinosaur.” Subsequently, more nuanced studies
considered the layer of iridium-rich soil above which no dinosaur
fossils have ever been found. Iridium, a metal not commonly found
on Earth, is a footprint of meteorites, which led scientists to reconsider
their hypothesis.
RESIDUAL
ANALYSIS:
continued
Another development currently underway is the increasing fuel
efficiency delivered by new vehicles sold. This trend will continue as
CAFE standards call for the average fuel economy across all vehicles
sold by a manufacturer rising to an average of 34.1 miles per gallon by
2016. This represents an improvement of approximately 33 percent
over the average of all vehicles sold in 2008. More fuel efficient
vehicles require less gasoline for the same miles travelled, so demand
will be lower for this second reason.
So what does this mean for the automotive sector? For starters, if
normal trends hold and no extraordinary event occurs, it is likely that
gas prices have already peaked for the year. Gas prices at the pump
have historically been lower when oil prices have been at their current
level of around $80 per barrel. Prices of around $3 a gallon could be
possible later this year.
Judging by the events of 2008, this will likely be bad news for the
fuel-efficient vehicles. From the peak of gas prices at the end of June
2008, to the bottom of the decline in prices in January 2009, compact
and subcompact sedans lost an average of about 20% of their values.
Hybrids lost even more, an average of 34 percent, or more than
$8,000 per vehicle. Of course, this year’s run up in vehicle prices and
subsequent decline is not nearly as volatile as it was in 2008. Still,
softness in these segments is expected to accompany lower gas prices.
While the rise in fuel price makes 2012 appear to be similar to 2008,
there is one significant difference. In 2008, as gas prices plunged, fuel
efficient vehicles dropped in value while large utility vehicles and trucks
gained. In 2012, large vehicle values did not decline as gas prices
climbed. This is because of a shortage of used vehicles across almost all
segments. Therefore, a drop in gas prices this year is not expected to
cause a further rise in prices among trucks and utility vehicles.
For new car sales, consumers have preferred larger vehicles as long as
gas prices are affordable. In 2008, gas prices rose during the first half
of the year and then plummeted throughout the second half. That
year, retail sales for fuel efficient vehicles (compact cars, subcompact
cars, and hybrids) dropped by 29 percent from the first half to the
second. Consequently, a decline in retail sales in these segments is
expected for the second half of this year, but won’t be as severe as the
29% drop in 2008.
Average and Projected CAFE
35.0
Combined City and Highway MPG
A consequence of this gap is a shift towards more CNG-powered
(compressed natural gas) vehicles. This is already evident in many
municipal vehicles, such as city buses and waste collector trucks.
Earlier this year, all three domestic manufacturers announced CNG
versions of their full-size trucks, offering truck buyers an option that
consumes less expensive fuel. This trend will likely continue and
reduce the demand for gasoline.
34.1
32.6
31.3
29.7
30.0
30.5
27.3
25.0
24.7 24.7 24.7
24.7 24.7 24.8
25.1 25.3
25.5 25.7
25.9
20.0
2000 2001 2002 2003 2004 2005 2006 2007 2008 2009 2010 2011 2012 2013 2014 2015 2016
Low gas prices will likely create an inventory imbalance as CAFE
requirements for 2016 start to take hold. Manufacturers could be locked
into producing vehicles that consumers don’t want but need to be sold in
order to achieve CAFE targets. Conversely, fuel-inefficient vehicles would be
produced in controlled numbers and their shortage could result in artificially
high prices. In either event, without the proper incentives (monetary and
non-monetary), consumers could be left unsatisfied if they have to settle for
a vehicle that may not be their first choice. A further consequence of this
market imbalance could be a hit to manufacturers’ bottom lines if they are
forced to incentivize fuel-efficient models and are restricted in selling more
high-profit, fuel-inefficient models. Over a long period of time, this could
impact manufacturer’s research and design budgets.
From a residual value perspective, if these trends materialize, they will likely
present a few challenges to manufacturers. As the demand for a model wanes,
manufacturers need to resist the temptation to direct excess volume to daily
rental service. Balancing production with demand will be critical, along with
a miserly application of incentives only when needed. For anyone holding a
portfolio of vehicles, running an analysis of the residual risk at lower gas prices
would be instructive. As stated above, there is little upside gain from larger
vehicles this year to offset lower values for fuel-efficient vehicles.
From the oil spike in 2008, many in the auto and financing industries are
aware of the risks associated with rising fuel prices. At Kelley Blue Book, we
believe higher gas prices five years from now is only one of several scenarios
against which vigilance is required. Developments in the oil and gas industry,
along with the CAFE requirements for 2016, will conspire to keep a lid on
fuel prices. However, those same CAFE regulations and the current used-car
inventory levels could create risk factors that did not exist in 2008 should fuel
prices continue to drop. Considering what’s at stake, it seems prudent to have
a plan that considers such a scenario.
This commentary focuses on model years 2009-2011. The statements set forth in this publication are the opinions of the authors and are subject to change
without notice. This publication has been prepared for informational purposes only. Kelley Blue Book assumes no responsibility for errors or omissions.
6 BLUE BOOK Market Report
JULY 2012
HOT USED-CAR REPORT:
Large Utility Models Make Up Top Five for June
- Arthur Henry, manager of market intelligence and market analyst, Kelley Blue Book
Kelley Blue Book’s Hot Used-Car Report captures monthly used-car shopper activity on kbb.com, including a list of the top and bottom movers in the
same time period. Results are provided by the Kelley Blue Book Market Intelligence Team, in an effort to help dealers better understand which used
vehicles consumers are looking at most each month.
S
ummer is officially here, gas prices continue to fall and it appears KBB.com shoppers are looking to perform some heavy-duty activities. Commercial
or utility-oriented vehicles make up the top five segments with the greatest change in traffic share on KBB.com.
The van segment, containing mostly commercial vans, has had the greatest change in share, jumping 13.2 percent month-over-month. Following the
van segment is the full-size pickup segment, which has increased 9 percent during the last month. Highlighting this shopping trend is the heavy-duty 2008
Chevrolet Silverado. However, Chevrolet is not the only American brand to see a lift in its used-truck shopping activity, as Ford and Ram also had models
with substantial increases.
Leading the recreational utility charge is the full-size sport utility segment, driven by increased interest in the 2008 Chevrolet Tahoe. Gaining 24.1 percent
in share, the Tahoe is the sole representative of full-size sport utility vehicles in the top 10 model gainers.
Based on current economic and shopping trends, dealerships that focus on commercial vehicles could experience an increase in foot traffic in the coming
weeks. Also, those dealerships that have a backlog of large utility vehicles can look forward to an opportunity to shed some inventory.
Monthly Used-Car Shopping Activity Growth
Top/Bottom 10 Models
Monthly Used-Car Shopping Activity Growth Segments
2008 CHEVROLET SILVERADO 2500/3500 HD
25.6%
Van
2008 CHEVROLET TAHOE
24.1%
Full-Size Sport Utility
22.8%
Full-Size Pickup Truck
2006 ACURA MDX
18.5%
2006 RAM DAKOTA
2008 FORD F250/F350/F450 SUPER DUTY
2006 NISSAN ALTIMA
2006 MAZDA MAZDA3
15.6%
Mid-Size Pickup Truck
Minivan
11.9%
Luxury Sport Utility
7.1%
2006 CHEVROLET SILVERADO 1500
7.0%
6.4%
2006 VOLKSWAGEN JETTA
-8.5%
2009 HONDA CIVIC
2009 BMW 3 SERIES
-16.5%
2010 LEXUS RX
-17.2%
-17.6%
2009 VOLKSWAGEN JETTA
-20.9%
2009 HONDA PILOT
-23.0%
2009 AUDI A4
-27.8%
2010 LEXUS IS
-28.7%
2010 BMW 5 SERIES
-33.0%
2009 BMW 5 SERIES
-35.2%
2009 VOLKSWAGEN CC
-100%
-50%
0%
50%
100%
% Change in Share Month-Over-Month
Information based on 2010 to 2006 model-year vehicles
9.0%
Mid-Size Sport Utility
13.4%
2006 RAM 1500
13.2%
9.0%
7.5%
6.2%
3.0%
2.7%
Full-Size Car
1.9%
Compact Crossover
0.6%
Sports Car
0.5%
Mid-Size Crossover
0.3%
Mid-Size Car
0.1%
Subcompact Car
-1.3%
High Performance
-1.7%
Compact Car
-2.5%
Full-Size Crossover
-2.6%
Premium Luxury Car
-6.7%
Entry Luxury Car
-7.7%
Luxury Crossover
-9.9%
Compact Luxury Car
-9.9%
Premium Sports Car
-10.5%
Luxury Car
-12.1%
-13.5%
Hybrid Car
-30%
-20%
-10%
0%
10%
20%
30%
% Change in Share Month-Over-Month
Information based on 2010 to 2006 model-year vehicles
About Kelley Blue Book (www.kbb.com)
Founded in 1926, Kelley Blue Book, The Trusted Resource®, is the only vehicle valuation and information source trusted and relied upon by both consumers and the industry. Each week the company provides the most market-reflective values in the industry on its top-rated website www.kbb.com, including its famous Blue Book® Trade-In and
Suggested Retail Values and Fair Purchase Price, which reports what others are paying for new cars this week. The company also provides vehicle pricing and values through
various products and services available to car dealers, auto manufacturers, finance and insurance companies as well as governmental agencies. KBB.com provides consumer
pricing and information on cars for sale, minivans, pickup trucks, sedan, hybrids, electric cars, and SUVs. Kelley Blue Book’s KBB.com ranked highest in its category for
brand equity and was named Online Auto Shopping Brand of the Year by the 2012 Harris Poll EquiTrend® study. Kelley Blue Book Co. Inc. is a wholly owned subsidiary of
AutoTrader.com
7 BLUE BOOK Market Report
JULY 2012


© Copyright 2026