
Genetic diversity studies in rice
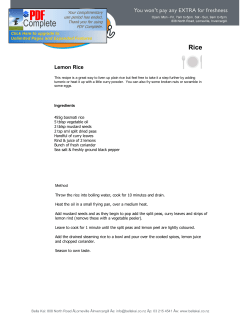
International Journal of Agriculture, Environment and Biotechnology
Citation: IJAEB: 8(1): 143-152 March 2015
DOI Number: 10.5958/2230-732X.2015.00019.4
©2015 New Delhi Publishers. All rights reserved
18
GENETICS
Genetic diversity studies in rice (Oryza Sativa L.) using
microsatellite markers
Aparajita Singh1, R.Saini1, Jyoti Singh, M. Arya, Mukh Ram, Pallavi2, Mukul and
P.K. Singh*
1Department
2Department
of Genetics and Plant Breeding, Institute of Agricultural Sciences, Banaras Hindu University, Varanasi-221005, India.
of Botany, Faculty of Science, Banaras Hindu University. Varanasi, UP, India.
*Corresponding author: [email protected]
Paper No. 303
Received: 4 December 2014
Accepted: 3 March 2015
Published: 25 March 2015
ABSTRACT
The objective of present study was to evaluate the genetic polymorphism and identification of diverse
parents among the 76 rice accessions using simple sequences repeat (SSR) markers. The accessions
showed significant phenotypic variation for all the characters analyzed. The SSR Markers were highly
polymorphic across all accessions and altogether 79 alleles were detected. The overall Polymorphic
information content (PIC) value ranged from 0.26 to 0.65 with an average of 2.82 per locus indicting
high level of genetic variation. The cluster analysis showed the rice germplasm accessions grouped in
to two major groups and 14 subgroups. The pair-wise genetic dissimilarity co-efficient indicated that
the highest dissimilarity was obtained between cultivar B.3688-TB and IR.67017-1(0.1935) followed by
cultivar Badi Kodi and Changhat (0.3333). These grmplasms were showing wide genetic divergence
among the constituent in it and may be directly utilized in hybridization programme for improvement
of yield related traits. The markers RM 413, RM 481, RM 206 and RM 20 produced a maximum of
four alleles. These microsatellite markers could serve as a powerful tool in selecting genetically diverse
germplasm accessions, to execute efficient selection in highly segregating generations.
Highlights
• The PIC value indicates that all these markers were highly informative and capable of distinguishing
between genotypes.
• The SSR markers are neutral and co-dominant and could be a powerful tool to assess the genetic
variability of cultivars.
Keywords: Molecular diversity, Oryza sativa, PIC, alleles, SSR
Rice is the most important staple food grain and stands
next to wheat in the global food grain production.
India has the largest area under rice, about 44.6
M.ha of land with a production of about 106.19 Mt.
(MoA 2014). The rice germplasm is a rich reservoir of
useful genes that rice researcher can harness for rice
improvement programme. Genetic variability exists
among rice germplasm leaving a wide scope for crop
improvements. Information on the genetic diversity
within and among closely related crop varieties is
essential for a rational use of genetic resources. It
contributes to monitoring germplasm and can also be
used to predict potential genetic gains. Studies have
shown that indigenous crop varieties, traditionally
cultivated and maintained by farmers contain high
level of genetic diversity and can serve as potential
genetic resources for improving yield, resistance to
pests and pathogens, and agronomic performance
Singh et.al.
(Mandel et al., 2011, Vung et al., 2012, Bidhan
,2013). Similarly, quantification of genetic diversity
existing within and between groups of germplasm
is important and the crosses between parents with
maximum genetic divergence are generally the most
responsive for genetic improvement (Arunachalam
1981) for realizing higher heterosis and obtaining
superior recombinants. Molecular markers have
proven to be powerful tools in the assessment of
genetic variation and in the elucidation of genetic
relationships within and among species. Several
molecular markers viz. RFLP, RAPD, SSRs, ISSRs,
AFLP and SNPs are presently available to assess the
variability and diversity at molecular level (Kulsum
et al., 2011). DNA based SSR markers are considered
most effective tool for identifying variation among
germplasm due to their multiallelic nature,
high reproduciability, co-dominant inheritance,
abundance, stability and extensive genome coverage
thus being widely applied in genetic diversity
analysis especially in identification of species with
closer genetic relationship (Devi et al., 2012). In
this investigation, we selected 76 rice germplasm
accessions with the objective of identifying
genetically diverse rice germplasm, particularly
to exploit maximum heterosis and recombination
advantage in future breeding programmes. Special
selection emphasis was given to yield and yield
components.
20 cm. The recommended packages of practices were
used for raising a good crop growth. Observations
were recorded on days to 50% flowering, days to
maturity , plant height (cm) , panicle length (cm),
number of effective tillers/plant, panicle weight ,
total number of grains/panicle , filled grains/ panicle,
spikelet fertility percentage, test weight (g), and
grain yield/ plant (g). The statistical analysis means,
range and coefficient of variations were carried out
for all the traits.
Genomic DNA extraction and PCR amplification
Genomic DNA was extracted from the leaf of 10-15
days young plant by using CTAB DNA extraction
method (Doyle and Doyle, 1990. DNA samples
were diluted to 10 ng/µl. The SSR were chosen
on the basis of their published molecular weight,
reliability of amplification signal and polymorphism
information content. The DNA was quantified
spectrophotometrically (PerkinElmer, Singapore)
by measuring A260/A280 and DNA quality was
checked by electrophoresis in 0.8% agarose gel. A
total of 95 SSR markers, selected from www.gramene.
co.in and were synthesized by Eurofins Genomics
(Bangalore, India) , and were initially evaluated
by using five most morphologically diverse lines
for their capability to amplify clear, reproducible,
polymorphic DNA bands. Later, 28 polymorphic
markers were selected for the analysis of all the 76
genotypes (Table 1). The amplification was carried
out in 15μl of reaction mixture containing 30 ng
genomic DNA, 1.5 mM PCR buffer (MBI Fermentas,
USA), 400 μMdNTPs (MBI Fermentas), 1 U Taq DNA
polymerase (MBI Fermentas) and 0.4 μM primer
using a thermal cycler (Mastercycler gradient,
Eppendorf). Thermal cycling program involved an
initial denaturation at 940C for 45 sec, annealing
at 20c bellow Tm of respective primers for 30 sec,
primer extension at 72 0C for 30 sec, followed by a
final extension at 72 0C for 7 min. Electrophoresis
separation and visualization of amplified products.
The amplified PCR products along with a 50 bp DNA
marker ladder (MBI Fermentas) were size fractioned
by electrophoresis in 2.5% agarose gel prepared in
TAE buffer and visualized by staining with ethidium
Materials and Methods
Plant materials and field evaluation of morphological
traits
The experiment was carried out during kharif season
2013 at Agricultural Research Farm, Institute of
Agricultural Sciences, Banaras Hindu University,
Varanasi. The experimental seed material comprise
of 76 rice germplasms collected from IRRI,
Philippines; NBPGR, New Delhi; CRRI, Cuttack;
NDUAT, Faizabad; BAU, Ranchi and NRCPB, New
Delhi The nursery was sown on June10, 2013 and 21
days old seedling was transplanted in a randomized
block design (RBD) with three replications. Each plot
consisted of five rows of 1.5m length with spacing 15 ×
144
Genetic diversity studies in rice (Oryza Sativa L.) using microsatellite markers
Tabel 1. List ofSSR markers, sequence, linkage group, number of alleles and their PIC used in genetic diversity.
1
Primer
name
RM259
TGGAGTTTGAGAGGAGGG
CTTGTTGCATGGTGCCATGT
1
2
PIC
value
0.34
2
RM297
TCTTTGGAGGCGAGCTGAG
CGAAGGGTACATCTGCTTAG
1
3
0.52
3
RM580
GATGAACTCGAATTTGCATCC
CACTCCCATGTTTGGCTCC
1
4
0.34
4
RM279
GCGGGAGAGGGATCTCCT
GGCTAGGAGTTAACCTCGCG
2
2
0.37
5
RM7636
TCACTAACACAGGCAGAGCG
ACCAACTCAAGGCGAAGATG
2
3
0.41
6
RM53
ACGTCTCGACGCATCAATGG
CACAAGAACTTCCTCGGTAC
2
2
0.37
7
RM514
CCGAGGAGAGGAGTTCGAC
GTGCCAATTTCCTCGAAAAA
3
2
0.37
8
RM251
GAATGGCAATGGCGCTAG
ATGCGGTTCAAGATTCGATC
3
3
0.45
9
RM280
ACACGATCCACTTTGCGC
TGTGTCTTGAGCAGCCAGG
4
3
0.51
10
RM131
TCCTCCCTCCCTTCGCCCACTG
CGATGTTCGCCATGGCTGCTCC
4
2
0.56
11
RM307
GTACTACCGACCTACCGTTCAC
CTGCTATGCATGAACTGCTC
4
3
0.40
12
RM13
TCCAACATGGCAAGAGAGAG
GGTGGCATTCGATTCCAG
5
3
0.52
13
RM413
GGCGATTCTTGGATGAAGAG
TCCCCACCAATCTTGTCTTC
5
4
0.56
14
RM31
ACACGATCCACTTTGCGC
TGTGTCTTGAGCAGCCAGG
5
2
0.36
15
RM3
ACACTGTAGCGGCCACTG
CCTCCACTGCTCCACATCTT
6
2
0.36
16
RM276
CTCAACGTTGACACCTCGTG
TCCTCCATCGAGCAGTATCA
6
3
0.55
17
RM11
TCTCCTCTTCCCCCGATC
ATAGCGGGCGAGGCTTAG
7
2
0.37
18
RM481
TAGCTAGCCGATTGAATGGC
CTCCACCTCCTATGTTGTTG
7
4
0.65
19
RM72
CCGGCGATAAAACAATGAG
GCATCGGTCCTAACTAAGGG
8
3
0.58
20
RM264
GTTGCGTCCTACTGCTACTTC
GATCCGTGTCGATGATTAGC
8
3
0.50
21
RM152
GAAACCACCACACCTCACCG
CCGTAGACCTTCTTGAAGTAG
8
3
0.56
22
RM242
GGCCAACGTGTGTATGTCTC
TATATGCCAAGACGGATGGG
9
3
0.57
23
RM316
CTAGTTGGGCATACGATGGC
ACGCTTATATGTTACGTCAAC
9
2
0.28
24
RM271
TCAGATCTACAATTCCATCC
TCGGTGAGACCTAGAGAGCC
10
3
0.57
25
RM21
ACAGTATTCCGTAGGCACGG
GCTCCATGAGGGTGGTAGAG
11
3
0.57
26
RM206
CCCATGCGTTTAACTATTCT
CGTTCCATCGATCCGTATGG
11
4
0.63
27
RM20
ATCTTGTCCCTGCAGGTCAT
GAAACAGAGGCACATTTCATTG
12
4
0.64
28
RM17
TGCCCTGTTATTTTCTTCTCTC
GGTGATCCTTTCCCATTTCA
12
3
0.55
Sl.No.
Forward sequence
Chr.
No.
Reverse sequence
bromide (0.5 μg/ml) in a gel documentation system
(BIO-RAD, USA).The reproducibility of amplification
products was compared twice for each primer.
SSR data analysis
The size of most intensely amplified fragments was
determined by comparing the migration distance of
amplified fragments relative to the molecular weight
of known size markers, 50 base pairs DNA ladder.
The SSR bands were scored manually for the presence
No. of
alleles
(1) or absence (0) across all the genotypes. Only
reproducible and clearly distinguished bands were
taken into consideration. Polymorphic information
content (PIC) value of a marker was calculated
according to a simplified version of (Anderson et al.,
1993).
PIC = 1-∑n j=1 P2ij
Where Pij is the frequency of the jth allele for the
ith marker, and summed over n alleles. Also,
145
Singh et.al.
average number of alleles, total heterosygozity
and average PIC value were calculated..The pairwise combinations of genotypes were employed
to calculate Jaccard’s similarity coefficient (GS)= a/
(n-d), where a is the number of positive matches,
n is the total sample size, and d is the number of
negative matches (Jaccard 1908). This matrix was
subjected to cluster analysis by the unweighted pairgroup method (UPGMA; Sneath and Sokal 1973)
and the dendrogram was constructed using the
SAHN module of NTSYSpc software package. The
dissimilarity matrix, genetic distances and cluster
analysis were performed by Numerical Taxonomy
and Multivariate Analysis system, Version 2.1
(NTSYSpc; Rolhf 1998).
Results and Discussion
SSR diversity and genetic relationship among rice
genotypes
The ninety-seven markers were used across the
seventy-six rice genotypes for their characterization
and discrimination. Among these twenty-eight
were polymorphic and used in present study. The
remaining sixty-nine were showing monomorphic
banding pattern and they were excluded. Altogether
79 alleles were detected at the loci of twenty-eight
microsatellite markers across 76 rice genotypes. The
number of alleles per marker locus varied from 2 to
4 with an average of 2.82 alleles per marker (Figure
2). The PIC values of the polymorphic markers
Figure 1. Separation of alleles on agarose gel followed by staining with ethidium bromide and visualized under UV light. PCR
product were amplified with SSR markers RM297(A), RM206 (B) , RM 413 (C). M is 50 bp DNA size marker and numbers 1-76
represent 76 rice germplasm accessions as described in Table 2.
146
Genetic diversity studies in rice (Oryza Sativa L.) using microsatellite markers
Table 2. Variation formorpho-physiological traits in seventy six rice germplasm accessions.
Sl.
No
Genotypes
Total
Filled
Days
Plant Panicle Ears Panicle
Grains Spikelet Test
Days to
Grains
to 50%
height Length per Weight
per
fertility Weight
Maturity
per
Flowering
(cm)
(cm)
Tiller
(g)
plant
%
(g)
panicle
(g)
74.0
103.0
114.61 11.95
7.07
2.44
60.02
69.28
86.63
24.69
1
Dular
2
FR13A
149.0
193.0
96.90
19.46
3
FR13B
161.0
196.67
107.34
4
Karkati 87
128.0
166.33
164.66
5
Birpala
159.33
197.33
102.42
6
Tetep
91.0
127.67
137.09
7
HeenSulai
139.0
147.0
161.37
8
Madal
154.33
173.33
138.51
9
MahaDikwee
153.0
172.67
10
Ausboro
94.0
123.0
11
Jaldungi
152.3
12
Nirboi
153.33
13
CR 1009
149.0
14
HouraKani
15
Naldak
16
Lunishree
17
18
8.28
3.03
95.98
108.25
16.65
7.49
27.21
14.73
3.17
89.64
3.69
142.33
11.99
7.91
2.29
71.31
6.74
5.45
1.75
23.32
12.12
3.44
11.77
5.37
2.40
193.66
18.13
10.07
142.38
10.81
5.03
194.0
140.43
22.46
191.33
142.26
18.14
187.33
97.11
10.10
154.67
192.0
122.83
154.0
182.0
144.07
146.0
185.67
137.42
21.85
Swarna Sub-1
131.0
182.0
84.24
Sambha Sub-1
123.33
162.0
85.78
19
Kariyawa
135.33
177.33
20
Godaheenate
127.33
21
S-155
71.33
22
TSAO
WANCHING
23
JC-1
24
Yield
per
Plant
(g)
11.14
88.66
21.15
17.48
100.60
89.11
14.91
17.32
156.03
91.22
27.82
29.39
82.79
86.20
20.61
11.58
52.95
66.74
79.38
18.44
7.45
144.34
155.02
93.16
22.44
22.88
79.35
87.76
90.42
24.41
11.97
2.81
88.64
95.95
92.40
14.73
17.93
1.73
46.46
58.31
79.73
24.57
6.92
11.59
3.19
102.57
113.15
90.68
18.02
20.48
10.28
2.66
96.65
104.99
92.06
12.79
17.21
6.32
2.14
66.33
75.89
87.45
12.95
9.19
9.54
4.99
2.13
54.51
69.42
78.51
16.97
7.83
12.44
5.74
2.57
77.20
87.38
88.39
32.59
11.39
9.16
3.57
98.83
108.72
90.91
19.34
20.43
18.79
11.73
2.01
90.02
98.16
91.71
11.69
19.43
23.07
12.17
2.74
120.28
143.80
83.61
11.69
24.02
168.67
30.54
15.89
4.15
164.48
194.96
84.41
24.81
32.0
172.67
174.63
19.54
11.99
3.18
108.85
125.30
86.91
21.73
19.63
107.0
78.22
13.12
7.56
2.85
80.67
109.33
74.28
17.66
12.77
59.0
104.67
107.94
15.99
8.80
2.89
95.33
108.33
88.33
22.42
15.44
72.0
104.0
137.17
30.89
14.88
4.31
152.52
157.67
96.91
22.63
32.45
Lumbini
114.33
104.33
169.44
31.74
14.74
4.63
205.08
224.00
91.61
17.04
34.63
25
Madhukar
75.00
105.67
93.15
12.78
5.32
2.06
76.07
116.83
65.19
20.42
10.87
26
N-22
59.67
104.67
118.29
24.84
14.88
3.12
138.78
143.74
96.57
23.89
26.18
27
Binulavan
62.0
108.0
123.78
24.68
13.55
3.27
105.68
134.44
78.79
17.29
24.18
28
Kala-rata 1-24
75.33
102.67
123.44
13.15
5.57
2.07
77.55
93.67
83.00
23.46
11.31
29
Tatan
121.33
169.00
130.25
12.96
5.49
1.89
71.24
92.67
77.54
19.37
11.017
30
Bapkaribuna
122.33
168.33
137.25
12.79
5.57
1.68
62.57
84.33
74.52
16.87
10.20
31
Cota
113.0
157.67
166.03
25.04
15.09
3.18
141.63
164.33
87.20
22.63
27.48
32
Khaijan
117.0
157.33
136.12
13.21
4.28
1.23
50.26
68.17
73.65
23.48
8.19
33
Kamnam
68.0
105.67
132.78
13.92
4.70
2.00
52.0
85.00
61.29
22.38
8.47
34
Lemoht
60.33
103.67
73.55
23.24
11.91
3.25
123.55
143.17
86.41
22.77
21.31
35
Latsika
60.0
100.33
89.57
17.25
6.84
2.74
91.62
105.00
87.29
20.84
14.42
147
Singh et.al.
36
A k i t a
Komachi
57.33
100.0
59.33
23.48
13.11
3.15
127.58
136.00
93.82
17.22
23.93
37
M-202
56.00
98.0
60.61
25.07
5.73
2.42
84.99
95.67
88.86
19.56
11.29
38
MR-Amroo
57.33
106.33
70.11
13.06
5.77
2.18
63.73
78.00
82.35
23.89
10.30
39
Nipponbare
55.00
104.0
57.92
14.67
5.52
2.64
74.14
90.0
82.41
20.91
12.45
40
AsamiDhan
73.0
106.0
109.36
19.07
7.25
2.55
89.78
152.74
58.79
27.53
16.71
41
Changhat
116.0
156.67
144.17
18.74
8.74
3.03
78.22
92.18
84.94
22.69
16.38
42
BadiKodi
120.33
153.33
148.69
18.48
9.71
2.59
85.32
108.67
78.71
23.19
18.18
43
Dub Celong
58.67
156.67
111.16
25.70
15.67
3.77
131.58
155.0
85.09
24.39
25.85
44
Savitri
58.0
150.33
99.35
27.18
17.27
3.94
141.99
155.87
91.30
17.81
27.58
45
AshuBhajna
56.0
122.0
140.88
25.63
13.27
2.97
141.24
161.50
87.52
16.51
26.40
46
Tundahiya
61.0
130.33
128.53
20.33
10.3
2.61
91.17
100.33
91.10
15.96
18.04
47
CB05-753-3
93.0
110.33
95.33
23.97
8.0
3.77
177.0
197.67
89.30
25.00
13.76
48
IR.73000-9886.0
1-2-1
105.67
95.50
26.17
6.0
3.75
137.0
150.0
91.09
21.73
10.29
49
Brown gora
101.0
97.27
25.60
6.0
3.64
77.67
88.67
87.23
23.83
18.04
50
IR.8291289.67
B-B-10
110.33
107.50
25.77
7.67
3.72
131.67
136.67
96.35
24.34
16.71
51
IR.8231076.0
B-B-67-2
96.00
103.67
28.67
7.0
3.92
140.33
160.67
87.36
24.76
23.36
52
UPRI 2012-16
89.0
IV7
109.67
130.67
27.67
8.67
4.16
170.33
187.33
90.82
20.12
20.11
53
CR.3488-1-288.33
1-2 IV7
109.67
115.67
25.67
6.67
3.62
142.00
157.0
90.39
22.23
15.27
54
IR.8291275.33
B-B-14
97.33
108.47
26.73
8.67
2.75
101.33
115.67
87.60
26.84
16.98
55
IR.8392680.67
B-B-71-4
101.0
123.43
25.43
8.67
2.74
143.67
150.33
95.33
24.54
18.64
56
CT.15678-2-387.33
3-1
108.33
102.63
25.73
10.67
3.49
172.0
191.0
90.12
21.99
21.29
57
B.10580E83.33
KN-28
106.67
113.40
27.17
7.33
4.86
171.67
185.67
92.44
31.08
24.11
58
IR.8263580.67
B-B-93-2
105.0
118.67
24.77
6.00
3.03
156.3
169.00
92.34
23.30
13.64
59
BVD.109
99.0
114.33
23.17
10.33
1.49
79.0
85.67
92.19
22.20
10.26
60
IR.71146-9781.33
1-2-1-3
102.33
109.60
23.83
6.67
3.51
150.3
161.67
92.96
20.33
7.39
61
IR.8263575.33
B-B-143-1
96.67
133.67
25.60
11.33
3.05
137.3
152.67
89.79
20.06
12.69
62
BAG .408-05
79.33
102.33
104.33
26.63
12.00
2.81
123.3
148.0
83.40
24.29
16.44
63
IR.8291282.33
B-B-2
103.67
115.90
27.47
9.67
2.81
87.0
97.33
89.28
26.06
13.51
64
IR.82912B-B-7
75.0
97.33
116.03
26.67
11.0
3.44
116.33
134.0
86.74
26.17
11.18
65
IR.839299B-B-132-3
76.67
95.33
99.33
20.47
4.67
3.41
84.0
124.00
67.24
31.14
5.26
80.33
79.00
148
Genetic diversity studies in rice (Oryza Sativa L.) using microsatellite markers
66
IRAT-112
74.33
100.33
129.27
29.83
9.67
3.21
137.0
162.33
83.17
19.98
17.83
67
IR.87756-202-2-3
75.00
96.0
104.50
26.73
9.33
3.83
135.3
156.33
86.59
15.04
12.95
68
IR.67017-1242-4
82.67
106.0
111.90
27.57
6.00
4.38
154.3
196.67
78.45
24.34
12.95
69
B.3688-TB25-MR-2
82.33
107.67
118.40
28.10
5.33
3.92
132.67
147.67
90.077
27.81
10.89
70
BP.19768-2-37-78-1-1-
81.00
102.67
127.30
24.47
6.67
4.08
111.3
127.00
87.61
30.16
15.86
71
IR.78933-B24-B-B-4-
86.67
106.33
135.90
28.13
7.67
4.84
143.67
176.67
81.31
24.91
23.66
72
BP.1351D-12-PK-3-1
76.00
97.0
124.50
27.23
6.00
3.25
134.33
168.33
78.32
23.24
15.37
73
RR.617-B-3-3
110.67
132.0
89.33
25.01
7.67
2.78
218.0
243.00
89.71
16.01
12.06
74
CR.3423-1
84.67
108.0
108.47
24.67
8.67
3.99
180.33
195.00
92.46
16.14
15.44
75
OR.1946-2-1
82.00
102.67
100.67
27.20
6.67
3.32
105.33
124.00
84.67
23.31
8.99
76
Kala bunde
102.33
124.67
121.33
27.20
7.0
4.55
161.0
189.33
85.27
24.83
23.05
Mean
95.32
128.34
118.16
21.64
8.85
3.08
113.11
130.76
85.90
21.64
16.71
C.V.
1.57
1.77
3.94
8.02
16.68
13.83
13.73
12.55
4.99
3.21
15.16
S.E.
0.8644
1.31
2.69
1.00
0.85
0.25
8.97
9.48
2.48
0.40
1.46
Range Lowest
55.0
95.33
57.92
6.74
4.28
1.23
46.46
58.31
58.79
11.69
5.26
Range Highest
161.0
197.33
193.66
31.74
17.27
4.86
218.0
243.00
96.91
32.59
34.63
ranged from 0.267 (RM 316) to o.654 (RM 481) with
an average PIC value of 0.47. The markers RM 413,
RM 481, RM 206 and RM 20 produced a maximum of
four alleles. These findings are Conformity with the
earlier reports of (Sajib et al., 2012, Singh et al., 2013
and Thomson et al., 2006). Clustering of germplasm
accessions based on 28 polymorphic markers
produced two major clusters at the dissimilarity
coefficient of 0.26 that is Cluster I and II. Cluster I
further differentiate in to two sub- clusters viz. IA
and IB. Sub cluster IB further differentiated in to two
mini clusters viz. IB-i (4) and IB-ii was monogenic(1).
Sub-cluster IA also differentiated in to two mini
clusters viz. IA-i and IA-ii (2). Cluster IA-i had two
clusters IA-ia (5) and IA-ib (8). Cluster II also further
differentiated in to two sub-clusters viz. IIA and IIB.
Cluster IIB includes IIB-I (3) and IIB-II was monogenic
(1). Cluster IIA consists of two mini clusters IIA- i
(48) and IIA-ii (4) germplasm accessions. Jackarsd’s
similarity matrix was used to generate a dendogram
to obtain the clustering of genotypes (Figure 2) The
Jackard dissimilarity coefficient value shows close
to 1 indicates maximum similarity and the values
close to ‘0’ show maximum dissimilarity. Highest
similarity was found between cultivar CB05-753-3
and Tundahiya (0.94) , followed by cultivar Brown
gora and IR.73000-9 (0.840. The highest dissimilarity
was found between cultivar B.3688-TB and IR.670171(0.1935) followed by cultivar Badi Kodi and
Changhat (0.3333), and between cultivar IR.82912-B
and BAG .408-0 (0.3784) indicated that these were
genetically diverse germplasm accessions and may
be directly used in hybridization programme for
yield improvement. The total average of dissimilarity
coefficient of all 76 cultivar is 0.70.
Morphological
accessions
variations
in
rice
germplasm
Eleven morphological and yield related traits were
recorded for assessment of phenotypic variability
among the 76 rice germplasm. The germplasm used
in the present study showed significant phenotypic
149
Singh et.al.
Figure 2. UPGMA dendrograme based on Jaccard’s similarity coefficient showed the clustering of 76 rice germplsm accessions.
150
Genetic diversity studies in rice (Oryza Sativa L.) using microsatellite markers
variation for all the characters analysed. The basic
statistical analysis of the results with respect to yield
and yield associated traits are presented in Table 2.
There was wide range of variation in a present set
of material. Maximum number of effective tillers per
plant was recorded for Savitri (17.27) while minimum
number of effective tillers per plant was for Khaijan
(4.29). Days to maturity was found maximum in
Birpala (197 days), while minimum in IR. 839299-BB-132-3 (95 days). A large variation was observed in
plant height which ranged from 57 cm (Nipponbare)
to 193.66 cm (Maha Dikwee). Panicle length has also
shown a large variation ranging from 6.73 (Tetep)
to 31.74 (Lumbini). A large variation in filled grain
per panicle and total grain per panicle was ranged
from 46.45 (Ausboro) to 218 (RR.617-B-3-3) and
58.31 (Ausboro) to 243 (RR. 617-B-3-3) respectively.
Spikelet fertility was recorded maximum in JC-1
(96.91) and minimum in Asmidhan (58.79). The
grain yield per plant was found highest in Lumbini
(34.63g) followed by JC-1(32.4g) and karkati (29.39g).
Significant variation was also observed for days to
50% flowering, ear per tiller, panicle weight and test
weight. Chouchan et al (2014) and Singh et al (2013)
also observed highest morphological variation for
leaf width, plant height, panicle length, filled grain
per panicle, number of total grain per panicle, spike
fertility, test weight, yield per plant and lowest for
leaf length and number of effective tiller per plant.
Conclusion
The present study revealed a wide variation among
the germplasm accessions. The result indicated that
the SSR marker is neutral and co-dominant and could
be a powerful tool to assess the genetic variability
of cultivars. The PIC value indicates that all these
markers were highly informative and capable of
distinguishing between genotypes. The total average
of dissimilarity co-efficient of all 76 cultivar is
0.70. The highest dissimilarity was found between
cultivar B.3688-TB and IR.67017-1(0.1935) followed
by cultivar Badi Kodi and Changhat (0.3333), and
between cultivar IR.82912-B and BAG .408-0 (0.3784)
thus, these accessions were genetically diverse
and could be directly utilized in hybridization
programme for improvement of yield related traits
or to execute efficient selection in highly segregating
generations.
Acknowledgement
Authors are thankful to Department of Biotechnology,
Government of India for financial support (Grant no.
7/473).
References
Arunachalam V (1981) Genetic divergence in plant breeding.
Indian J Genet Plant Breed 14: 226-236.
Bidhan Roy (2013) Genetic Diversity in Farmers’ Varieties and
some Advance lines of aromatic rice (Oryza sativa L.) from
West Bangal. Indian J. Plant Genet. Resour. 26(3): 215-219.
http://www.indianjournals.com/ijor.aspx?target=ijor:ijpgr
&volume=26&issue=3&article=004
Devi CB, Lal GM, Singh CM and Yadav P (2012) Genetic
architecture, interrelationship and path analysis for
yield improvement in Exotic rice (Oryza sativa L.)
IJAEB 5(4):387-392. http://www.researchgate.net/profile/
Chandra_Singh14/publication
Doyle JJ and Doyle JL (1987). A rapid DNA isolation procedure
for small quantities of fresh leaf tissue. Phytochem Bull
19:
11-15.
http://www.citeulike.org/user/echinotrix/
article/678648
Jaccard P (1908) Nouvellesrecherchessur la distribution
florale. Bull Soc Vaud Sci Natur.44:233-270. http://www.
oalib.com/references/7972071.
Sajib M Abdul, Hossain Md. Musharaf, Mosnaz ATMJ Hossain
Hosneara, Islam Md. Monrul, Ali Md. Shamsher. and
Prodhan Shamsul H. (2012) SSR marker- based molecular
characterization and genetic diversity of aromatic
landraces of rice (Oryza sativa L.) j. BioSci. Biotech. 1(2):
107-116.
Singh A, Singh B, Panda K, Rai VP, Singh AK, Singh SP,
Chouhan SK, Rai V, Singh PK and Singh NK, (2013).
Wild rices of Eastern Indo-Gangetic plains of India
constitute two sub –populations harbouring rich genetic
diversity. POJ 6(2): 121-127. http://www.pomics.com/
singh_6_2_2013_121_127.pdf.
Vung O, Lal CY and Rai PHC (2012). Studies on genetic
diversity in rice (Oryza sativa L.) Journal of Agricultural
Technology 8: 1059-1065. http://www.ijat-aatsea.com/pdf/
v8_n3_12_may/24_IJAT_2012_Gabriel%20M.pdf.
Journal article with DOI
Chouhan SK, Singh AK, Singh A, Singh SP, Singh NK and
Singh PK (2014) Agro-Morphological Diversity in Wild
151
Singh et.al.
Rice Accessions of Easter Indo-Gangetic Region of India.
Bangldesh J. Bot 43(30):334-347. http://dx.doi.org/10.3329/
bjb.v43i3.21607
Rolif FJ (1998) On applications of geometric morphometrics
to studies of ontogeny and phylogeny. System Biol 47:147158. http://dx.doi.org/10.1080/106351598261094
Kulsum MU, Hasan MJ, Begum H, Billah MM and Rahman H
(2011) Genetic diversity of some restorer lines for hybrid
rice development. Bangladesh J. Agric. Res 36(1): 21-28.
http://dx.doi.org/10.3329/bjar.v36i1.9226
Singh Abhishek, Singh AK, Shama Parveen and Singh PK
(2013) Studies on Genetic Characteristic of Upland Rice
(Oryza sativa L.), International Journal of Agriculture,
Environment and Biotechnology 6(4): 515-520. http://dx.doi.
org/10.5958/j.2230-732x.6.4.025
Mandel JR, Dechaine JM, Marek LF and Burke JM (2011)
Genetic diversity and population structure in cultivated
sunflower and a comparison to its wildprogenitor,
Helianthus annuus L. Theor Appl Genet 123: 693-704. http://
dx.doi.org/10.1007/s00122-011-1619-3
Books
Ministory of Agriculture (2014) Annual Progress Report.
Government of India.
Sneath PHA and RR Sokal (1973) Numerical Taxonomy.
Freeman, San Francisco, C.A.
152


© Copyright 2026