
Making Strategy: Learning by Doing Harvard Business Review by Clayton M. Christensen
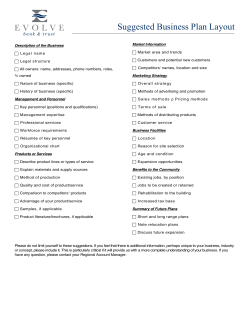
Making Strategy:
Learning by Doing
by Clayton M. Christensen
Harvard Business Review
Reprint 97602
HarvardBusinessReview
NOVEMBER-DECEMBER 1997
Reprint Number
HUGH COURTNEY, JANE KIRKLAND
AND PATRICK VIGUERIE
STRATEGY UNDER UNCERTAINTY
97603
JON R. KATZENBACH
THE MYTH OF THE TOP MANAGEMENT TEAM
97604
CONSTANTINOS C. MARKIDES
TO DIVERSIFY OR NOT TO DIVERSIFY
97608
DOROTHY LEONARD
AND JEFFREY F. RAYPORT
SPARK INNOVATION THROUGH EMPATHIC DESIGN
97606
BEHNAM TABRIZI AND RICK WALLEIGH
DEFINING NEXT-GENERATION PRODUCTS: AN INSIDE LOOK
97610
RICHARD PASCALE, MARK MILLEMANN
AND LINDA GIOJA
CHANGING THE WAY WE CHANGE
97609
IDALENE F. KESNER
AND SALLY FOWLER
HBR CASE STUDY
WHEN CONSULTANTS AND CLIENTS CLASH
97605
ANDREW CAMPBELL
AND MARCUS ALEXANDER
THINKING ABOUT…
WHAT’S WRONG WITH STRATEGY?
97601
ABRAHAM ZALEZNIK
HBR CLASSIC
REAL WORK
97611
MANAGER’S TOOL KIT
MAKING STRATEGY: LEARNING BY DOING
97602
BOOKS IN REVIEW
IS THERE A BEST WAY TO BUILD A CAR?
97607
CLAYTON M. CHRISTENSEN
MICHAEL MACCOBY
MANAGER’S TOOL KIT
Making Str ategy:
Learning by Doing
With practice and the right process,
executives can develop a core
competence in strategic thinking.
BY CLAYTON M. CHRISTENSEN
to review yesterday’s
Itlistis sobering
of great corporate strategies:
Ford’s mass production of standard
automobiles; General Motors’ adoption of vertical integration and design of cars tailored to the preferences of customers in each tier of the
market; Xerox’s strategy of selling
copies rather than copiers; and
Sears’s sales of reliable, reasonably
priced merchandise through stores
located in growing suburbs. Guided
by brilliant strategies, these companies rose to prominence. Yet when
conditions in their competitive environments changed, each found it
extraordinarily difficult to change
strategic direction.
Although companies find it difficult to change strategy for many
reasons, one stands out: strategic
thinking is not a core managerial
competence at most companies. Executives hone their management capabilities by tackling problems over
and over again. Changing strategy,
however, is not usually a task that
managers face repeatedly. Once
companies have found a strategy
that works, they want to use it, not
Clayton M. Christensen is an associate professor at the Harvard Business
School in Boston, Massachusetts. He
is the author of The Innovator’s
Dilemma: When New Technologies
Cause Great Firms to Fail (Harvard
Business School Press, 1997).
ARTWORK BY KURT VARGO
Copyright © 1997 by the President and Fellows of Harvard College. All rights reserved.
MANAGER’S TOOL KIT
m a k i n g s t r at e g y : l e a r n i n g b y d o i n g
change it. Consequently, most management teams do not develop a
competence in strategic thinking. In
fact, they are unable even to see the
need to change direction when the
strategy that made the company
great has become obsolete.
Indeed, companies are increasingly outsourcing strategic planning.
Disappointed with the high cost and
low productivity of their internal
strategic-planning staff, they are
leaning on consulting firms for advice on strategic direction rather
than developing strategic thinking
as a core competence for their senior
executives.
This article presents a methodology executives can employ to conceive and implement a creative and
coherent strategy themselves. More
important, managers can use the
methodology repeatedly to reassess
the organization’s direction, thereby
cultivating both their competence in
strategic thinking and their understanding of how strategic decisions
connect to the market.
The Challenge of Redefining
and Implementing Strategy
Managers face two particularly vexing challenges in developing and implementing competitive strategies.
The first is to ensure that the strategy is not a reflection of the biases
(and possibly ignorance) of the management team – biases that are likely
to be rooted in the organization’s
past successes. The second challenge is to ensure that once a company has outlined a viable strategy,
it allocates resources in a way that
accurately reflects the strategy. In
other words, the strategy must mirror the realities of the company’s
environment, and the resource allocation process must mirror the
strategy. But such alignment rarely occurs. The formal processes and
de facto mechanisms for formulating and funding projects to develop
new products, processes, and services
usually are separate from strategyformulation processes. And the personal, political, and institutional
factors that often heavily influence
the process of strategy development
are frequently disconnected from
the realities of the marketplace.
4
Butterfield Fabrics, a £350 million
British manufacturing company,
provides a case study that shows
why senior managers’ efforts to
make strategy often prove difficult
and ineffective – and how these difficulties can be overcome.1 Butterfield
is the largest producer in Europe of
coated and laminated fabrics. But in
1995, amid a growing market, the
company’s sales were stagnant.
More nimble competitors were outflanking Butterfield’s high-margin
specialty products, and lower-cost
rivals were seizing market share in
the standard price-competitive end
of its product line.
Worse, Butterfield’s costs were rising, owing in part to its aggressive efforts to develop new products. But
the products it had launched in recent years lacked imagination. None
had been big hits. Although sales of
new products offset declining receipts from aging ones, the increase
in manufacturing overhead required
to manage the company’s proliferating offerings was hammering profits.
Sound familiar? Butterfield’s business is unique, but its problems are
not. The company had sought profits
and growth by expanding into many
segments of the coated-fabrics market but now found itself bested by
more focused competitors nearly
everywhere it competed. Butterfield
had never formalized a strategy, but
it clearly had one: to reap the
economies of scale, scope, and reputation that come from being the
largest competitor in its industry.
Nearly everyone in the company
could describe that as Butterfield’s
strategy, and its investments in new
products and services
were consistent with
that theme. But clearly, by the mid-1990s
the strategy was no
longer working.
Anxious to fix the
company’s problems,
Butterfield’s senior executives – its
president and its vice presidents for
operations, engineering, sales and
marketing, and finance – organized
a weekend retreat to hammer out a
new strategy. The retreat didn’t turn
out as expected, however. Although
the executives approached the event
with real resolve to define the road
back to corporate health, they could
not agree about what should be
done. Manufacturing attributed the
company’s cost problems to the expanded product line and wanted to
hack back unprofitable products. Finance wanted more products to
lever the company’s fixed costs.
Marketing saw a big opportunity to
make customized products but despaired of taking advantage of it because product engineering was so
slow. And engineering complained
that it couldn’t finish projects because marketing was always changing requirements in midstream and
clogging the development pipeline
with far more projects than it had
the capacity to handle.
The managers were not pointing
fingers at one another. Rather, they
were voicing honest views based
on the data they confronted every
day. Unable to agree on how to resolve the company’s problems, the
executives concluded that they were
trying to be too detailed in their
approach. Instead, they crafted
a statement intended to serve as a
guide to those in the company who
were making decisions closest to the
action. It read: “The strategy of Butterfield Fabrics is to develop and
profitably produce value-added fabric products of singular quality for
leading customers throughout Europe. By targeting significant growth
applications, we will strengthen our
position as the largest competitor in
the markets we serve.”
The result? One year later, despite
extraordinary effort by those executives to improve the company’s for-
Managers must identify the
driving forces affecting
their company’s health.
tunes, little had changed. The strategy was essentially a high-level
compromise designed to accommodate the executives’ differing views,
and it served its purpose all too well:
Butterfield continued to accommodate many more requests for new
products than the engineering group
harvard business review
November – December 1997
m a k i n g s t r at e g y : l e a r n i n g b y d o i n g
could handle, a wider range of products than the manufacturing organization could manage, and a more diverse set of customers than sales and
marketing could understand.
What happened at Butterfield Fabrics will resonate with many executives who are eager to revitalize their
companies’ fortunes. Yet coming up
with a coordinated, detailed strategy
to achieve that goal – a strategy offering explicit guidance about what the
company will and will not do and
one that everyone subscribes to – is
extraordinarily difficult. This tool
kit outlines a three-stage method for
addressing that difficulty. The first
stage is to define clearly the fundamental issues the company’s strategy must address. The second stage is
to formulate the strategy itself. And
the third stage is to create a plan for
managing the many projects through
which the strategy can be implemented. Guided by an outside facilitator, a management team can work
through these stages in a few days of
intense work.
Stage One: Identify the Driving
Forces in Your Company’s
Competitive Environment
Defining the problem correctly is
the first and most important action
to take in any problem-solving
process. Indeed, the business world’s
graveyards are filled with organizations whose executives implemented elegant answers to the wrong
questions. That is particularly true
in strategy formulation.
The first stage in developing a useful strategy, therefore, is to identify at a fundamental level the root
causes of the issues the company
needs to address. These are driving
forces – the economic, demographic,
technological, or competitive factors
in the company’s environment that
either constitute threats or create opportunities. When a management
team rigorously defines the driving
forces that the company faces, it is
much easier to identify and unite behind a clear strategic course of action
to address them.
A management team must take
two steps to define driving forces.
First, the group must generate hypotheses through a process of brainharvard business review
storming. Second, it must test and
develop a deeper understanding
about the hypotheses through a
process of diagramming how the
forces actually work – a process
called mapping.
Brainstorm the driving forces.
To generate ideas about the driving forces effectively,
you must assemble a
team consisting of the
company’s senior executives and selected
managers representing each of the organization’s functional
groups. Then nominate factors –
technological, competitive, demographic, regulatory, economic, or organizational – that might be driving
forces. Write each idea on a sheet of
paper and post the sheets on the conference room walls. Discuss each
idea as it is nominated, so that everyone understands it. In true brainstorming spirit, don’t reject any
ideas just because they don’t fit the
conventional wisdom. Groups that
spend one or two hours brainstorming typically generate 50 to 60 ideas.
Once you’ve exhausted the possibilities, you’ll find that many of the
ideas are similar. Take time to shuffle them around, placing ideas that
relate to the same topic or theme together in a cluster. In general, 60
ideas will fall into 10 to 15 clusters.
Next, divide into teams of three to
four people. Assign several clusters
of ideas to each team, and ask each
team to write a single statement that
summarizes the ideas in each cluster. These summary statements constitute the group’s initial hypotheses
of what the driving forces are – they
make explicit the assumptions that
key employees have about the problems and opportunities your company faces. Almost always, however,
these hypotheses are the manifestations of deeper causal forces. So the
next step is to probe more deeply, to
determine why or how these forces
have arisen and to understand
specifically how they will affect the
company and its competitors.
Map the driving forces. Mapping is
a visual, iterative tool for discovering the root cause of a phenomenon
affecting your company. You’ll want
November – December 1997
MANAGER’S TOOL KIT
to divide your group into small
teams again and have them draw
maps for the driving forces summarized earlier. Although mapping is
more a lear ned art than a rigid
methodology, the management
group’s task is the same as that of
any scientist attempting to develop
Mapping is a visual tool
that makes managers’
assumptions explicit.
a theory or model to make sense of
complex phenomena. Many scientists work inductively by carefully
observing phenomena and then
questioning why something appears
one way in certain circumstances
and a very different way in others.
The scientist will develop an explanatory theory about his or her observations and then will test the
model in a variety of different circumstances to strengthen or disprove the hypothesis.
A team attempting to map a driving force should approach the challenge the same way. The members
should search for the two or three
factors that could bring about the
hypothesized result and plot those
factors on the axes of a diagram or
matrix. Teams then should use the
model to see if it explains very different data in their environment. They
should continue until they are convinced that they understand why the
expected result is likely to occur and
what could change to produce a different outcome.
For instance, one of the hypothesized driving forces at Butterfield
Fabrics was “Several competitors
can profitably undercut Butterfield’s
most aggressive prices.” Certainly,
Butterfield’s strategy would need to
address this factor. But to define the
problem so that the company’s strategy would attack its root cause and
not merely its symptoms, the team
needed to understand what allowed
those competitors to undercut them.
The team made an initial try at
mapping the causal mechanisms: it
plotted cost on the vertical axis and
scale of production on the horizontal
5
MANAGER’S TOOL KIT
m a k i n g s t r at e g y : l e a r n i n g b y d o i n g
axis and drew a downward-sloping
cost curve. It positioned Butterfield
at the lower end of the curve, reflecting the group’s belief that there were
inherent economies of scale in the
industry and that Butterfield, as
the industry’s largest player, ought
to have its lowest costs. But then, to
“That makes sense,” called out
another team member. “But the map
says they can produce at costs equal
to ours. The driving force says they
can profitably undercut us. Which is
true, and why?”
The production scheduler had an
answer. “The map is right as far as
direct product costs go.
But with all the variety in
our plant these days, I bet
Butterfield’s burden rate
is 40% higher now than
it was ten years ago. All
those setups and clean
ups, interrupting long
runs to do short orders,
the extra scrap we produce at the beginning and
end of every run, all the expediting
and accounting. We have a highercost operation than the one we ran
ten years ago, when we focused on
fewer products.”
He then plotted a cost curve higher than the original one, drew an arrow up to it from Butterfield’s original position, and said, “This is it.
This is the driving force. We’re here,
with high overhead, on a cost curve
based on old technology. They’re
down there, on a flatter curve, using
new equipment with simpler, more
focused operations.” (See the graph
“The Final Driving-Force Map.”)
The team studied the chart and
agreed that it felt right. Then the
team’s leader wrote a new, more accurate explanation over the drivingforce map: “Butterfield’s costs are
high relative to competitors because
new technologies enable cost-effective manufacturing at low volumes,
and because of the complexity of
managing our broad product line
with our present configuration of
plant and equipment.”
Butterfield’s managers initially
summarized a second driving force
as, “Our largest customers are
threatening to integrate backward
and do their own laminating.” In
mapping that hypothesis, the team
sought to understand why and under
what circumstances the customers
had an incentive to do that work. Its
initial map suggested that once a
customer’s volume surpassed a certain level, it could bring lamination
in-house cost-effectively. But the
When the process of
mapping is complete, the
implications for strategic
action are usually obvious
to the entire team.
the team members’ puzzlement,
they found themselves plotting their
most price-aggressive competitors
as three red points at the same
height on the map but at lower volumes. If the supposed economies of
scale existed, how could those small
players enjoy such low costs? (See
the graph “Butterfield’s First Attempt to Map a Driving Force.”)
After some discussion, an experienced salesman in the team reflected, “You know, they haven’t always
been down there. Five years ago, we
didn’t see them pricing like this on
big, standard orders. I think they
used to be up here.” He took the red
marker and drew three arrows down
from the high end of the curve to the
points where the competitors were
currently positioned. “Why have
they been able to do that?”
The vice president of manufacturing suggested an explanation. He
noted that a new German coating
machine was on the market. It was
smaller and faster than the equipment Butterfield used and required
far less set-up time for changeovers.
Since Butterfield didn’t need the extra capacity provided by the machines, it hadn’t seriously considered them. He took the marker and
modified the shape of the curve. “I
can check with the German company’s rep to verify it,” he said, “but if
our competitors bought some of the
new machines a couple of years ago,
it would really flatten that curve
out.” (See the graph “Changing the
Map to Reflect Greater Insight.”)
6
map didn’t hold up to the data: some
very large customers seemed content to continue sourcing from Butterfield, whereas other much smaller ones repeatedly threatened to do
the laminating themselves. After
classifying customers from several
angles, the team found an answer:
Many customers purchased fabric in
volumes above the minimum needed for efficient in-house manufacturing. But the greater the effort a customer was making to cultivate
just-in-time production capability,
the greater the noise it seemed to
make about bringing lamination inhouse. After completing its map, the
team defined the driving force as,
“Trends toward just-in-time production and just-in-time deliveries will
push some customers toward laminating their own fabrics if suppliers
are not available.”
Mapping in this way has two important advantages. First, it frees
management from the tyranny of
numbers. Often, task forces attempt
to measure the phenomena that the
Butterfield team had mapped: the
exact cost added by the growing
product line, the true slope of the
cost curves, and the fully allocated
operating cost per unit of the German equipment. Such attempts frequently derail over disagreements
about what the exact numbers are,
and much time and energy is spent
getting all the numbers right. In contrast, mapping allowed Butterfield’s
management to focus on and agree
about what was going on at a conceptual level, and then to collect
data only on those aspects of the
analysis for which conclusions
would hinge on more precise data.
Second, mapping requires managers to make their assumptions –
and the implications of those assumptions – explicit through the diagrams, which, in turn, enable the
team members to achieve consensus
more easily. The words and numbers
that make up many strategy documents often mask serious misunderstandings about assumptions.
It takes a management team about
two days to define and map driving
forces. Because mapping requires the
team to think deeply about the issues confronting the business, many
harvard business review
November – December 1997
m a k i n g s t r at e g y : l e a r n i n g b y d o i n g
Butterfield Fabrics
♦♦♦
B
competitors
low
less
more
Manufacturing scale
Changing the Map to Reflect
Greater Insight
high
old cost curve
impact of
German
equipment
♦
♦
new cost curve
♦
♦♦♦
Butterfield Fabrics
B
competitors
low
less
more
Manufacturing scale
The Final Driving-Force Map
“Butterfield’s costs are high relative to competitors because new technologies
enable cost-effective manufacturing at low volumes, and because of the complexity of
managing our broad product line with our present configuration of plant and equipment.”
high
old cost curve
Cost
Strategy formulation involves three
steps. First, you need to brainstorm
ideas for what needs to be done and
devise initiatives for each driving
force. Second, you have to plot those
initiatives on a matrix to get a sense
of how they fit together. Third, you
must create maps that make explicit
how each functional group in the organization will contribute to achieving the strategy.
Brainstorm about strategy. Because brainstorming about strategy
must focus on addressing the driving
forces, it is helpful first to rank them
in order of their importance. Team
members should begin with the
most important force, brainstorming about what the company might
do to protect itself against – or take
advantage of – each driving force.
The ideas generated here are not
meant to be high-level, abstract
strategic concepts. Rather, they
should be specific and action oriented. Each idea should be written on a
Post-it note and stuck on the map to
which it relates. Creative groups can
harvard business review
high
Cost
Stage Two: Formulate
Strategy That Addresses
the Driving Forces
Butterfield’s First Attempt to
Map a Driving Force
Cost
of the insights it gains are counterintuitive. Nevertheless, when mapping is complete, the implications
for strategic action usually become
obvious to the entire team. Rather
than rush quickly into strategy making, however, I have found it better
for managers to ensure that all affected parties in the company understand and agree on the driving-force
maps. That often means taking a
break for three or four weeks. During
that time, managers who were not
part of the process can be included,
maps can be altered to reflect new
input, and data can be collected
where necessary. This process is particularly necessary in global corporations, where managers on the
scene may see the world quite differently from strategists at headquarters. When a management team is
united in its understanding of the
problems to be tackled, agreeing on
and implementing solutions is
much more straightforward. Creating this shared understanding is always a good investment.
MANAGER’S TOOL KIT
impact of
German
equipment
new cost curve
♦
♦
impact on overhead
of broad product line
♦
♦♦♦
Butterfield Fabrics
B
B
competitors
low
less
November – December 1997
Manufacturing scale
more
7
MANAGER’S TOOL KIT
m a k i n g s t r at e g y : l e a r n i n g b y d o i n g
often generate 20 or 30 specific, useful ideas for addressing each of the
driving forces.
When brainstorming has finished,
the driving-force maps should be divided among the small teams. The
teams should group the ideas pasted
on each map into related clusters
and draft a statement that summarizes the ideas in each cluster. Often,
the ideas cluster most naturally
around functional areas.
At Butterfield Fabrics, for example, brainstorming generated 35
ideas for grappling with the challenge posed by the company’s cost
disadvantage. The team responsible
for this problem clustered those
ideas into five groups and drafted
higher-level statements that summarized the strategic actions implied by the ideas:
n Segregate the machines in our current plant into three or more “factories within a factory,” each focusing
on a specific set of products.
n Convert our manufacturing capacity to equipment that incurs reduced
set-up and wastage costs.
n Open a small plant close to the
customer in regions with local volumes sufficient to keep a new machine utilized.
n Implement an activity-based accounting system for product costs.
n Develop expertise in fast setup
and changeover on the new machines so that we can offer fast response with an even broader, more
customized product line than we do
today – without suffering our current penalty on costs.
Of these proposed initiatives, only
the fourth had been considered be-
strangling the organization. When
they saw how small, focused plants
and the ability to do low-cost
changeovers could alter the economics of variety, however, they recognized that they could parlay the
company’s scope into a strength in
product-line breadth
that
competitors
could not match.
For the second driving force, the Butterfield team concluded
that the company
could not keep up
with customers’ needs for just-intime deliveries if it continued to
serve Europe from a single plant in
the southwest of England. It was
clear that to counter the threat of
customers’ doing their own laminating, they would need two additional
plants on the Continent, near centers of automobile manufacturing.
While generating strategic initiatives, some teams may disagree
about what to do. Such disagreement is usually the symptom of a
poorly defined driving force. It is
wise to stop arguing about what to
do and instead ask if there is a driving force that the team has not yet
defined behind the problem.
At Butterfield, a dispute arose
about whether the company should
outsource a costly insulation material or continue to make it themselves. When the team realized it
had not defined a driving force to
guide the company on this issue, the
members stopped arguing about
what to do and instead began discussing the forces that drive decisions about whether or not to outsource. They developed a
map describing the conditions that would be
necessary for outsourcing
to make sense. In doing
so, the course of action
became clear to everyone: it would be better to
outsource the insulation material.
Create a strategy matrix. One concern with developing strategy in this
manner is that the actions required
to address one driving force might
contradict the actions required to
tackle another. To guard against
that, the group should next create a
A strategy matrix shows
how the company might
address each driving force.
fore. The others emerged as possibilities because the problem, as described in the driving-force map, had
been made clear. The fifth initiative,
in particular, was a surprise to everyone in the group. Many in the company had concluded that Butterfield’s broad product line was slowly
8
strategy matrix such as the one
shown in the chart “An Excerpt
from Butterfield’s Strategy Matrix.”
The strategy matrix is built by listing the driving forces at the top of
each column, in order of priority.
The major functional groups in the
The process for allocating
resources across projects
must mirror the strategy.
company are listed to the left of each
row. The statements of strategy that
the teams have devised to address
each driving force – such as the five
statements listed above for Butterfield – can then be inserted into the
appropriate cells of the matrix.
As the excerpt from Butterfield’s
matrix suggests, not every cell will
have ideas in it. But once the matrix
is complete, managers can read
down the columns to get an overview of what the company’s strategy might be for addressing each
driving force. It is helpful for the
group not just to discuss the sensibility and feasibility of the initiatives listed under each column but
also to examine the empty cells – to
be sure the group has thought
through how each of the functions
needs to contribute to the strategy.
Just as important, by reading across
the rows managers can get an
overview of the functional strategies
that will be required to address the
complete set of driving forces successfully. The ideas in each cell
should be discussed and refined, using the driving-force map as the
standard for evaluation. During this
review, the initiatives in the cells of
a given row need to be compared to
one another to ensure that they are
mutually consistent and to resolve
any contradictions.
The strategy teams should also
summarize what each row and column tells them about the strategy.
At the right end of each row, they
should write a short statement summarizing the functional strategy for
each group in the company; and in
the cells at the bottom of each column, they should summarize the
harvard business review
November – December 1997
m a k i n g s t r at e g y : l e a r n i n g b y d o i n g
MANAGER’S TOOL KIT
An Excerpt from Butterfield’s Strategy Matrix
Functions in the Organization
Driving Forces
Other
driving
forces
Summary
statements of
each function’s
strategy
Driving force 1
Driving force 2
“Butterfield’s costs are high
relative to competitors because
new technologies enable
cost-effective manufacturing at
low volumes, and because of
the complexity of managing
our broad product line with our
present configuration of plant
and equipment.”
“Trends toward just-in-time
production and just-in-time
deliveries will push some
customers toward
laminating their own
fabrics if suppliers are
not available.”
Manufacturing
Divide plant into three
“factories within a factory,”
each focusing on a few
product families. Buy German
equipment to reduce set-up
and waste costs in
low-volume products.
Develop ability to
manufacture and deliver
just in time from plant in
southwestern England.
Design systems in new
Continental plants to facilitate just-in-time scheduling.
Develop ability to
manufacture and
deliver just in time
from plant in southwestern England
and from new
Continental plants.
Marketing and
Sales
Broaden product line further as
soon as process capability and
plant configuration are ready.
Use ability to deliver
just in time to capture
more business.
Use ability to
produce a broad
line and deliver it
quickly to expand
market share.
Business
development
Where local volumes are
sufficient, open small
regional plants that are
close to the customer.
Build two focused plants
near auto-manufacturing
centers on the Continent.
Build two focused
plants near
auto-manufacturing
centers on the
Continent.
Finance and
Accounting
Implement an activity-based
costing system.
Quality and
Process
engineering
Develop expertise in fast setup
and changeover on existing
and new equipment to handle
greater variety without
suffering cost penalties.
Summary
strategy for
each driving
force
Develop and exploit the
capability to manufacture
cost effectively at low volumes.
Product
engineering
harvard business review
November – December 1997
Develop and exploit
the ability to produce
and deliver just in time.
9
MANAGER’S TOOL KIT
m a k i n g s t r at e g y : l e a r n i n g b y d o i n g
company’s strategy for addressing
each driving force. These statements
are hypotheses for what the strategy
might be. Just as managers gain a
deeper understanding of driving
forces by mapping their initial hypotheses, they can gain much richer
insight into what the strategy
should be, and how to implement it,
by mapping the strategy matrix
summaries.
Map the functional strategies.
Well-constructed strategy maps free
managers to think at a deep but conceptual level about what needs to be
done; thus they do not get entangled
in premature discussions of how to
do that. The maps provide a clear, visual way to make managers’ assumptions explicit in a manner that
words and numbers cannot. Because
strategy is generally implemented
through functional groups, I have
found it most helpful to begin this
process by drawing maps of the functional strategies – the summary
statements at the end of the rows in
the strategy matrix.
You employ the same methods to
map strategy as you do to map driving forces. Teams begin by drawing
a blank matrix on a flip chart and
then identifying the two most important mechanisms that will have
to be manipulated to implement the
strategy. Those mechanisms define
the horizontal and vertical axes of
the map. As in mapping driving
forces, teams will usually need to go
through several iterations before
they arrive at a map that reflects
deep understanding.
Consider Butterfield’s decision to
outsource the insulation material. In
mapping their supply chain strategy,
the management group noted that
outsourcing the material would be
hard to do because making lining
fabric adhere to the insulation fabric
was an art that depended on weather
conditions, on which manufacturer
had supplied the yarn used to weave
the insulation fabric, and on a host
of other factors that were not easy
for the operators to describe. It typically took several years of experience before skilled operators understood how to tweak various process
controls to adjust for the complex interactions between fabrics and adhe10
sives. The team concluded that outsourcing the insulation material under these conditions would fail because operators would have little
understanding of the materials they
were working with.
The solution involved two mechanisms that emerged as the team
worked on its strategy map. The first
mechanism, knowledge, constitutes
the verticle axis of the graph “Outsourcing with Competitive Advantage.” For outsourcing to be feasible,
the company needed to be able to
measure precisely the insulation
material’s important characteristics
and to tell suppliers the specifications they needed to meet in the materials they supplied. Butterfield
needed to transform an intuitive art
into a science-based knowledge of
how and why the components in
their system interacted as they did.
It would gain that knowledge by
initiating a series of experiments to
understand how different environmental factors, various attributes of
the fabrics, and different formulations of adhesives interacted in the
lamination process. This project
would be the mechanism the company would employ in order to implement its strategic objective of
outsourcing the insulation fabric. It
is described by the vertical movement from “Butterfield 1995” to
“Butterfield 1997” in the graph.
While discussing this strategy, the
vice president of marketing commented, “The books on the subject
say that our strategy needs to build a
sustainable competitive advantage
for us. I don’t see how outsourcing
this material does that – in fact, it
probably does the opposite.” To explore that concern, the business development director stepped to the
flip chart and plotted the company’s
competitors – an important analytical step in creating a strategy map.
He noted that they were already outsourcing the fabric. “But I don’t believe they’re any smarter than us,”
he concluded. “I’m quite sure that
each one has a sole-source relationship with a different supplier of the
fabric. I bet it’s because they don’t
have an understanding of how their
fabrics and adhesives work together.
They manage this problem by using
only one type of fabric, from one
supplier.” He marked the competitors’ positions near Butterfield’s, in
the lower-lefthand corner of the
map. The second mechanism was
still undefined.
His marketing colleague then proposed what it might be. “You know
what we need? If we can understand
how all these variations in the adhesives and fabrics cause so much variation in our products, we might be
able to design an adhesive and a
process that is really robust – ideally,
a single proprietary adhesive that
would allow us to source insulation
fabric from a range of suppliers and
still get reliable lamination. Talk
about competitive advantage! We
could almost design custom products for each customer if we had access to a variety of fabrics. If we had
the technology, doing that wouldn’t
be too complex from a process viewpoint.” She then sketched the horizontal axis of the strategy map. The
mechanism for getting to the point
where the company could offer a
wide range of insulation fabrics, or
“Butterfield 1999,” was the development of a robust adhesive. The technical feasibility of the project was
unclear at this point, but the company’s strategy would be to try to make
it happen.
“And do you know what?” she
continued. “This advantage should
be sustainable because we’re the
only company in the industry large
enough to afford our own R&D department. The small guys are completely at the mercy of their adhesive suppliers – and they use such
small amounts that the suppliers
have no incentive to develop custom
adhesives for them.” She then drew
a brick wall on the map next to Butterfield’s competitors, depicting the
group’s belief that competitors could
not copy Butterfield’s strategy.
The purchasing manager then
wrote a statement at the top of the
map that summarized what the
mapping process had revealed: “Our
core competence will be a deep understanding of the interactions
among our processes and the materials we use. With this understanding,
we will be able to outsource a larger
proportion of the fabrics we use, en-
harvard business review
November – December 1997
m a k i n g s t r at e g y : l e a r n i n g b y d o i n g
MANAGER’S TOOL KIT
Outsourcing with Competitive Advantage
“Our core competence will be a deep understanding of the interactions among our processes
and the materials we use. With this understanding, we will be able to outsource a larger proportion
of the fabrics we use, enabling us to offer much greater variety to our customers.”
Scientific
Science-based
understanding of
how processes
and material
interact
Butterfield
1999
Company can source
from outside suppliers
and offer many
insulation fabrics
Knowledge
Butterfield
1997
Company can
source from
outside suppliers
Butterfield
1995
Company must
produce its own
fabric; offers single
insulation fabric
Intuitive
Trial-and-error
understanding of
the process
competitors
A
B
C
size/affordability
barrier
Works with one insulation fabric
Works with many fabrics
Material (Adhesive)
abling us to offer much greater variety to our customers.”
Other teams developed a similarly
insightful understanding of their
slice of the strategy as they attempted to diagram how they would implement the initiatives suggested on
the strategy matrix.
There is nothing magic about the
process of mapping. It produces no
automatic insights. But like the
strategy matrix and the driving-force
maps, it allows a management team
to visualize and debate how its
members’ various organizations
need to interact in order to create the
sustainable advantages that good
strategies must achieve. In the case
above, the map began as a purchasing-strategy initiative that had been
defined in the strategy matrix. But
by the time the mapping process
forced the team to ask what mechanisms it would have to employ to
achieve that strategy, it had integrated the roles of purchasing, R&D,
marketing, and manufacturing.
Stage Three: Create a Plan
for the Projects to Implement
the Strategy
The final stage in the driving-forces
harvard business review
method of strategy making is to develop a plan that defines specifically
how money and manpower must be
spent over time to implement the
strategy. Too often, elegantly conceived strategies fail to help a company because managers do not define the projects throughout the
organization that are required to implement high-level statements of
strategy. And even when specific implementation projects are proposed,
daily decisions about which projects
have the highest priority and which
get what share of the company’s resources can easily become inconsistent with strategy because of inertia,
politics, and conflicts between
short-term and long-term needs.
Strategic change, whether derived
through a process of mapping driving forces or some other means, can
only be implemented if management uses a deliberate mechanism
to ensure that the process used for
allocating resources across projects
mirrors the strategy. To help management teams translate strategy
into action, I have used aggregate
project planning, a tool described by
Steven C. Wheelwright and Kim B.
Clark in “Creating Project Plans to
November – December 1997
Focus Product Development” (HBR,
March-April 1992).
Aggregate project planning helps
managers to specify the types of projects that they will have to initiate
and complete in order to implement
their strategies. Indeed, attempting
to depict a strategy as a stream of
new product, service, and processdevelopment projects typically informs a management team about
how much useful guidance its strategy actually offers.
Senior executives do not need to
know the detailed requirements for
any specific project. But if the management team is serious about implementing the strategy, it needs to
reserve the capacity – in terms of
people and cash – to execute the
stream of projects that will implement each strategic initiative. The
team should have a rough idea of
what it wants these projects to
achieve, how big they will be, what
sorts of risk they entail, and in what
sequence they need to be initiated
and completed. Ensuring that the
projects critical to the strategy
match the organization’s capacity is
the team’s final reality check on the
feasibility of the strategic plan.
11
MANAGER’S TOOL KIT
m a k i n g s t r at e g y : l e a r n i n g b y d o i n g
Competence in Strategy
Good management teams are deeply
competent when it comes to preparing annual operating plans and delivering the numbers called for in those
plans. Why? Because they confront
these tasks over and over again.
Managers develop ways of thinking
and working that make them very
effective in meeting those recurring
challenges.
A company’s executives can actively cultivate a deep competence
in strategic planning by engaging in
such planning over and over again. It
follows that management teams
need to engage in strategy making
themselves. Occasionally, analyses
of particularly vexing issues might
12
be outsourced to consulting firms or
to planning groups within the company. But developing a competence
in strategic thinking requires that
senior line managers take personal
responsibility for developing the key
strategic insights that will guide the
company. By definition, managers
cannot develop competencies in activities that they outsource.
The process of defining and periodically reassessing driving forces
and the strategies required to address them must be repeated in a
way that is not perfunctory. If companies make these tasks an integral
part of their annual planning process, their managers will become
competent strategic thinkers. If
management teams habitually re-
solve disputes about strategic action
by stepping back to define the underlying driving forces, they will develop a competence in linking strategy
to the realities of their market. And
if strategy and innovation are tightly
linked through the annual aggregateproject-planning process, senior
managers will develop a competence
in implementing strategic change.
1. The name of the company and some of the
details about its business have been disguised.
The author would like to thank Steven
C. Wheelwright, the M.B.A. Class of
1949 Professor of Business Administration at the Harvard Business School.
Many of the techniques described in this
article are based on his original ideas.
Reprint 97602
To place an order, call 800-988-0886.
harvard business review
November – December 1997


© Copyright 2026