
How to EasyEstimation EasyEstGRM EasyNominal Ryuichi Kumagai
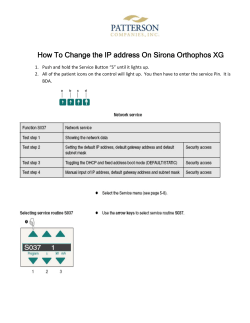
How to EasyEstimation
EasyEstGRM
EasyNominal
Ryuichi Kumagai
Tohoku University
2013/04/30
1
1. Run “EasyEstimation.exe”
Select options.
2013/04/30
2
2.1 Check unidimensionality
1. Drag & Drop “Data File”.
Data File is “txt format”.
See the attached “SampleData.dat”.
2. Input Settings
- Column of ID located. (“1” in SampleData)
- Number of Characters of ID.
(“5” in SampleData)
- Column of Response located.
(“7” in SampleData)
- Character of Omit response.
(initial value “P” )
3. Click “Read Data” button.
Output File is named automatically.
(Initial value is “Data File name + OneF.csv”)
You can change that name directly.
2013/04/30
3
2.2 Check unidimensionality
If you want to change ItemID, Drag & Drop “ItemID File” here.
“ItemID File” is text file that recorded one ItemID per one line.
(See and rewrite the attached “ItemID.dat”.)
2013/04/30
2. Click “OK” button.
1. Select items which you use in analysis.
- Click item directly to change “USE” or “Not USE”.
- Four buttons are available.
4
2013/04/30
2.3 Check unidimensionality
If data format is appropriate , it displays
that "OK" and number of items.
2013/04/30
1. Click “Start !” button.
5
2.4 Check unidimensionality
Scree plot form tetrachoric matrix.
Output File
[Basic Statistics]
itemID, Prob., P.BIS
item001, 0.57800, 0.48927
item002, 0.78100, 0.47749
………
Mean of Test, 11.80700
SD of Test , 4.34347
alpha
, 0.84870
[Eigen Value]
Number, EigenValue
Eigen00001, 8.97742
Eigen00002, 0.98833
Eigen00003, 0.93806
2013/04/30
6
3.1 Estimation item parameters
1. Drag & Drop “Data File”.
Data File is “txt format”.
See the attached “SampleData.dat” or
“SampleDataMG.dat” ( multi group file).
This part is same for “check unidimensionality”.
2. Select the model.
- 1-, 2-, 3- parameter logisitic model.
Option of Multiple Groups.
- Number of Groups.
(“2” in “SampleDataMG.dat”)
- Column of Group Variable.
(“7” in “SampleDataMG.dat”)
- Digits of Group Variable.
(“1” in “SampleDataMG.dat”)
3. Click “READ DATA” button.
Output File is named automatically. (Initial value is “Data File name + Result.csv”)
You can change that name directly.
2013/04/30 : Check “Output Parameter File”. Output to “Data File name + Para.csv”.
Recommend
7
3.2 Estimaton item parameters
If you want to change ItemID, Drag & Drop “ItemID File” here.
“ItemID File” is text file that recorded one ItemID per one line.
(See and rewrite the attached “ItemID.dat”.)
If you want to fix the item parameter, Drag & Drop “ItemFIX
File” here.
“ItemFIx File” is same format for item parameter file.
(See and rewrite the attached “ItemFIX.dat”.)
Item parameter are fixed.
1. Select items which you use in analysis.
- Click item directly to change “USE”
or “Not USE”.
- Four buttons are available.
2. Click “OK” button.
2013/04/30
8
3.3 Estimation item parameters
If data format is appropriate , it displays that
"OK" and number of items.
1. Click “Start !” button.
2013/04/30
9
3.4 Estimation item parameters
Result File
itemID, slope, slopeSE, location,locationSE, asymptote, asymSE
Item001, 0.61801, 0.05039, -0.36379, 0.07072, 0.00000, 0.00000
Item002, 0.74631, 0.06211, -1.29263, 0.09510, 0.00000, 0.00000
………
[Post Distribution]
Group 1
theta,
prob.
-3.97462,0.0000453642
-3.70925,0.0001137232
………
[Summary]
** P.BIS,BIS: The focal item data is not contained in total score.
itemID, tried,
PCT, P.BIS,
BIS
Item001,
1000, 0.57800, 0.39551, 0.49921
………
Item parameter File
Item001, 0.61801,
Item002, 0.74631,
Item003, 1.08217,
Item004, 1.20555,
………
2013/04/30
-0.36379,
-1.29263,
0.26018,
1.22252,
0.00000
0.00000
0.00000
0.00000
10
4.1 Estimation examinees parameters
1. Drag & Drop “Data File”.
Data File is “txt format”.
See the attached “SampleData.dat”.
This part is same for “check unidimensionality”.
3. Select the method of estimation.
2. Drag & Drop “Item parameter File”.
Item parameter file is created by 3.1
Estimation item parameters section.
2013/04/30
11
4.2 Estimation examinees parameters
Methods.
MLE
- Maximum Likelihood Estimation.
- Option “Correct to All “1” (or “0”) examinees” .
When you check this option, item which has most highest slope parameter is treated as 0.5 correct and 0.5
wrong in all success (“1”) or fail (“0”) response examinees.
MAP
- Maximum A Posteriori
- Prior distribution is Normal (You can change the Mean and Variance).
EAP
- Expected A Posteriori
- Prior distribution is given by “Prior Distribution File (NDIST.dat)”.
POPULATION
- In this option, population distribution is estimated.
- Prior distribution is Uniform.
PV
- Plausible value.
2013/04/30
12
4.3 Estimation examinees parameters
2. Select items which you use in analysis.
1. Click “Start !” button.
3. Click “OK” button.
2013/04/30
13
5.1 ICC and Test Information
1. Drag & Drop “Item parameter File”.
Item parameter file is created by 3.1
Estimation item parameters section.
2. Select ICC (Item Characteristic Curve) or
Test Information.
2013/04/30
14
5.1 ICC and Test Information
Item Characteristic Curve
Changing to next or previous item.
This button outputs the csv file that is aimed to line graph in another software ( ex. Microsoft EXCEL).
15
2013/04/30
5.1 ICC and Test Information
Test Information
Select the items.
Go to Graph Window.
2013/04/30
16
6 EasyEstGRM
EasyEstGRM
- Graded Response Model
- GUI and usage rule are same for EasyEstimation.
2013/04/30
17
7.1 EasyNominal
EasyNominal
- Nominal Response Model
- GUI and usage rule are same for EasyEstimation.
(EasyNominal doesn’t have the following matters,
a) checking unidimensionality
b) ItemFix mode in parameter estimation.)
2013/04/30
18
7.2 Decision of theta direction in
EasyNominal
We have to decision theta direction in parameter estimation of
nominal response model.
Inversion of theta direction.
2013/04/30
19
Thank you !
Ryuichi Kumagai
Graduate School of Education
Tohoku University
[email protected]
2013/04/30
20


© Copyright 2026