
Document 219741
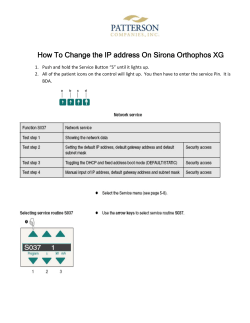
Director’s Station:
Hands-On Training + How To’s
Montana Shared Catalog ([email protected])
Montana State Library
1515 East Sixth Ave., Helen, MT 59620-1800
http://www.msl.mt.gov/For_Librarians/Montana_Shared_Catalog/default.asp
Directors Station MSC Page
http://www.msl.mt.gov/For_Librarians/Montana_Shared_Catalog/Director's_Station/default.asp
Instructor: Hannah Nash ([email protected])
Miles City Public Library
th
One South 10 St., Miles City, MT 59301, Ph: (406) 234-1496
www.MilesCityPublicLibrary.org/
Logging in & Dashboard
Take a moment and enable pop-ups in your browser.
http://mscds.mt.gov/directorsstation/default.aspx
Takes you to the Dashboard
Organize My Folder
Logout
To access reports, My Folder, and
support Docs, click on the left
SirsiDynix taskbar.
Tip: Password can be changed in My Profile located in My Folder.
Creating a Report
Step-by-Step Current Checkouts Report
Click on the SirsiDynix left Taskbar.
Collection Analysis
Public Services folder
Circulation
All Checkout Measures (Current).
The selected template will fill the screen. Click on the left Taskbar or anywhere
on the screen to remove the folder listing.
Basic Report Components- Terminology
Dimensions
The different variables used to filter a report (located in the green pool on the
upper half of the screen).
Creating a Report—Continued
Measures
The output of the report. Once Dimensions are set, select Measures to limit
output. To change your measures, click on the dropdown arrow next to
Measures and select or de-select the options you want.
Dimensions in the Active
Report area.
Data displayed dynamically
as you adjust Dimensions
and Measures.
Creating a Report—Continued
Move the Dimension buttons by left-clicking and dragging on the whole button
(aim for the words)
As long as you do not release the left
mouse button, you can move the
Dimension.
Dimensions can be moved from the green pool above to the Active Report area
below.
Wait until the word Swap
appears
Select the Home Location dimension from the green pool above.
Drag the Home Location down to where Library is displayed in the Active Report
area.
Hover over Library until the word “Swap” appears. Once this appears, then release.
The Home Location will replace the Library button and the Library button
returns to the Dimensions pool.
Creating a Report—Continued
Tip: Setting Dimensions from the pool can be very effective, as it presents a
cleaner-looking report, however, you can only choose ONE option from the
list if you leave the Dimension in the pool.
To Set Dimensions in the Pool
Select your library by clicking on
the down arrow next to Library.
After selecting, click on Accept
to lock-in the selection.
The report below will
automatically adjust to your new
settings.
Tip: You can set ONE option in as many different Dimensions in the above
pool as you want.
Creating a Report—Continued
To Set Dimensions in the Active Report area
Click on the down arrow next to Home
Location below to change the location options.
Once finished, click on Accept.
Limit Dimensions the Easy Way
After clicking the down arrow click on the ALL
underlined heading with your hand. This will
minimize the list.
Remove the check and then click on the ALL
underlined heading with your hand one more
time. The list will expand with all of the checks
removed. Now check what you want.
Creating a Report—Continued
Piling Dimensions
Select the User Profile button from the Dimensions Pool and drag down to
Dimensions list at the bottom left. Hovering over the Home Location button, you
can choose to “Insert Above”, “Insert Below” or “Swap”.
You can drag down more Dimension options from the Pool above and add them to
the tiered list.
To keep your report cleaner, set Dimensions from the pool above (like the
Library button earlier). To cancel Dimensions set in the pool, open the
dimension, place the dot in the “ALL” at the top, click Accept.
Creating a Report—Continued
Clicking on the underlined All User Profile will expand the Dimension into
your library’s user profile list, with current statistics for each profile. Any
underlined item can be expanded further this way.
Creating a Report—Continued
Total Line
The total line (in bold going along the top of the report data) can be omitted or
added.
Click on the down arrow
next to the dimension
you want. Remove (or
add) the check from the
top underlined “ALL”
box.
The top box will be empty
but will turn green. Click
Accept to close the
Dimension box.
Creating a Report—Continued
Setting Measures
Remove extra measures from your report to clean up the appearance of the
statistics. Click on the down arrow on the Measures button. Select or deselect your measures. Click on Accept.
Saving Your Reports
Saving Reports
All saved reports are kept in My Folder, accessible from the left taskbar.
Click on the Save button at the top of the screen. The Save As dialog box
appears (see below).
Tip: Rename Report
Take a moment to give your report
a unique name in the Report
Name box. Click Accept.
Add to SwiftLinks:
This option makes the report visible
in the Dashboard
Using the List Titles Function
How to List Titles
Now that your report is complete, you can get a list of titles pertaining to your
report.
Example: Current Checkouts Report, narrowed by Library in the dimensions
pool, and a specific Due Date selected, September 15, 2006.
Once the report is set, highlight the statistic you would like a title list from. A
drop down menu appears, click on List Titles.
Tip: The List Titles function
can list up to 1,000 titles in
the formatted boxes,
exporting to Excel will show
the complete list beyond
1,000.
Using the List Titles Function—Continued
The Title List—Formatting
After clicking on List Titles the Title List will appear in a different Internet
Explorer window.
Using the List Titles Function—Continued
The Title List—Formatting
At this point you have some options:
1.
To Export the list into Microsoft Excel, click on Export.
2.
If you want to leave it in the nice format, right click in the middle of the
page and select Print (make sure to adjust your printer page orientation to
accommodate the format of the list). You can also right click in the middle
of the page and choose Select All, then Paste the information into a blank
Word document and manipulate and Print.
Exporting & Printing Report Data
Exporting to Excel
Click on the Export button at the top of the screen
At this point you can Open the file, and then Save it to your computer for
further use. Opening brings up Microsoft Excel with your data in a
spreadsheet.
Printing Directly from Director’s Station
Click on the Preview button on the top of the screen. The statistics appear in
a new Internet Explorer window. Click on Print. Before you can send the
report to your printer, a popup reminds you of the paper orientation.
From the Preview window you can:
* Assign Page Breaks
* Change paper size (based on your printing options)
Creating Attractive Charts & Graphs
Selecting Stats to Display in a Chart or Graph
Generate a report; use your cursor to highlight the
statistics you want converted into a graph/chart
by clicking in the bottom right hand corner of the
number you want and dragging upwards towards
the left. The boxes change to a yellow color.
Once the area is highlighted a drop down menu
appears. From this menu, click on Chart
Selection.
A bar graph or chart
automatically
appears in a new
Internet Explorer
window.
Creating Attractive Charts & Graphs—Continued
Manipulating Your Charts & Graphs
Your graph/chart can be manipulated in the following ways:
1.
To change the appearance of your graph (pie, line, 3D, etc.) click on
Menu and select Chart Types. After clicking on the chart type you
want, the new chart appears in the window.
2.
To change the size of your graph/chart, maximize the Internet Explorer
window. Click and drag on the top/bottom or left/right sides of the
graph/chart square. The chart or graph can also be shrunk in this fashion.
3.
To change the appearance of the bar graph, click on Menu in the upper
left hand corner. Select Modes. This allows you to change some of the
settings in your graph.
Creating Attractive Charts & Graphs—Continued
Saving & Printing Graphs/Charts
To SAVE the bar graph and insert it into Word, Excel or Publisher documents,
right click in the middle of the graph and choose Save Picture As. Save it as
a bitmap (*.bmp).
Using Graphics in Word
Open up a Word Document, add a
title and any other information at
the top.
Click on Insert at the top. Select
Picture and then From File.
Locate your file and click OK. The
picture will appear in your Word
Document.
Finalizing Graph & Chart Labels
Modifying Graph/Chart Labels for Clarity
Labels are based on cataloging settings. To create more user-friendly labels, insert
text boxes into your Word Documents (make sure to have the settings FILL to the
color white, and NO LINE) and type in the text/labels you want, then place the text
boxes over the labels embedded into the charts.
Original Pie Chart
Modified Pie Chart
County Residents
City Residents
Tip: Increase the font size for your labels for easier reading and clarity.
“City Residents” as a label makes better sense than RES-CITY.
Finalizing Graph & Chart Labels
Modifying Graph/Chart Labels for Clarity—Cont.
Try creating your own Legend to clarify labels for your audience. Insert numbers on
top of the stat columns or pie sections corresponding to the Legend.
Original Bar Graph
Modified Bar Graph
Legend
1
2
3
4
5
1
Fiction
ILL
Juvenile Fiction
Non Fiction
Young Adult Fiction
3
2
4
5
Miles City Public Library—Current Checkouts
September 17th, 2008
Legend
1
2
3
4
5
3
466
Fiction
ILL
Juvenile Fiction
Non Fiction
Young Adult Fiction
1
412
2
11
4
187
5
69
Tip: Add your statistics numbers right to your bar graph or pie chart. Or try
adding a percentage number and real world language, which helps when
explaining your graphs to folks outside of Library services.
Sources & Thanks
Sources
All screen shots are from SirsiDynix Directors Station software, build 3.8.7.1
TM2004-2006, associated training manual and upgrade release notes. Questions
about this training may be addressed to the instructor.
Thanks
Thank you to the MSC Staff who assisted with this training: Sarah McHugh and
Jennie Stapp. Thank you to the Miles City Public Library staff and director who
encouraged this training and supported the trainer 100%. Thank you to the Miles
Community College library staff and director who hosted the first Directors Station
training.
Montana Shared Catalog
http://montanalibraries.org/MSC/MLNmsc-home.htm
SirsiDynix
http://www.sirsidynix.com


© Copyright 2026