
Combining XRF and XRD for Mineralogical Problem Solving
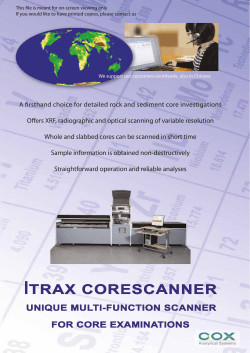
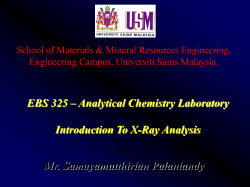
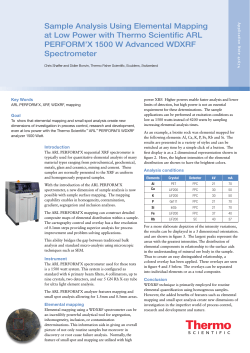
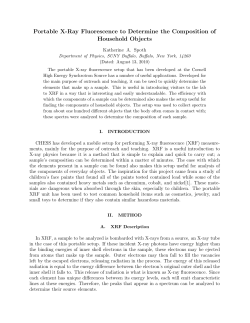
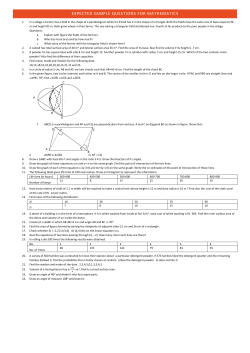
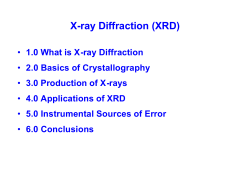
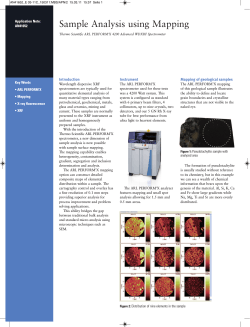
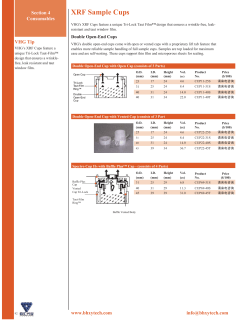
MAGGI LOUBSER AND SABINE VERRYN
229
Combining XRF and XRD analyses and sample preparation
to solve mineralogical problems
Maggi Loubser and Sabine Verryn
X-ray Analytical Facility, Department of Geology, University of Pretoria, Pretoria, 0002, South Africa,
e-mail: .sabine.verr>'[email protected]; [email protected]
© 200B September Geological Society of South Africa
ABSTRACT
X-ray Fluorescence Spectroscopy (XRF) has reached the stage where it is classified as a mature analytical technique. The theoretical
principles are well understood. In addition modern instrumentation demonstrates enhanced generator and temperature
stability. High sensitivity is possible even for light elements and effective matrix correction software is available to the modem
day spectroscopist. Apart from its continued applications in researcli and development. XRF has become u routine prcjcess control
tool.
X-ray Powder diffraction (XRD), on the other hand, has with minor exceptions as in the cement industry, largely remained
a research tool, despite being an older analytical technique than XRF XRD has progressed significantly in the past decade from a
mainly qualitative technique for the identification of crystalline materials to a quantitative tool with the advance of more powerful
software packages. This software has improved instrument control, but also quantification and structure determination using the
Rietveld method. Consequently, XRD is rapidly entering the process control environment.
In this paper the authors demonstrate, with practical examples from different industrial applications, how combined XRF and
XRD use can provide truly quantitative phase analyses. XRF is used to verify XRD data and visa versa.
The data obtained in this study clearly illustrate the value that can be added to either technique if XRF and XRD data are used
together, and indicate some applications in routine process co.
Introduction
A research laboratory like the X-ray Analytical Facility of
the University of Pretoria is exposed to a wide range
of materials. Housed by the Geology Department,
minerals and ores are routine matrices, but in
collaboration with the Department of Metallurgy and
Material Science and the Institute for Applied Materials
as major users, the laboratory is exposed to many
diverse material types. The laboratory is frequently
approached by industry regarding problems that
commercial laboratories cannot solve, or where high
accuracy analysis on specialised matrices is needed.
This creates some unique problems that can not always
be solved by any single analytical technique and the
combined use of XRD and XRF analysis proves an
efficient way to solve problems.
X-ray Fluorescence Spectroscopy is used to
determine the bulk chemical composition of a sample.
Fundamental parameter software like UniQuant™
(Thermo Fisher Scientific Inc. 2006), enables the
qualitative and quantitative analysis of an unknown
sample with or without sample preparation. Elements
from fluorine to uranium in the periodic table can be
analysed with detection limits varying from 0.5 ppm for
heavier elements like Mo to 100 ppm for the lightest
element F. With the fundamental parameter approach,
everything in the sample is analysed to enable accurate
matrix corrections. The software allows for manual input
of elements not determinable by XRF, like carbon,
oxygen and hydrogen in different compounds and this
data is then used in the matrix correction model.
For higher accuracy, matrix matched calibration curves
can be set up for specific matrices with specific sample
preparation protocols followed. Examples of calibrations
used most often will be shown below.
X-ray Powder Diffraction is used to determine the
crystalline phaseCs) present in a sample. As each phase
has a unique powder diffraction pattern, it is possible to
distinguish between compounds as the diffraction
method is sensitive to crystal structure and not just
composition. The powder diffraction pattern fcjr the
spinel MgAliO., looks different from the powder pattern
of periclase (MgO) and corundum (Al,O,) mixture
although a chemical analysis may show identical results.
It is also possible to distinguish between different
polymorphic- forms of the same compound. Additionally,
the intensity of each component's pattern is proportional
to the amount present.
Examples of problems encountered where the use
of both techniques is of advantage include validation of
results when XRF data do not add to 100 ± 1.5% without
obvious reasons. XRD can confirm the phases present,
e.g. carbonates that are not visible to XRF or a mixture
of components with differing oxidation states. XRF
determines total iron and / or titanium, but for matrix
correction purposes adds stoichiometric amounts of
oxygen according to the most common oxidation states.
In the case of mixtures of hematite and magnetite or
illmenite and rutile, this could lead to erroneous resuits.
The analysis of slag and refractory materials are other
examples where additional XRD information is crucial to
successful analysis. Slag samples often contain traces of
metal. The XRF software either assigns oxTgen or treats
a sample as a metal, and consequently mixtures pose
problems. In addition, sulphur and silicon are of the few
elements that show a peak shift in XRF depending on
SOUTH AFRICAN JOURNAL OF GEOLOGY. 2008. VOLUME 11 1 PACÍE 229-238
doi;10.2ll.';/Rssajn.l 11,2-3.229
230
COMBINING XRF AND XRD ANALYSES AND SAMPLE PREPARATION
the oxidation state (Willis and Duncan 20081 If a system
was sel Lip using oxide materials and a .sulphide »r
silicon nieial is analysed, a peak shift will lead to
erroneous results, XRD can easily be used to identify
these prohlems.
Metal inclusions also pose serious risks to routine
sample preparation procedures, as major element
analysis is usually determined on fused lithium borate
lieads. Metals, exposed to platinum ware at elevated
temperatures, form low melting ligands that react
with the platinum laboratory- wart- (Lupon el al.
1997). Sulphide bearing materials have the same
tendency.
In these cases XRD is used to identify possible
deleterious elements in the sample and also to confirm
that al! metals and .sulphides were oxidized during pretreattnent before fusion.
Analytical procedures
XRF
Bulk sample preparation consists of drying where
necessary, crushing to 10mm, riffle splitting and milling
in a tung.sten carbide milling pot to ca. 80% below
75 |xm. When Co and W analysis are specifically
requested a carbon steel milling vessel is used. For XTíD
contamination from milling vessels is only a factor when
material harder than that of the grinding medium is
milled and here comndum as well as Si-carbides have
been observed to be problematic,
Special sample preparation techniques liave l>een
developed
for non-routine materials. Sulphide
containing materials have to 1^ prepared with special
care as sulphides are not soluble in lithium I'Kirate fluxes
and damage the platinum ware (Lupon et al. 1997).
These samples have to be pre-oxidised while retaining
the sulphur quantitatively as SO,,. This is accomplished
by using Litliium nitrate (LiNOj), 0.5g of sample is
thoroughly mixed with 3g of LiNO^ and placed on a bed
of (3g) LÍ2B,,O7and covered with the remaining (3g) flux.
This \sandwich" teclinique protects the platinum against
un-oxidised sulphides and at the same time the flux lid
helps to prevent the escape of any SO. gas. The mixing
of sample and oxidant is crucial to facilitate complete
oxidation. The pre-reaction is done at much lower
temperatures than suggested in the literature (Sear L G,
1997), as it was found that ,sulphur is lo.st when
oxidation reactions are executed at temperatures alxïve
the dissociation of LiNO, (600X). A method was
developed where the sample is pre-reacted for an hour
in a muffle furnace at 500"C, above the melting
temperature of LiNO« but below the dissociation
temperature. The reaction was evaluated using
Differential Scanning Calorimetiy (DSC) and XRD to
evaluate the reaction and confirm completion of the
oxidation, before heating to 1000"C for the fusion to take
place.
Maj(.)r element analyses are executed on fused beads,
following a method adapted from H. Bennett and G.
Oliver's proposed methods (1992 ). 1 g pre-roasted
sample is added to 6g of lithium letraborate (LÍ2B,O7)
flux mixed in a 5% Au/Pt crucible and fused at lOOCC
in a muffle furnace automated fluxer (Beadmaster F-M4).
A mouldable crucible is used .so that, on removal from
the furnace, the bead is fast cooled in the caicibte of
which the hottom surface is analysed. This approach has
the advantage, that should there be undissolved
material, it is al! retained in the bead which can be reiiielted.
Metal bearing samples, like industrial refractory
materials where a brick / metal interface exists, as well
as modern refractory materials where metallic particles
and graphite are added for increased strength, need
special preparation. The same preparation methods are
used for slag samples where metallic residues are often
present. To prepare these samples for XRF analy.sis, a
pre-oxidation step using nitric acid (HNO,). is used as
roasting was Ibund to be ineffective. Roasting forms a
oxidised layer t)n the outer surface of the particles,
protecting the inside against further reaction and. when
dissolved by the ilux during fusion, tlie metallic residue
is brought into direct contact with the platinum crucible.
The method used is as follows: lg sample is weighed
directly into a platinum crucible and 5ml of a
50% aqueous HNO, solution is added. The mixture is
heated slowly on a hot plate until all reaction ceases and
dries. Then 6g of lithium tetraborate flux is added on top
and fused at 1000*'C as usual. As roasting could ni)t be
used to determine the lo.ss or gain on ignition, the fused
bead is weighed, and the difference in sample mass
before and after oxidation is calculated.
Trace elements are analysed on pressed powder
briquettes, after an adaptation of the method described
by Watson (1996), using a saturated solution of polyvinyl
alcohol 40-88, as liinder. The mixing of the sample and
!ilnder is accompüslied in a plastic zip-lock bag. 20 g of
75 |xm powder is mixed with a few drops of polyvinyl
a!coliol and pressed al a pressure of 20 ton/cm' for two
minutes in collapsible aluminium holders for mechanical
support, using a polished piston. The sample is then
dried at llO^C before analysis.
The instrumentation used is an ARL 9400XP+
Wavelength dispersive XRF Spectrometer with a
Rliodium tube, LÍF200, LÍF220, GER. AXO6 (a 50Â
synthetic multilayer) and PKT analysing crystals, with a
f!ow proportional and scintÜlation detector, l^ata
reduction is performed using three different software
approaches: WINXRF using the COLA algorithm
(Lachance and Claisse, 1980) with theoretical a!phas
deduced from fundamental parameters, for matrix
correction of fused bead major elements as well as
Samples are dried at UO^C (Weight 1) and roasted at
1000"C (Weight 2), to determine the percentage loss on
ignition (LOI) using the following equation:
Weighty - Weight,
%LOI
XlOO
Weight, -
SOUTH AFRICAN JOURNAL OF GEOLOGY
231
MAGGI LOUBSER AND SABINE VERRYN
Table 1. Instrumental panimeters for Majors program.
Analyte
"26
SiKa 1,2
109.01
TiKa 1.2
86-17
Crystal
detector
Coilitnator
Tîme
("divergence)
Interference
PET
0.6
(s)
20
H^est
LÍF200
0.15
20
-
FPC
PET
0.25
20
Br
cone. (%)
kV/mA
100
30/80
FPC
AlKol.2
144.619
3.77
100
50/50
30/80
FPC
FeKa 1,2
57.5IH
LÍF200
FPC
0.15
20
Mn
50.00
50/50
MnKa 1,2
62.973
UF200
0.25
20
Cr
0.35
50/50
19.878
FPC
AX06
0.60
100
43.51
30/80
MgKa 1,2
FPC
CaKa 1,2
113.086
LÍF200
23-993
FPC
AX06
KKal,2
136.637
FPC
LÍF200
PKal.2
140.952
NaKal,2
Zr2nd order
PHS corrects
0,25
20
0.60
0,6
100
Zn
5,84
20
-
8.91
30/80
30/80
0,60
21)
Ca not
,19.96
30/80
-
100,0
30/80
Fl'C
Gelll
FPC
CrKa 1.2
NiKal,2
relevant (Ge)
69.354
LÍF200
0.25
48.667
FPC
LÍF200
0-25
FPC
VKal,2
ZrKal,2
SrKal,2
100
—
50/50
100
Yb
Y2nd PHS.
tube impurities
0.48
50/50
50+50
76.933
LÍF200
0.25
100
Ti
0.09
50/50
32.038
FPC
LÍF220
0.15
20
.Sr
0.1
50/50
35.796
SC
LÍF22O
0.15
20
0.52
50/50
0.92
50/50
0.7800
50/50
0.4
30/80
SC
ZnKa 1.2
41.794
UF200
SC
0.25
100
CuKai,2
45-030
LÍF200
FPC
0.25
100
+50
Gelll
FPC
0.60
SKal,2
110.688
100
Sr,
tulïe impurity
50+50
PKT - Peta-eiythritol
liF — Uihium fluoride
Ge - Germanium
PPC - Flow proportional Counter
SC - Scintillation Cou nier
AXOó - Layered synthetic microstructure
powder majors and trace element analysis of Cl, Co, Cr,
V, Sc and S. The Rhodium Compton peak ratio method
(Feather and Willis. 1976) is used for tlie other trace
elements.
The XRF Spectrometer is calibrated with certified
reference materials, specpure oxides and some in-house
standards, e.g. Specpure AL^O,, AGV-1, BCR-1, BE-N,
BHVO-1, BR. Specpure CaCOí, Specpure CaO, DR-N,
FeCa (in-house), FeSi (.in-house), GA, GS-N, GSP-1,
Specpure SÍO2, JB-1, JG-1, Lithium tetraborate blank.
MA-N. Mica-Fe, Mica-Mg, MRG-1. NIM-D (SARM 6), NIM-
G (SARMl), NIM-N (SARM4), NIM-P (SARMS). NIM-S
(SAIÍM2), PCC-1, SARM8, SARM9, SARM32, SARM.M,
SARM39, SARM40, SARM42, SARM44, SARM45, SARM46.
SARM47, SARM49, SY-2, SY-3, UB-N, UREM3, UREM4,
UREM7, W-2 (Govindaraju, K. 1984).
Background and overlap corrections were calculated
on a set of interference standards and stored in the
calibration according to a method propo.sed by Willis
and Duncan (1993).
Tables 1 to 4 show the instrnmental parameters for
the three analytical approaches:
SOtlTH AFRrCAN JOURNAL OF GEOLOCiV
232
COMBINING XRF AND XRD ANALY.SES AND SAMPLE PREPARATION
Table 2. In.sinjmL'nia! parameters for Trace elemenis
Analyte
CuKal.2
NiKal,2
"26
45.030
48.667
Crystal
detector
LÍE200
SC
LÍF2000
Colliinator
Time
("divergence)
0.2=;
(s)
20
Sr, tube impurity
0.7800
50/50
10+10
20
Yb
0.26
50/50
10+10
Y2nd PHS, tube
0.1161
30/80
25
SC
Interference
Highest
conc. (%)
kV/mA
impurities
ClKal,2
CoKal,2
92.76
Gel 11
52.8
FPC
LÍF200
0.60
100
50+50
0.25
100
+50
0.0267
50/50
100
50+50
0.0064
50/50
FPC
ScKal.2
97.72
LÍF200
FPC
0.15
FKQ1,2
37.236
AX06
0.60
lOO
2.85
30/80
87.17
FPC
LÍF200
0.13
50+50
100
0.45
50/50
LÍF200
FPC
0.15
50+50
100
0.27
50/50
UF200
0.15
0.27
50/50
BaLal.2
FPC
LaLcil,2
CeLal,2
82.95
79.010
50+50
FPC
CsLal.2
91.823
GaKal,2
38.917
+50
LÍF200
FPC
0.15
100
50+50
0.02
50/50
LÍF200
0.25
20
10+10
0.0095
50/50
LÍF220
SC
0.15
40
Zr. U
0.0330
50/50
LÍF220
0.15
20+20
20
Y, Th
0.0270
50/50
2.82
50/50
0.2200
50/50
0.1600
50/50
0.0150
50/50
0.0080
50/50
SC
MoKal.2
NbKQl,2
28.843
30.378
SC
FbLöl,2
40.379
LÍF220
20+20
0.15
SC
RbKal,2
37.929
LÍF220
ThLal,2
35.793
39.227
O.H
37.295
LÍF220
SC
0.15
LÍF220
0.15
LÍF220
ZnKal,2
33.839
41.799
A.sKal,2
40
0.15
40
LÍF220
SC
0.15
20+20
20
Rb. Th
0.0143
50/50
LÍF200
0.25
10+10
20
Tube impurities
0.9083
50/50
Sr,Th, tube impurities 0.0943
50/50
Ba and Rh
0.0121
50/50
0.0450
50/50
10+10
32.032
LÍF220
0.15
43.5500
SC
UF200
0.15
20
10+10
40
0.15
10+10
20
SC
\tXal,2
20
10+10
SC
ZrKal,2
43.001
U
10+10
SC
YKal.2
20
10+10
SC
ULal,2
20
10+10
SC
SrKal,2
100
LÍF200
SC
10+10
PET - Peta-ery-thrlioi
l.if - Lithium fluoride
Ge - üermaniiim
FFC: - How proportional Counter
SC - .Scintillation Counier
AXOÓ - Layered synthetic micros tiuctu re
SOUTH AFRICAN lOURNAL OF GEOLOGY
MAGGT LOUBSER AND SABINE VERRYN
233
Table 3. Instnimental parameters for corrections
Analyte
RtiKacompton
26,345
Crystal
CoUimator
detector
("divergence)
kV/mA
0,15
Time
20
Interference
LÍF220
Feather Willis correction
50/50
0,15
20
Feather Willis correction
50/50
0,15
20
Tube impurities correaioti
50/50
0,15
20
Tube impurities correction
50/50
SC
RhKacompton
UF200
Í85.9
SC
RhKa
24,899
LÍF220
SC
17.563
RhKa
LÍF200
SC
Table 4. Instrumenca! parameters for UniQuani.
CoUimator
X-Ray tube
Tube setting
Crystal
2d Crystal
("divergence)
Detector
anode
KV
mA
Primary beam fîlter
ÜF22O
2,8480
SC
Rh
60
40
0.25CU
UF420
1,8000
0,15
0,15
0.15
0.15
0.60
SC
Rh
60
40
FPC
Rh
40
60
FPC
Rh
40
60
FPC
Rh
30
80
UF22O
2,8480
GEIU
6,5320
AX06
55-400
AXÜÓ - Laytred synthetic mictastructure
As part of ongoing quality control, a blank and two
certified reference materials are analysed with each
batch of samples. Each tenth sample is ain in duplicate
and clients are encouraged to include their own
,standards and duplicates in batches. The laboratory
participates in the International Association for
Geoanalysts' GeoPT proficiency test (Thompson
el. ÎÏ/..199"') where geological materials are analysed
three times a year, and results reported after statistical
treatment with "z" values for each element from each
laboratory. To evaluate sample preparation errors, an inhi)use standard is submitted m<inthly with a batch of
unknowns and prepared in the same manner as
unknowns. Reported standard deviations are expres.sed
as the standard deviation of a calibration curve, set up
Counts
with an average of 20-30 standards, as this method best
approximates the entire calibration range. Limits of
Quantification were also calculated from calibration
standards. (Table 5)
XRD
At the X-ray Analytical Facility at the University of
Pretoria samples are analysed using a PANalytical X'Pert
Pro powder diffractometer with X'Celerator detector and
variable divergence- and receiving slits each set at
between 5 and 15 mm, depending on the sample holder
used, Tlie samples are scanned at the requirt-d 26 angle
ranges. The radiation can be Fe-fiitered CoKa, Ni-filtered
CuKot or Mn-filtered FeKa radiation depending on the
chemical composition of the samples analyzed in order
1
/
Without polyvinyl binder
20000- /
VVith polyvinyl binder
10000- /
k
^ 1 1
•••I
10
20
1
30
/
1
r
1
1
40
50
60
70
Position [" 2Theta] {Cobalt (Co))
Figure 1. Ef'iect oí polyvinyi alcolioi binder on XRD scan,s ot pressed powder briqueites
SOUTH AFRICAN JOURNAL OF GEOLOGY
• • • I
80
234
COMBINING XRF AND XRD ANALYSES AND SAMPLE PREPARATION
Table 5. Standard deviation and Limit of Quantification.
std dev.(%)
LOQ.(%)
SiO2
0.4
0.02
TÍO2
AI2O3
0.03
0.0032
0.01
Fe2O3
MnO
MgO
CaO
0.3
0.3
0.0065
0.1
Na2O
0.07
0.11
K2O
P2O5
0.06
0.08
Cr2O3
0.0053
0.01
NiO
0.0018
2rO2
CuO
0.005
0.00.37
std dev.(ppni)
As
10
Cu
3
2
Ga
1
Nb
Ni
Sr
3
6
3
4
4
Th
2
HI)
Rb
0.0013
0.0118
0.01
0.0265
0.005
0.01
0.0006
0.0013
0.0008
0.0009
0.0003
LOQ.(ppm)
3
2
2
1
2
3
3
(SI
Mo
0.0097
3
3
3
6
3
4
U
2
w
10
Y
4
4
6
10
Ce
14
14
5
6
CI
100
11
Co
6
3
Cr
40
F
500
24
15
100
Zn
Zr
liü
U
5
300
40
5
1-t
S
Sc
V
10
1
to eliminate fluorescence which would cause, high
background and poor peak to background ratio.
The phases are identified using PANalytical X'Pert
Higliscore plus software.
When required, relative phase amounts are estimated
by the Rietveld metliod using either the Autoquan BGMN Rietveld Program (Kleeberg and Bergmann, 1998;
2002, Kleeberg et al., 2000) or topas from Bruker AXS
employing the fundamental parameter approach or
PANalytical X'Pert Highscore plus software.
Various sample preparation methods are employed.
For routine analysis on powders a back loading
preparation method is used. Front Loading onto a zero
background Silicon sample disc is used when the
sample amount is too small for the routine samples
holders. Solid sample fragments which cannot be
powdered {ß.g. metals and plastics) are mounted in a
sample cup. In certain instances it is possible to use the
same powder briquettes prepared for XRF analysis.
The effect of the additional polyvinyl binder was
investigated and found to be negligible (Figure 1).
For routine phase identification a particle size of less
than 50 |.im is required, which is achieved by milling in
a tungsten carbide or carbon steel milling vessel using a
swing mill or even by hand grinding in an agate mortar
and pestle. For quantitative phase analysis, the preferred
particle size is below 10 pm and that is reached by wet
grinding for between five and ten minutes using ethanol
in a McCrone micronizing mill (Klug and Alexander,
1974; Buhrke etal, 199H). NSC^en the determination of
amorphous content is required, a known amount of a
standard, usually 15 or 20% Si (Aldrich 99% pure), is
added to a milled sample and the sample and standard
are homogenized in a McCrone micronizing mill.
In order to test the reproducibiiity of phase
quantification using Rietveld analyis the analysis of iron
ore sinters, as discussed below, is used as an example.
Three tests were performed:
1. The same sample mount was analyzed ten times to
test the reproducibiiity of the instrument and
method.
2. To test the reproducibiiity of sample packing and
sample presentation to the beam the same subsample was remounted ten times and re-analysed.
3. The homogeneity and representativeness of
sub-sampies was tested by taking ten different
sub-samples and repeating the sample preparation
and mounting procedure. In each ease 16.6 weight
per cent Si powder (Aldrich, 99% purity) for
verification of results was added. The results are
presented in Table 6.
Case studies
Iron Ore Sinters
Iron ore sinters are important feedstock materials for
the steel industry. As a result of increased quality
requirements, the chemistry and the phase composition
of sinters are of importance. Historically point counting
was used in the analysis of theses sinters. Quantitative
X ray powder diffraction analysis, however, is another
tnethod for determination of the relative quantities of
phases present in sinters. Although no observations on
textural features can be made, it is fast and can easily be
adapted for process control.
Minerals typically present in the sinters are
magnetite, hematite, magnesioferrite, periclase, dicalcium silicate, glass and silico ferrites of calcium and
aluminium. The latter phases are abbreviated as SFCA, of
which three varieties have been described depending on
the molar ratio of cations to oxygen: SFCA (MHO>II),
SFCA-I (M^oOffl) and SFCA-Il (UziPiù (M=Ca, Fe, Al and
Si). The four sinter samples used in this example were
obtained from Mittal Steel SA. 20% Si powder (Aldrich,
SOUTH AFRICAN JOURNAL OF GEOLOGY
MAGGI LOUBSER AND SABINIi VERRYN
235
Table 6. Representativeness of XRD preparation
C2S
Hematite
Ma^etite
SFCA I
SFCA
SFCAn
Silicon
15.31
1.54
22.46
16.22
1.37
0.26
Identical sample mount
Mean
9.30
0,54
Standard Deviation
8.91
0.16
23.81
3.54
0.51
0,'?8
Same subsample - Different sample mount
Mean
9.35
0.49
Standard Deviation
9.01
23.80
3.25
15.56
22.46
16,17
0.23
0,57
0.61
1.28
1.46
0.36
3.53
0.97
15.54
22.35
16.19
1.69
1.37
0.43
Different subsamples
Mean
9.16
Standard Deviation
0,54
23.76
0.52
0.43
Table 7. Quantitative XRD data of Iron Ore Sinters used in the study.
Sinter
Sinter
Sinter
Sinter
I
2
3
4
C2S
Hematite
Magnetite
SFCA
SFCAD
Silicon
7.47
5.66
6.08
11.02
21.93
12.17
19.82
34.10
29.39
33.24
32.26
13.17
13.67
S.75
13.32
9.82
20,56
21.58
20.83
21.45
6.02
Tabie 8. XRF data on Sinter samples (weight %).
SÍO2
Sinter 4
Sinter 1
Sinter 2
Sinter 3
4,21
4.51
4.63
4.2
TÍO2
0.09
0.09
0.08
0.09
AI2O3
1.24
1.27
1.32
1.23
61.3
57.28
57.68
MnO
86
0.96
0.78
0.91
MgO
2.7
2.84
2.9
2.68
CaO
K2O
P2O5
NiO
V2O3
Total
60.9
12.69
14.37
10.63
Table 9. Combining XRD ;ind XRF results to calculate an
approximate composition oí the amorphous component in Fly
Ashes.
XRD
Amorphous
Calcite
Hematite
Mullite
9.07
9.07
10.51
8.64
<0.005
<0.0()5
<0.005
<0.005
0.13
O.H
0.13
0.13
CaO
0.1
0.1
0.12
0.1
SÍO2
0.02
0.02
0.02
Ü.02
<0.01
<0.01
<0.01
<0.01
<0.01
<0.01
<0.01
<0.01
<0.01
<0.01
19.41
23.09
21.9'i
20.35
99.15
99.37
100.1 i
99.25
QuLirtz
67,84
0.26
0.46
63.64
68.41
0.34
23.91
7.54
21.46
0.3
0.73
20.52
10.04
0.77
13.79
63.81
0.26
0.72
21.88
13.32
XRF
1.47
60.9
4.23
29.8
0.47
0.29
0.22
0.93
AI2O3
MgO
TÍO2
K2O
0.83
62.3
4.24
28.9
0.56
0.29
0.22
1.13
U.89
62.3
4.25
28.9
0.64
0.3
0.22
1.17
1.19
S6.8
4,65
33.9
0.57
0.31
0.24
0.9
Composition of amorphous component
CaO
99% purity) for determination of atnorphoiis content as
well as verification of results was added. More detailed
XRD results are shown in de Villiers and Verryn (2007).
These results are a first approximation and minor
pha.ses were ignored, recalculation including minor
phases can improve the results. Ignoring ihe added Si,
these results are in good agreement with the results
obtained by XRF, and in this case the analytical totals are
acceptable. Frotïi tlie XRD results we obtain information
about the oxidation states of tnost of the Fe in the
sample (Tables 7 and 8).
Analysis of Fly Ash and other glass cotitaining
materials
At our laboratory satnples containing glassy or
amorphous materials are routinely analyzed and
quantified after addition of between 15 and 2{)'>i) Si
SÍO2
AI2O3
MgO
TÍO2
K2O
1.21
43.796
4.046
15.454
0,47
0.29
0.22
0,93
16.024
0.56
0.59
44.052
3.958
16.588
0.64
0.29
0.22
1.13
0.3
0.22
1.17
39.926
3.932
0.93
34.728
4.362
20.772
0.57
0.31
0.24
0.9
powder as described above. Other methods as well as
the use of other spike materials have been descrilied by
Ward and French (200S). After spiking, tlie phases are
identified and then quantified, using the Kietveld
method definitig Si as a standard, wliich is then used to
calculate the amount of amorj^hous tnaterial.
Combining XRD and XRF results, an approximate
composition of the amorphous component(s) can I>e
SOUTH AFRICAN JOURNAL OF GEOLOGY
236
COMBINING XRF AND XRD ANALYSES AND SAMPLE PREPARATION
Counts
300-
200-
100-
60
40
50
Position [''2Theta] {Copper (Cu))
PukUst
Fe1.eMn1.2C
Fe3 Mn7
C Fe15.1
F e l l IVIn3.9C2
Fe2C
Mn7C3
1 1 ll 1
1 1
.
.
1
1.
.
1
. ll...
,
1
J .
1
! . .
.
.
.
Figure 2. XHD sain of originji Ft'Mn sample
Counts
200-
100-
20
30
40
50
Position [''2Theta] {Copper {Cu))
Peak List
Bixbyite, syn; Mn2 03
Akhtenskite, syn; Mn 02
Pyrolusite; Mn 02
Figure 3. XRD scan of FeMn sample after oxidation with HNO,
calcuhited as shown in Table 9. The calculations are
performed under the assumption that the phases
detected have an ideal composition. Care should be
taken when dealing with samples where phases may
deviate from idea! compositions or show solid solution
between 2 or more elements. It would then be advisable
to obtain chemical compositions of the individual phases
which should be used in the calculations.
Analyses of Ferro Manganese samples
Ferro Manganese samples that are submitted for analysis
usually require fusion preparation methods due to the
influence mineralogical effects have on the accuracy of
powder briquette methods. Samples are prepared
according to the methods described earlier in this paper,
and to evaluate the oxidation step, XRD diffractograms
were recorded before and after the oxidation step
(Figures 2 and 3)- It can clearly be seen that the
SOUTH AFRICAN JOURNAL OF GEOLOGY
MAGGI LOUBSER AND SABINE VERRYN
237
Table 10. FeMn fiised bead n?producibility.
FeMn fused 1
FeMn fused 2
PeMnlused3
80.96
81.10
81.01
0.08
17.27
16.70
17.08
0.32
SÍO2
80.96
17.27
0.21
0,21
0.24
0.22
0.02
P2O5
0.10
0,10
0.11
0.10
0.01
SO3
0.06
0.06
0.12
0.08
0.03
CaO
0.05
0,03
0.06
0.06
0.005
0,05
98.70
0,05
0.03
0.05
0.01
98.70
98.36
MnO
Fe2O3
Cr^O,
Total
Std. dev.
Counts
50001000050000
50001000ÖH
5000
0
5000010
30
40
50
60
Position [°2Theta] (Cobalt (Co))
70
80
Peak List
tiniite, syn
Cu ( o H )2; Spertiniite,
Na Cl; Hallte
Figure 4. XKD scans of CuíOH)^ tontainin^ sa
ferromanganese metal phases and ferromanganese
carbide phase.s were oxidised to manganese oxide and
ferromanganese oxide phases. Considération oï the
results in table 10 shows good reproducibility.
Analyses of Copper salts
XRF is routinely used for the quantitative analysis of
elemenLs l^tween fluorine and uranium on the periodic
table of the elements. Oxygen and hydrogen cannot Ix*
determined as their characteristic x-ray photon
wavelengths are long and are easily absorbed by air and
anything else in the optical pathway. Fluorescence
yields for these elements are too low to produce enough
photons to be detected. Oxygen is usually assigned in
stoichiometric quantities to enable accurate matrix
corrections. Hydrogen cannot be determined at all.
This could lead to erroneous results where these
elements are present. Consider the following Copper
salts submitted lo the laboratory for analysis. The
samples were analysed as pressed powder briquettes
(Table 10). As the pressed powder program is calibrated
for oxides Cu will be expressed as CuO. CuSO,, would
be eliminated as a possible composition due to the low
S concentrations, (CuO + SO^ = CuSO^), The analytical
totals were very Iow and a wavelength scan revealed no
additional elements, A XRD scan was obtained to
determine the phases present and the results shown in
Figure 4. From this data the major phase was identified
as Cu(OH)2 (Spertiniite), explaining the low analytical
totals as a 21% hydroxide content constituted the
difference.
Table 11. XRF Copper salt results (in weight %).
%
CuO
Na2O
Cl
CaO
SÍO2
Sample 1 Sample 2
34.76
33.04
.30.10
31,66
Sample 3 Sample 4 Sample 5
32,89
32,04
34,65
30,67
34.39
31.34
11.77
12.53
0.31
0.08
12.56
0.34
12.22
0,32
12.07
0,32
0.04
0,02
0,06
0.04
0.07
0,04
0,02
0,05
0.05
0.02
0,03
0,05
0,02
0,02
77,79
0.02
77.64
0,02
SO3
Fe2O3
0,03
0.01
ZnO
Total
0.01
77.87
SOUTH AFRICAN JOURNAL OF GEOLOGY
77,89
0.29
0.08
0.08
0.06
0.03
0,02
78.06
238
COMBINING XRF AND XRD ANALYSES AND SAMPLE PREPARATION
Conclusion
From iht' above case studies it ¡s clear that a research
facility dealing with a wide range of mineraiogical
samples can hardly function with XRF or XRD
instrumentation exclusively. Combined the techniques
complement each other and bring a new dimension to
the data mining that can be performed. XRF and XRD
analysis are each used extensively for the confirmation
of results obtained by the other teclinique. Both
techniques are also used to elucidate problems
encountered. XRD is an essential tool in method
development for XIÎF sample preparation and XRF
results are important for the verification of qualitative as
well as quantitative results obtained by XRD analysis.
Acknowledgements
Tilt' autiiors would like to thank Professor Johan de
Villiers invaluable discussion over the last years and for
the Iron Ore Sinter data and samples. Professor Richard
Kruger is thanked for Fly Ash samples. Kgabo Raniela
and the students working in the facility, who patiently
prepared and analysed samples to collect the data.
The reviewers are thanked for their constructive
comments. Dr Thinus Cloete and Dr Geoff Grantham,
:fre thanked for their constructive commenLs,
References
Ik-mioti. II ^ind Oliver G. (19921. XRK Analysis of Ceramics. Mint^nils and
Applied Materials. yoiiM Wiley and Son. New York. Uniwd SIcitex of America.
67-93Biihrkf, Vi;. R Jenkins and DK Smich (Editors) (1998) A piactifal Guide for
thf Preparation u( Specimen.s for X-Kay fluorescence and X-Ray Ditiraction
Analysts. Wiley-VCH. New York, ! Inited States of America, 39-58.
Bergmann,.!., Kieebei^, R., Haase, A. and BreJdenstein, B. (2(KX)). Advanced
tuiidiimental parameter model for improved profite analysis. Materials
Science Forum, Volumn.s Ml-imi)
303-.-ÍO8.
Feaiher C.E. and Willis J.R (IWi). A simple- method for background and
Matrix Correction of Spfciral Peaks in Tract' Klements Determinaiion hy
X-Ray I'luorfStvnix- Spectrometry. X-Ray SfX'clmmetry. 5, 'Í1-4S
Govindarajii, K. (Í9H4), 19H4 Compilation of working values for 17(1
international reference samples of mainly silicate rocks and minerals.
Geixsiantlards Ni-wslfttcr. 8: S[wcial Issue. 3-16.
de Villiers J and Verryn S (2007). Míxlern techniques in X-ray diffraction
applied \o metaiktrgy. Journal of the Sotith African ¡nsfituie of Mining atuJ
Metallttrgy. 107, 83-86.
KleebeiB, R., Bergmann, J. (199H). Quantitative Röntgenphasenanalyse mit
den Rierveldprtjgrammen BGMN und ALfTOQUANT in der täglichen
La!x)rpraxis. lierichte der Detitschen Tun- und
Ttmmineralgruppe
Greifstvalä. 6, 237-250,
Kleebcr^, R. dnd Bergmann. J. (2002). Quantitative Phase Analysis using the
KieCveld Method and a Fundamental Parameter Appro-.ich. fn: S.P.
ScnGupta and P. Cliatterjee (Editors), Powder l>iffrjciion Fr<K. II
hitematiotiat School on Powder Diffraction. LACS. Kotkata. India. Allied
I'lihlishers Limited. New t)elhi. 63-76.
KluK, H.P. and Alexander, I.E. (1974) X-ray diffratlion pr<x.vdurcs, 2nd
Edition,/'>/-'»I Wiley and Sons. !Veit' York, Vnited Slates of Amerii:a, London.
united Kingdom. 9()6pp.
Lachance GR, Claisse F. (1980). A comprehensive Alpha Coefficient
Algorithm. Advances in X-Ray Anal.vsts 23, 87.
Lu[x>n D F, Merker J and Scholz F. (1997). The Correct use of Platinum in the
XRF Uhoratory. X-ray Spectrometry, 26, 132-1-10.
Sear L G. (1997). The fu.sion of ditficult materials including chromite.
cassiterite and reduc-ed sulphur. X-ray Sfxtctromelry, 26, IOS-110
Thompxin, M, I'ons. I'.J. Wvhh P.C. and Kane. J.S. (1997). GeoPT A Proficiency Test for GeoatialysLs. Aitalysl, 122, 1249-125't.
UniQuantiS 1989...2006 is a registered trademark uf Thermo Fisher Scientific
Inc,
Ward, C.R and French, L) (20051. Relation l>L'tweeii Coal and Fly Ash
Mineralogy, based on Quantitative X-Kay Diffraction Methods. World Goal
Ash (WOCAX April 11-1'i. Lc.viu}>ton. Kimtticky. Untied States of America.
Watfion, J-S, ( lWil. Fast, Simple Method of Powder Pellet Preparation for XKay Fluorf.scencf Analysis. X-Ray Spectrumeiry. 25. 173-17).
Willis, J.P. and Ehincan A.R. (1993), Computer Prtigram "TRACE" for
information contact A.ssociaCe Professor Andrew Duncan. Geological
Sciences Fjcteasion Building, Room 224, Universily of Cape Town, Private
Bag, Rondeb()sch 7701, South Africa.
Willis, J.P. and Dimtun A.R. (2008). Understanding XRF Spectrometry.
A training course in XRF Spectrometry. PANalytical B.V., Netherlands,
p. 9-9
Young, R.A. (Iklitor) (19'?31 Hie Rietveld Metluxi, hilernational Union of
CrystalU)graphy, Monographs on Crystallograpby, 5, Oxford Science
Publications, 298pp.
Fditorial handling: A. liunihy
SOUTH AFRICAN JOURNAL OF GEOLOGY


© Copyright 2026