
Stats 545: Homework 3 Due before class on Oct 2.
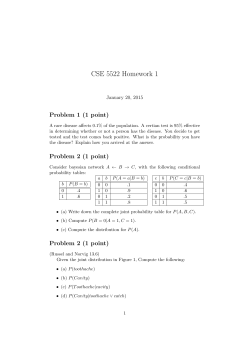
Stats 545: Homework 3
Due before class on Oct 2.
All plots should have labelled axes and titles.
Important:Rcode, tables and figures should be part of a single .pdf or .html files from R
Markdown and knitr. See the class reading lists for a short tutorial.Any derivations can also be
in Markdown, in Latex or neatly written on paper which you can give to me.
1
Problem 1: The K-means algorithm.
[60 pts]
The MNIST dataset is a dataset of 28 × 28 images of hand-written digits. Download it from http://
yann.lecun.com/exdb/mnist/ (you only really need the training images and labels though). To read these
images in R, use the script from https://gist.github.com/brendano/39760. Make sure you understand
this. Note that the show digit command displays a particular digit.
1. Since the dataset is quite large, restrict yourself to the first 1000 training images, and their labels.
Store these as variables called digits and labels. digits should be a 1000 × 784 matrix (or its
transpose). Include R code.
[2 pts]
2. Write a function my kmeans to perform a k-means clustering of the 1000 images of digits. Use
Euclidean distance as your distance measure between images (which can be viewed as vectors in a 784
dimensional space). Your function should take 3 arguments, the matrix digits, the number of clusters
K and the number of initializations N . You code should consist of 3 nested loops. The outermost
(from 1 to N ) cycles over random cluster initializations. The second loop (this could be a for or while
loop) is the actual k-means algorithm for that initialization, and cycles over the iterations of k-means.
Inside this are the actual iterations of k-means. Each iteration can have 2 successive loops from 1 to
K: the first assigns observations to each cluster and the second recalculates the means of each cluster.
These should not require further loops. You will probably encounter empty clusters. It is possible to
deal with these in clever ways, but here it is sufficient to assign empty clusters a random mean (just like
you initialized them). Since your initializations are random, make your results repeatable by using the
set.seed() command at the beginning (you can also make the seed value a fourth argument). Your
function should return: 1) the value of the k-means loss function for the best solution, 2) the cluster
parameters and cluster assignments for the best solution 3) The sequence of values of the loss-function
over k-means iterations for the best solution (this should be non-increasing) 4) The set of N terminal
loss-function values for all initializations. Do not hardcode the number of images or their size. Include
R code.
[10 pts]
3. Explain briefly what stopping criteria you used (i.e. the details of the second loop).
[2 pts]
4. Run you code on the 1000 digits for K = 5, 10, 20. Set N to a largish number e.g. 25 (if this takes too
long, use a smaller number).For each setting of K, plot the cluster means (using show image) as well
as the evolution of the loss-function for the best solution (you can use a semi-log plot if that is clearer).
You do not have to print the other values returned by the function e.g. the cluster assignments, or the
values of the cluster means etc., just plots is sufficient
[15 pts]
5. For each setting of K, plot the distribution of terminal loss function values (using ggplot’s geom density()).
1
6. Explain briefly how you might choose the number of clusters K.
[4 pts]
7. Explain briefly how you might choose the number of clusters K if you had access to labels.
[4 pts]
8. Modify your code to do k-medoids. You only need to change one part of your previous code viz. the
part that calculates the cluster prototype given cluster assignments. The cleanest way to do this is
to define a function called get prototype that takes a set of observations and returns the prototype.
For k-means this function just returns the mean of the observations. Note that the mean can also be
defined as
|D|
X
µ = arg min
(x − di )2
x
i=1
Here D = (d1 , . . . , D|D| ) is the set of images input to get prototype, and the mean need not be part
of this set. For k-medoids, the prototype is defined as
µ = arg min
x∈D
|D|
X
(x − di )2
i=1
In other words it finds an element in D that minimizes the sum-squared distance. Include R code for
your implementation of get prototype for k-mediods. You can use as many for loops as you want,
but the simplest is to loop over each observation assigned to that cluster, calculate the sum-squared
distance when that is set as the prototype, and return the best choice.
[10 pts]
9. What is the cost of this function in big-O notation as a function of the number of observations in the
cluster.
[3pts]
10. Run k-medoids for K = 5, 10, 20. Since this might take longer, you can use smaller values of N as well
as fewer images (e.g. just 100 digits), but report what numbers you used. For each choice of K, show
the cluster prototypes. Comment on the quality of the cluster prototypes, as well as the value of the
loss function vs k-means.
[10 pts]
2
Problem 2: Hierarchical agglomerative clustering
[40 pts]
For this, define digits and labels as the first 20 images and labels of the MNIST dataset. Recall that
hierarchical clustering starts with N (in this case, 20) singleton clusters, and sequentially merges the closest
2 according to some distance function.
1. How many merge operations are there in all?
[2 pts]
2. Write a function to perform single-linkage hierarchical clustering. The function should take digits as
input. At each step, the function merges the two nearest clusters, where the distance between clusters
C and D is the minimum element-wise distance.
dist(C, D) =
min
c∈C,d∈D
dist(c, d)
Use Euclidean distance for element-wise distance.
Your function should return an X × 2 matrix called merge where X is the number of merges (see
the first part of this question). Row i of merge gives the details of the ith merge with the following
interpretation: if an element is negative, it is one of the original datapoints (e.g. -3 is the third data
point). If an element is positive (e.g. 5), it refers to the cluster formed at step 5. Thus, if row i of
merge equals (−3, −4), that means that at step i, we merged observations 3 and 4. If it equals (−3, 4),
that means that at step i, we merged observation 3 with the cluster formed at step 4. If it equals (3, 4),
2
3
4
3
4
9
7
5
8
0
9
3
2
1
2
5
1
1
6
6
1
that means that at step i, we merged the cluster formed at step 3 with the cluster formed at step 4.
Note that merge does not contain a 0.
Your code can be organized as follows:
For each data-point, find the nearest neighbour and its distance. Also create a list of length N called
name with element i equal to −i. Then repeat:
• Pick the closest two of the remaining clusters and merge. Update the corresponding row in merge.
• Noting we have one cluster less, recalculate the nearest neighbours. For this step, note that
dist(x, merge(a, b)) = min (dist(x, a), dist(x, b))
When saving this new distance, remember to update the appropriate element of name with value
i at step i. Include R code, and run it on digits.
[25 pts]
3. Create a named list called my tree, and then turn it into an object of class hclust as follows:
my tree <- list(merge = merge, height = seq(1,N-1), labels = labels);
class(my tree) <- "hclust"; # We will talk about object-oriented programming later
Finally, install the package ape, and plot the resulting tree using the as.phylo command. Look at the
manual for options, but as an example, plot(as.phylo(my tree), type = "fan") gives something
like the figure above. Include your figure. Make sure it has a title and other useful information.
Before you plot, look at merge and make sure it defines a valid hierarchical clustering, otherwise you
might crash R!
[10 pts]
4. In the previous part, we set height to 1 to N , so that each edge of the tree had length 1. Suggest a
more informative way of setting these lengths.
[3 pts]
3


© Copyright 2026