
Homework 4: Clustering, Recommenders, Dim. Reduction, ML and Graph Mining
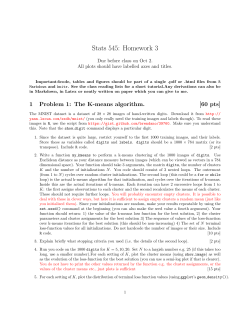
Virginia Tech.
Computer Science
CS 5614 – (Big) Data Management Systems
Fall 2014, Prakash
Homework 4: Clustering, Recommenders, Dim. Reduction, ML
and Graph Mining
(due November 19 , 2014, 2:30pm, in class—hard-copy please)
th
Reminders:
a.
b.
c.
Out of 100 points. Contains 5 pages.
Rough time-estimates: 5-8 hours.
Please type your answers. Illegible handwriting may get no points, at the discretion of the grader.
Only drawings may be hand-drawn, as long as they are neat and legible.
d. There could be more than one correct answer. We shall accept them all.
e. Whenever you are making an assumption, please state it clearly.
f. Each HW has to be done individually, without taking any help from non-class resources (e.g.
websites etc).
g. Important: Feel free to use any programming language you want for this homework, but we
recommend using numerical software like Matlab/R/Python packages like scipy and numpy.
Q1. Dimensionality Reduction [20 points]
We will use Singular Value Decomposition to investigate a cloud of points. Consider
the 5-dimensional dataset on a linear manifold here:
http://people.cs.vt.edu/~badityap/classes/cs5614-Fall14/homeworks/hw4/svd.dat
Each point in the point cloud lies roughly on a 2-d plane spanned by two vectors v1 and
v2 with an additional noise term 𝜀! ~ 𝒩 0, Σ which follows a Gaussian distribution.
More specifically Σ = 6𝐼!,! where 𝐼!,! is a 5x5 identity matrix.
Q1.1. (10 points) Use SVD to visualize the dataset in 2-dimensional space by
projecting in the best 2 dimensions. FYI: SVD is implemented in MATLAB/R
as a native function.
Q1.2. (5 points) There are two outliers in the dataset. Find those two outliers by
manually looking at your visualization in 2-dimensional space. Print your Plot
and mark the outliers with your pen, and submit this plot. Also, report the 2-d
coordinates of the outliers in the 2-d (’concept’) space.
Q1.3. (5 points) We want to reverse engineer the two outliers from the concept space
to original space. What is the formula we need to find 5-d coordinates of a
point in the original space, given the 2-d coordinates in the projected (’concept’)
space? For example, the point (0,0) in ’concept space’ corresponds to (0,0,0,0,0)
in the original space.
1 Code Deliverables: In addition to all the plots and answers, copy-paste all the code that
you wrote in your hard-copy.
Q2. Clustering [25 points]
Here we will investigate the K-Means clustering algorithm we saw in class. Formally, in
K-means clustering, we are given points 𝑥! , 𝑥! , … , 𝑥! ∈ ℝ! and an integer K > 1, and our
goal is to minimize the within-cluster sum-of-squares error (essentially the k-means
objective) i.e. find 𝐿 and 𝐶 so as to minimize the term:
!
∥ 𝑥! − 𝐶!! ∥2
𝐽 𝐶, 𝐿 = !!!
where 𝐶 = (𝐶! , 𝐶! , … 𝐶! ) are the cluster centers and 𝐿 = (𝑙! , 𝑙! , … , 𝑙! ) are the cluster
assignments for the data points i.e. 𝐶! ∈ ℝ! and 𝑙! ∈ 1, … , 𝐾 .
Finding the exact minimum of the function 𝐽 𝐶, 𝐿 is very hard. We saw the most
common algorithm for finding an approximate solution in class (it is also called Lloyd’s
algorithm). For sake of clarity we repeat it here. The algorithm takes additionally as
input some initial set of cluster centers C, and then proceeds as follows:
1. Keeping C fixed, find cluster assignments L to minimize 𝐽 𝐶, 𝐿 . This step
involves basically finding the nearest cluster center for each data point (ties can
be broken using arbitrary but consistent rules).
2. Keeping L fixed, find C to minimize 𝐽 𝐶, 𝐿 . This just requires finding the
centroid of each cluster (the cluster centers).
3. If any of the values in L changes from the previous iteration, repeat 1-3.
4. Return C and L.
The initial cluster centers C are often picked randomly from the given data points. In
practice, we often need to repeat multiple runs of Lloyd’s algorithm with different
initializations and pick the best clustering in terms of the k-means objective (𝐽 𝐶, 𝐿 ).
Q2.1. (5 points) Explain why Lloyd’s algorithm is always guaranteed to converge (i.e.
stop) in a finite number of steps.
Hint: Note that the objective function is non-negative (why?). Now think about
what is happening to it.
Q2.2. (10 points) Implement Lloyd’s algorithm. Use the 500 2-d points dataset given
here: http://people.cs.vt.edu/~badityap/classes/cs5614-Fall14/homeworks/hw4/cluster.csv
as input.
Run it until convergence 200 times, each time initializing using K cluster centers
picked at random from the input data set with K=5 clusters. Plot in a single
figure the original data points (in grey), and all the 200x5 final cluster centers (in
2 black) given by each run of Lloyd’s algorithm. You can play around with the
plotting options such as point sizes so that cluster centers are clearly visible. Also
compute the minimum, mean, and standard deviation of the 𝐽 𝐶, 𝐿 values for
the clusterings given by each of the 200 runs.
Q2.3. (10 points) We want to select the best number of clusters K for this dataset (for
Q2.2 above we silently used K=5). Recall that we typically look for a “knee” in
the average-distance vs K plot, to select the “best” K. Produce such a plot for K=1,
2, …, 15 using the same dataset in Q2.2. More specifically for each value of K, run
your k-means implementation with at least 200 random initializations, and pick
the best resulting clustering out of these 200 runs (in terms of the 𝐽 𝐶, 𝐿 value).
Then plot the best 𝐽 𝐶, 𝐿 value on the y-axis for each K, and the corresponding K
value in the x-axis, and find the knee.
Code Deliverables: Again, in addition to all the plots and answers, copy-paste all the
code that you wrote in your hard-copy.
Q3. Machine Learning [30 points]
Q3.1. (6 points) Perceptron: For the following training set:
([1,2], +1) ([2,1], +1) ([2,3], -1) ([3,2], -1)
Describe all the vectors w and thresholds θ such that the hyperplane (really a
line here) defined by w.x – θ = 0 separates the points correctly.
Q3.2. (6 points) K-NN: Suppose we the following training set:
If we perform nearest-neighbor learning with the single nearest neighbor as the
estimate of the label of a query point, which query points are labeled +1?
Q3.3. (18 points) SVM: The following training set obeys the rule that the positive
examples all have vectors whose components sum to 10 or more, while the sum
is less than 10 for the negative examples:
a. (3 points) Which of these six vectors are the support vectors?
b. (6 points) Suggest a starting vector w and constant b such that the
hyperplane defined by w.x + b = 0 is a good separator for the positive and
negative examples. Make sure that the scale of w is such that points are
outside the margin; that is for each training example (x, y), you have y(w.x
+ b) >= +1.
3 c. (9 points) Starting with your answer to Part 2, use gradient descent to find
the optimal w and b. Note that if you start with a separating hyperplane,
and you scale w properly then the second term of the Equation in Slide 28
in Lecture 20 will be always be 0, which simplifies your work considerably.
Q4. Recommendation Systems [5 points]
Consider the following utility matrix, representing ratings on a 1-5 star scale of eight
items a-h by three users A, B, and C.
Treat ratings of 3, 4, and 5 as 1 and 1, 2 and blank as 0. Compute the Jaccard, and cosine
distances between each pair of users. Which one is better?
Q5. Graph Mining [20 points]
Q5.1. (8 points) For the graph below:
a. (5 points) Use the Girvan-Newman approach to find the number of
shortest paths from node A that pass through each of the edges.
b. (3 points) Construct the Laplacian Matrix of the graph and find the second
smallest eigenvalue and its eigenvector. What partition of the nodes does
it suggest?
Q5.2. (12 points) Power laws.
a. (5 points) Recall from class that the pdf of a power-law distribution is
!!!
𝑃 𝑋 = 𝑥 = !
!"#
!
!!"#
!!
. Derive the CCDF (Complementary Cumulative
Distribution Function) for it (i.e. 𝑃(𝑋 ≥ 𝑥)). (show the steps)
b. (5 points) Download the file which contains Herman Melville’s Moby Dick,
with a single word on each line:
http://people.cs.vt.edu/~badityap/classes/cs5614-Fall14/homeworks/hw4/mobydick.txt
4 Plot the distribution of word frequencies on a log-log scale. That is the xaxis should show the number of times a word can appear (i.e. word
frequency) and the y-axis the fraction of distinct words with frequency x.
c. (2 points) Use the MLE technique given in the slides to fit the power-law
coefficient 𝛼 to the plot in Part b above. (Note that you will have to “guess”
a 𝑥!"# first). Report the 𝛼 and 𝑥!"# you find.
Q6: BONUS: Closing triangles and Tweeting away [10 points]
Q6.1. (5 points) First take an educated guess about your clustering coefficient i.e. how
many friends of your friends would be your friends too. Now empirically
determine this number from your Facebook network. Do they match?
Q6.2. (5 points) Spread the word about how awesome this class is on Twitter ☺
Tweet the link to the class web-page, and ensure at least 4 of your followers retweet your tweet (paste the screen-shots of the re-tweets as evidence!).
5


© Copyright 2026