
Morning Brief Indonesian Market Daily Daily IHSG (Jakarta Composite Index)
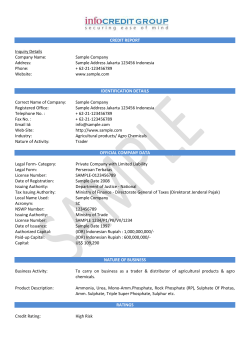
Thursday
October 30 2014
Morning Brief
Daily
IHSG (Jakarta Composite Index)
October 29
5074.06
Chg
+72.75 pts (+1.46%)
Volume (bn shares)
5.78
Value (IDR tn)
12.02
Adv 245 Dec 232 Unc 71 Untr 136
Indonesian Market Daily
Foreign Transaction
Buy
Sell
Net Buy (Sell)
Top Net Buy
BBRI
ASII
ADRO
BBNI
UNVR
NB Val.
164.0
130.1
55.4
49.3
39.4
LQ-45 Index
Gainers
ADRO
PTBA
AALI
LSIP
UNVR
(IDR bn)
9,389
-7,459
+1,930
Top Net Sell NS Val.
TLKM
144.6
ELSA
23.3
WIKA
22.5
INCO
12.7
EXCL
11.0
Top Gainers & Losers
Losers
%
EXCL
-4.8%
AKRA
-0.8%
ANTM
-0.5%
LPPF
-0.3%
HRUM
0.0%
%
+6.8%
+5.7%
+5.5%
+4.2%
+4.1%
Government Bond Yield & FX
Tenor: 10 year
USD/IDR
KRW/IDR
Last
Chg.
8.1645%
12,082.50
11.54
+0.0386
-0.71%
-0.50%
Global Indexes
Index
JCI - Intraday
JCI - daily charts
Indonesian Market Recap:
JCI surged yesterday as coal and palm oil sector led the gain after commodities
price rallied. Top gainers: Misc Ind (+2.66%), Mining (+2.58%), Agri (+2.56%).
Today’s Outlook
For today we anticipate JCI to move within support range 5010-5050 and resistance range 5085-5092. Ladder bottom candlestick appeared above middle
Bollinger band. MACD tend to move upward with shortened negative histogram.
RSI, Stochastic, and William’s %R is trying to move upward again. Technically JCI
has opportunity to increase but we suggest updating with newest sentiment.
Global Market
United States
US market fell last night as US Federal Reserve announced to end monthly bond
purchases, know as quantitative easing (QE) and to keep interest rate low.
Europe
European market closed mixed yesterday as investor waited for US Federal Reserve decision and negative regional within European companies.
Asia
Asian market join global rally yesterday as US Federal Reserve’s policy was being
watched in addition to rise in Japan’s industrial production.
Last
Chg.
%
Dow Jones
16,974.31
(31.44)
-0.18%
S&P 500
1,982.30
(2.75)
-0.14%
Daily Recommendation (details on the next page)
Nasdaq
4,549.23
(15.06)
-0.33%
Trading Buy: ADRO, INTP, AALI
FTSE 100
6,453.87
51.70
0.81%
Daily News
CAC 40
4,110.64
(2.03)
-0.05%
DAX
9,082.81
14.62
0.16%
Nikkei
15,553.91
224.00
1.46%
Hang Seng
23,819.87
299.51
1.27%
AALI
BBKP
BORN
KBLV
S&P/ASX 200
5,447.68
(4.92)
-0.09%
Supplements:
Fuel Price Increase by Government
FOMC Statement
CSI 300
2,451.38
34.73
1.44%
KOSPI
1,961.17
35.49
1.84%
Commodity Price
Commodity
: Has announced an increase in bank loans
: high cost of interest, net profit fall
: Net loss getting high
: Has sold LINK, KBLV got the increase of net profit
Indonesia Economic Data
Last
Chg.
%
Gold ($/troy oz.)
3.71
(14.92)
-1.21%
BI Rate
7.50%
7.50%
Real GDP
5.12%
5.22%
Crude Oil ($/bbl)
81.97
0.41
0.50%
FX Reserve (USD bn)
111.16
111.22
Current Acc (USD bn)
111.20
110.50
Gas ($/mmbtu)
3.71
0.04
1.09%
Trd Balance (USD bn)
-0.31
0.13
0.13
-0.28
Nickel LME ($/MT) 14,650
14.00
0.10%
Exports Yoy
10.6%
-6.03%
Tin LME ($/MT)
19,753
209.50
1.07%
Imports Yoy
13.7%
-19.30%
CPO (MYR/Ton)
2,255
37.01
1.67%
Inflation Yoy
4.53.%
3.99%
Monthly Indicator
PT Woori Korindo Securities Indonesia — Daily Morning Brief
Last
Prev.
Quarterly Indicator
Govt Spending
FDI
Business Confidence
Cons. Confidence
Last
Prev.
+16.9%
+16.9%
-19.30%
0.50%
3.99%
4.53%
Page 11
Stocks Recommendation
ADRO
Analysis
Morning star candlestick appeared above
middle Bollinger band. Momentum is increasing supported by buying volume increase.
Range
1035 - 1145
Action
Trading buy as price above 1090
INTP
Analysis
White marubozu candlestick appeared
below upper Bollinger band. RoC is moving
upward supported by parabolic SAR increase.
Range
23800 - 24125
Action
Trading buy as price above 24000
AALI
Analysis
Three inside up candlestick appeared on
middle Bollinger band. Volume is increasing supported by RMI indicator increase.
Range
20000-21150
Action
Trading buy as price above 21000
Daily News
AALI
: Has announced an increase in bank loans
PT Astra Agro Lestari Tbk. (AALI) announced an increase in
bank loans amounting to Rp892 billion in Q3-14. In the
consolidated financial statements as of September 30, 2014,
total liabilities increased Rp2,26 trillion. The increase is
mainly on account of a bank loan at Rp892 billion, accounts
payable amounting to Rp425 billion, other liabilities account
of Rp397 billion and Rp337 billion for accrual accounts.
BBKP : high cost of interest, net profit fall
PT Bank Bukopin Tbk. (BBKP) recorded a profit of Rp677
billion in Q3-14 or corrected by 8,30% compared to the same
period last year. Despite positive growth in credit and
deposits (DPK), income eroded due to the costs of funds.
Until September 2014, the bank's retail lending up to
Rp32,33 trillion, up 23,83% compared to the same period
last year.
BORN : Net loss getting high
PT Borneo Lumbung Energi & Metal Tbk. (BORN) posted a
net loss of up to US$ 170,13 million, equivalent to Rp2,04
trillion during the period January to June 2014. In the
financial statement carrying, BORN losses continue to rise
53,15% from the same period last year of US $ 111,04
million . Net sales of BBKP recorded dropped sharply to US$
69,24 million from US$ 153,5 million.
KBLV : Has sold LINK, KBLV got the increase of net profit
Divestment of PT First Media Tbk (KBLV) on 11% share in its
subsidiary, PT Link Net Tbk (LINK) will change the structure of
the company's profit. If using the assumption until 1H14
period of KBLV performance, the increase is up to tens of
times. Net income after divestment reached Rp 8,04 trillion,
an increase of 75 times compared to a net profit in 2014 first
half of the Rp 107 billion.
e2
Page 22
Stocks Technical Analysis
Ticker
Open
IHSG
5,019
High
5,074
Low
5,018
Close
5,074
Prev
5,001
∆%
S1
S2
S3
1.46%
5,019
4,990
4,963
Pivot
5,046
R1
5,075
R2
5,102
Target
R3
5,131
YTD
(%)
PER
(x)
Spt
Rst
5,019
5,102 18.72%
16.56
21,631 -16.04%
10.57
Agriculture
AALI
20,150
21,075
20,025
21,075
19,975
5.51%
20,088
19,531
19,038
20,581
21,138
21,631
22,188
20,088
LSIP
1,825
1,885
1,815
1,880
1,805
4.16%
1,818
1,781
1,748
1,851
1,888
1,921
1,958
1,818
1,921
-2.59%
14.35
ADRO
1,045
1,110
1,040
1,100
1,030
6.80%
1,038
1,004
968
1,074
1,108
1,144
1,178
1,038
1,144
0.92%
6.01
HRUM
1,505
1,570
1,500
1,500
1,500
0.00%
1,468
1,449
1,398
1,519
1,538
1,589
1,608
1,468
1,589 -45.45%
ITMG
21,400
21,900
21,350
21,850
21,200
3.07%
21,350
21,075
20,800
21,625
21,900
22,175
22,450
21,350
22,175 -23.33%
INCO
3,630
3,670
3,610
3,610
3,550
1.69%
3,590
3,570
3,530
3,630
3,650
3,690
3,710
3,590
3,690
36.23%
43.49
TINS
1,140
1,170
1,110
1,165
1,120
4.02%
1,123
1,086
1,063
1,146
1,183
1,206
1,243
1,123
1,206
7.77%
16.88
Mining
8.20
5.62
Basic Industries
CPIN
4,200
4,240
4,195
4,240
4,120
2.91%
4,198
4,174
4,153
4,219
4,243
4,264
4,288
4,198
4,264
25.63%
26.34
MAIN
3,255
3,260
3,235
3,240
3,245
-0.15%
3,235
3,223
3,210
3,248
3,260
3,273
3,285
3,235
3,273
2.05%
24.92
JPFA
1,195
1,210
1,185
1,195
1,180
1.27%
1,183
1,171
1,158
1,196
1,208
1,221
1,233
1,183
1,221
-2.05%
59.75
INTP
23,850
24,025
23,825
24,025
23,600
1.80%
23,838
23,731
23,638
23,931
24,038
24,131
24,238
23,838
24,131
20.13%
19.58
SMCB
2,415
2,455
2,415
2,425
2,410
0.62%
2,400
2,388
2,360
2,428
2,440
2,468
2,480
2,400
2,468
6.59%
14.35
SMGR
15,775
16,025
15,700
16,025
15,575
2.89%
15,738
15,556
15,413
15,881
16,063
16,206
16,388
15,738
16,206
13.25%
18.23
WTON
1,150
1,170
1,145
1,170
1,140
2.63%
1,148
1,134
1,123
1,159
1,173
1,184
1,198
1,148
1,184
-
31.62
6,900
6,675
6,875
6,650
3.38%
6,675
6,563
6,450
6,788
6,900
7,013
7,125
6,675
7,013
1.10%
14.72
Misc. Industries
ASII
6,700
Consumer
AISA
2,200
2,220
2,190
2,190
2,190
0.00%
2,180
2,170
2,150
2,200
2,210
2,230
2,240
2,180
2,230
53.15%
16.34
ICBP
11,000
11,100
10,950
11,050
10,900
1.38%
10,950
10,875
10,800
11,025
11,100
11,175
11,250
10,950
11,175
8.33%
23.41
INDF
6,425
6,600
6,425
6,575
6,400
2.73%
6,413
6,331
6,238
6,506
6,588
6,681
6,763
6,413
6,681
-0.38%
10.50
ROTI
1,205
1,230
1,190
1,225
1,195
2.51%
1,195
1,173
1,155
1,213
1,235
1,253
1,275
1,195
1,253
20.10%
25.52
56,700
57,050
56,500
56,925
56,225
1.24%
56,538
56,244
55,988
56,794
57,088
57,344
57,638
56,538
57,344
35.54%
19.32
KLBF
1,680
1,705
1,675
1,705
1,680
1.49%
1,678
1,661
1,648
1,691
1,708
1,721
1,738
1,678
1,721
36.40%
40.60
UNVR
29,950
31,100
29,950
31,100
29,875
4.10%
29,950
29,375
28,800
30,525
31,100
31,675
32,250
29,950
31,675
19.62%
43.62
ASRI
457
463
455
458
456
0.44%
454
450
446
458
462
466
470
454
466
6.51%
7.27
BEST
605
610
580
580
600
-3.33%
578
564
548
594
608
624
638
578
624
30.34%
15.26
BSDE
1,530
1,565
1,530
1,565
1,520
2.96%
1,530
1,513
1,495
1,548
1,565
1,583
1,600
1,530
1,583
21.32%
14.76
CTRA
1,090
1,115
1,085
1,100
1,075
2.33%
1,080
1,068
1,050
1,098
1,110
1,128
1,140
1,080
1,128
46.67%
18.33
CTRP
750
760
750
760
745
2.01%
750
745
740
755
760
765
770
750
765
22.58%
38.00
LPKR
1,045
1,065
1,040
1,060
1,040
1.92%
1,040
1,028
1,015
1,053
1,065
1,078
1,090
1,040
1,078
16.48%
17.97
444
447
443
444
440
0.91%
442
441
438
445
446
449
450
442
449
64.44%
13.06
ADHI
2,710
2,745
2,695
2,730
2,680
1.87%
2,695
2,670
2,645
2,720
2,745
2,770
2,795
2,695
2,770
80.79%
75.83
PTPP
2,510
2,575
2,500
2,570
2,500
2.80%
2,503
2,464
2,428
2,539
2,578
2,614
2,653
2,503
2,614 121.55%
50.39
TOTL
930
945
920
925
925
0.00%
915
905
890
930
940
955
965
915
955
85.00%
21.02
WIKA
2,855
2,910
2,855
2,900
2,855
1.58%
2,850
2,825
2,795
2,880
2,905
2,935
2,960
2,850
2,935
83.54%
26.61
WSKT
945
970
940
965
935
3.21%
940
925
910
955
970
985
1,000
940
GGRM
Property
PWON
985 138.27% 321.67
Infrastructure
EXCL
5,500
5,675
5,400
5,475
5,750
-4.78%
5,350
5,238
5,075
5,513
5,625
5,788
5,900
5,350
5,788
5.29%
TLKM
2,700
2,730
2,690
2,720
2,685
1.30%
2,690
2,670
2,650
2,710
2,730
2,750
2,770
2,690
2,750
26.51%
18.76
PGAS
JSMR
Finance
BBCA
BBNI
BBRI
BBTN
BMRI
Trade
AKRA
UNTR
ACES
ERAA
LPPF
MPPA
TELE
SCMA
BHIT
BMTR
5,850
6,225
5,950
6,275
5,825
6,175
5,925
6,275
5,850
6,175
1.28%
1.62%
5,825
6,200
5,763
6,138
5,700
6,100
5,888
6,238
5,950
6,300
6,013
6,338
6,075
6,400
5,825
6,200
6,013
6,338
32.40%
32.80%
17.79
28.39
13,325
5,700
10,600
1,105
10,050
13,400
5,775
10,825
1,125
10,175
13,250
5,650
10,575
1,100
10,025
13,375
5,725
10,825
1,110
10,175
13,325
5,625
10,500
1,105
10,000
0.38%
1.78%
3.10%
0.45%
1.75%
13,275
5,650
10,588
1,095
10,038
13,188
5,588
10,456
1,085
9,956
13,125
5,525
10,338
1,070
9,888
13,338
5,713
10,706
1,110
10,106
13,425
5,775
10,838
1,120
10,188
13,488
5,838
10,956
1,135
10,256
13,575
5,900
11,088
1,145
10,338
13,275
5,650
10,588
1,095
10,038
13,488
5,838
10,956
1,135
10,256
39.32%
44.94%
49.31%
27.59%
29.62%
22.48
11.16
11.25
8.60
12.06
4,815
17,100
800
990
15,200
3,300
940
3,370
317
1,900
4,840
17,725
810
1,005
15,450
3,325
950
3,445
335
1,940
4,745
16,875
790
985
15,100
3,220
935
3,355
317
1,900
4,765
17,675
795
1,000
15,150
3,230
940
3,400
331
1,940
4,805
17,050
795
985
15,200
3,295
940
3,390
317
1,900
-0.83%
3.67%
0.00%
1.52%
-0.33%
-1.97%
0.00%
0.29%
4.42%
2.11%
4,743
16,963
788
985
15,000
3,213
933
3,340
315
1,900
4,696
16,494
779
975
14,875
3,164
926
3,303
307
1,880
4,648
16,113
768
965
14,650
3,108
918
3,250
297
1,860
4,791
17,344
799
995
15,225
3,269
941
3,393
325
1,920
4,838
17,813
808
1,005
15,350
3,318
948
3,430
333
1,940
4,886
18,194
819
1,015
15,575
3,374
956
3,483
343
1,960
4,933
18,663
828
1,025
15,700
3,423
963
3,520
351
1,980
4,743
16,963
788
985
15,000
3,213
933
3,340
315
1,900
4,886
18,194
819
1,015
15,575
3,374
956
3,483
343
1,960
8.91%
-6.97%
34.75%
0.00%
37.73%
66.49%
51.61%
29.52%
-2.65%
2.11%
25.76
10.46
24.84
9.09
89.64
85.00
24.74
39.08
7.70
22.56
e3
30.76
Page 33
Global Economic Calendar
Monday
27-Oct
GER
GER
Hour
Event
Jakarta
27th-2nd Retail Sales
4:00 PM German Ifo Business Climate
Tuesday
28-Oct
USA
USA
7:30 PM Core Durable Goods Orders
9:00 PM CB Consumer Confidence
m/m
Index
Sep
Oct
-0.20%
94.5
0.50%
87.4
0.40%
86
Wednesday
29-Oct
JPN
USA
6:50 AM Prelim Industrial Production
9:30 PM Crude Oil Inventories
m/m
w/w
Sep
w4 Oct
2.7%
2.1
2.30%
3.3
-1.50%
7.1
Thursday
30-Oct
USA
USA
AUS
GER
USA
USA
1:00 AM
1:00 AM
Tentative
All Day
7:30 PM
7:30 PM
FOMC Statement
Federal Funds Rate
Mid-Year Economic and Fiscal Outlook
Preliminary CPI
Advance GDP
Unemployment Claims
JPY
Europe
Europe
USA
Tentative
5:00 PM
5:00 PM
8:55 PM
BoJ - Monetary Policy Statement
CPI Flash Estimate
Unemployment Rate
Revised UoM Consumer Sentiment
Date
Friday
31-Oct
Saturday
1-Nov
Country
CHN
8:00 AM Manufacturing PMI
Period
Actual
Consensus
m/m
Index
Sep
Oct
103.2
104.6
2.50%
104.7
Prev
< 0.25% < 0.25% < 0.25%
Annual
m/m
q/q
w/w
Oct
3Q 14
w4 Oct
-0.10%
3.10%
277
0.00%
4.60%
m/m
m/m
m/m
Oct
Sep
Oct
0.40%
11.50%
86.4
0.30%
11.50%
m/m
Oct
51.1
51.1
Supplement: Global & Local Events
Fuel Price Increase by Government
The planned to increase the price of subsidized fuel in early November 2014 by President Joko Widodo considered not affect
the rise in prices in the market. Although the planned of increase in fuel price has been widely reported by the media, but the
market still seems to be to wait and see whether the certainty on 1 November 2014 and the new government Joko Widodo and
Jusuf Kalla realize the plan or not. Nevertheless, it should be prevented hoarding basic commodities or other economic materials for the economic interests so as not to cause turmoil.
FOMC Statement
The Federal Reserve said it sees further improvement in the labor market while confirming it will end an asset-purchase program that has added $1,66 trillion to its balance sheet. “Labor market conditions improved somewhat further, with solid job
gains and a lower unemployment rate”, the Federal Open Market Committee said today in a statement in Washington. A range
of labor market indicators suggests that underutilization of labor resources is gradually diminishing, modifying earlier language
that referred to “significant underutilization” of labor resources. Policy makers maintained a pledge to keep interest rates low
for a “considerable time.” While saying inflation in the near term will probably be held down by lower energy prices, they repeated language from their September statement that the likelihood of inflation running persistently below 2% has diminished
somewhat.
e4
Page 44
Disclaimer & Contacts
Research Team:
Reza Priyambada
[email protected]
Bagus Permadi
[email protected]
Agustini Hamid
[email protected]
Hendrik Panca
[email protected]
Raphon Prima
[email protected]
DISCLAIMER
This report, and any electronic access to it, is restricted to and intended only for clients of PT Woori Korindo Securities Indonesia
or a related entity to PT Woori Korindo Securities Indonesia. This document is for information only and for the use of the recipient. It is not to
be reproduced or copied or made available to others. Under no circumstances is it to be considered as an offer to sell or solicitation to buy
any security. Any recommendation contained in this report may not to be suitable for all investors. Moreover, although the information contained herein has been obtained from sources believed to be reliable, its accuracy, completeness and reliability cannot be guaranteed. We
expressly disclaim any responsibility or liability (express or implied) of P.T. Woori Korindo Securities Indonesia, its affiliated companies and
their respective employees and agents whatsoever and howsoever arising (including, without limitation for any claims, proceedings, action,
suits, losses, expenses, damages or costs) which may be brought against or suffered by any person as a results of acting in reliance upon the
whole or any part of the contents of this report and neither PT Woori Korindo Securities Indonesia, its affiliated companies or their respective
employees or agents accepts liability for any errors, omissions or misstatements, negligent or otherwise, in the report and any liability in
respect of the report or any inaccuracy therein or omission therefrom which might otherwise arise is hereby expresses disclaimed.
All rights reserved by PT Woori Korindo Securities Indonesia
PT. Woori Korindo Securities Indonesia
Member of Indonesia Stock Exchange
Head Office :
Wisma Korindo 7th Floor
Jl. M.T. Haryono Kav. 62
Pancoran, Jakarta 12780
Indonesia
Telp: +62 21 7976202
Fax : +62 21 7976206
Branch Office Pluit:
Jl. Pluit Kencana Raya
Blok O No. 79 B-C, Pluit Penjaringan
Jakarta 14450
Indonesia
Telp : +62 21 66675088
Fax : +62 21 66675092
Branch Office Solo :
Jl. Ronggowarsito No. 8
Kota Surakarta
Jawa Tengah 57111
Indonesia
Telp: +62 271 664763
Fax : +62 271 661623
A Member of NongHyup Financial Group
Seoul | New York | London | Hong Kong | Singapore | Shanghai | Beijing | Hanoi | Ho Chi Minh City |
Jakarta
PT Woori Korindo Securities Indonesia — Daily Morning Brief
Page 55


© Copyright 2026