
R Cooper, I Soltero, K Liu, D Berkson, S Levinson... 1980;62:97-104 doi: 10.1161/01.CIR.62.1.97
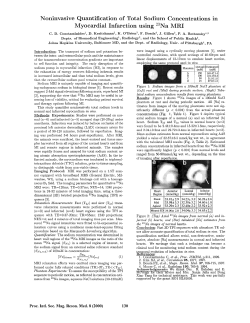
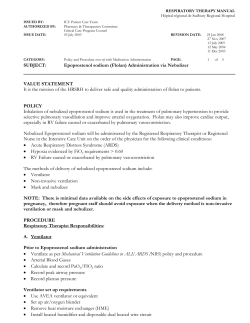
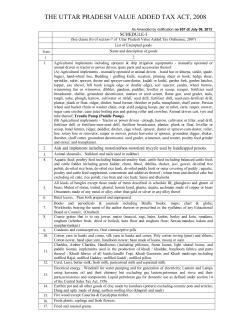
The association between urinary sodium excretion and blood pressure in children.
R Cooper, I Soltero, K Liu, D Berkson, S Levinson and J Stamler
Circulation. 1980;62:97-104
doi: 10.1161/01.CIR.62.1.97
Circulation is published by the American Heart Association, 7272 Greenville Avenue, Dallas, TX 75231
Copyright © 1980 American Heart Association, Inc. All rights reserved.
Print ISSN: 0009-7322. Online ISSN: 1524-4539
The online version of this article, along with updated information and services, is located on
the World Wide Web at:
http://circ.ahajournals.org/content/62/1/97
Permissions: Requests for permissions to reproduce figures, tables, or portions of articles originally
published in Circulation can be obtained via RightsLink, a service of the Copyright Clearance Center, not the
Editorial Office. Once the online version of the published article for which permission is being requested is
located, click Request Permissions in the middle column of the Web page under Services. Further
information about this process is available in the Permissions and Rights Question and Answer document.
Reprints: Information about reprints can be found online at:
http://www.lww.com/reprints
Subscriptions: Information about subscribing to Circulation is online at:
http://circ.ahajournals.org//subscriptions/
Downloaded from http://circ.ahajournals.org/ by guest on August 22, 2014
The Association Between Urinary Sodium Excretion
and Blood Pressure in Children
RICHARD COOPER, M.D., IVAN SOLTERO, M.D., KIANG Liu, PH.D.,
DAVID BERKSON, M.D., SOPHIE LEVINSON, M.D., AND JEREMIAH STAMLER, M.D.
SUMMARY This study explored the association between sodium excretion and blood pressure (BP). A new
method was used to minimize the measurement error introduced by the large intrinsic variability of 24-hour
sodium excretion. The ratio of intra- to interindividual variation was used to estimate the number of
measurements needed to characterize the individual. When seven consecutive 24-hour samples were collected
from 73 children, ages 11-14 years, a significant correlation between mean individual sodium excretion and BP
was demonstrated. The independent relationship persisted when controlling for height, weight, pulse, age, sex
and race (p = 0.045), but was eliminated by simultaneously considering mean creatinine excretion. Although
the cross-sectional association described is quantitatively weak, a linear relationship between BP and sodium
over the range consumed in this society could be important for prevention.
CHRONIC HIGH SODIUM INTAKE has long
been thought to play a role in the development of high
blood pressure.' Cross-cultural comparisons support
the hypothesis of a sodium-blood pressure relationship, and extremes of sodium intake, both high and
low, have been shown to alter blood pressure. 1-2 The
association within a population, however, over the
range usually ingested by industrialized societies, has
been difficult to demonstrate."1-8 Using a new approach, this study shows a positive cross-sectional
association between sodium excretion and blood pressure in children ages 11-14 years.'9' 20
Methods
The study was an extension of a blood pressure survey among children in the parochial schools of
Chicago (Levinson S, Berkson D: manuscript in
preparation). Through contact with interested science
teachers and school personnel, two schools were
chosen for an intensive study of the relation of sodium
excretion and blood pressure. The proposed study was
presented as part of the curriculum to science classes
of the sixth through eighth grades and the children
were asked, with parental consent, to volunteer. The
relationship between nutrition and cardiovascular disease was posed in general terms and salt intake was
mentioned as one of several dietary factors. The participants were requested not to alter their usual eating
patterns.
From the Department of Community Health and Preventive
Medicine, Northwestern University Medical School, and the Heart
Disease Control Program, Division of Adult Health and Aging,
Chicago Health Department, Chicago, Illinois.
Supported by NHLBI grant 1 BOL HL23468-01 and the
American Heart Association.
This work was done while Dr. Cooper and Dr. Liu were postdoctoral trainees in Cardiovascular Epidemiology, Biostatistics, Nutrition and Preventive Cardiology, supported by the NHLBI, NIH,
USPHS, and while Dr. Soltero was a fellow of Consejo Nacional de
Investigaciones Cientificas y Tecnologicas, Caracas, Venezuela.
Address for correspondence: Richard Cooper, M.D., Department
of Community Health, Northwestern University Medical School,
303 East Chicago Avenue, Chicago, Illinois 60611.
Received July 13, 1979; revision accepted December 20, 1979.
Circulation 62, No. 1, 1980.
A description of the study population recruited
from the two schools is presented in table 1. All the
students in school A were black and those in school B
were white. Of 108 students in three target classrooms,
78 (72.2%) volunteered and complete records are
available for 73 (67.6%).
Previous experience and statistical analysis indicated that the crucial methodologic problem involved minimizing sizable measurement error introduced by a high ratio of intra- to interindividual
variation in daily sodium excretion.19 Based on findings in adults, we estimated that seven 24-hour urinary
sodium determinations were needed to characterize
the individual.19
Groups of six to 10 children were carefully instructed on the procedure for collection of 24-hour
urine samples. The sample was divided into an overnight portion, defined as any urine voided after going
to bed at night and first morning void, and daytime
sample, the remainder of the day. Carrying cases and
plastic bottles were provided each student on a daily
basis. Every effort was made to collect the seven
samples on consecutive days. When a child was ill,
missed school or accidently discarded urine, an additional 24-hour sample was obtained the following
week. Although not necessarily the same day of the
week, repeat weekday samples were collected on a
week day and repeat weekend samples on a weekend.
Children were encouraged to remain in the study until
all seven samples were collected. Only three children,
who, clearly experienced difficulty, were dropped.
Overall, participation and interest in the project
remained high throughout. Mean creatinine excretion,
standardized for body weight, was well within the
accepted normal range for this age, suggesting adequate collection for the group. Random variation in
completeness of collection would be included in the estimates of intraindividual variation and only weaken
the potential sodium-blood pressure relationship. Two
24-hour samples containing only 1.0 mEq of sodium
each were discarded at the time of analysis as incomplete collections.
Height and weight were measured in light street
clothes with shoes. Blood pressure was obtained in a
quiet room in the sitting position, with arm resting on
97
Downloaded from http://circ.ahajournals.org/ by guest on August 22, 2014
CIRCULATION
98
TABLE 1. Characteristics of Study Population
School A School B
Characteristic
Students enrolled in
participating classes
50
108
Students who volunteered
and completed the study
48
30
78
Participants with
complete data
45
28
73
17
17
27
Age (years)
11
12
13
11
-
14
16
23
6
Sex
Boys
Girls
19
26
12
16
Results
Group mean values for blood pressure and other
variables on the 73 participants are presented in table
2, by sex and school. The impact of age on many of the
variables is readily apparent in the contrast between
the two schools. Children in school A were a grade
above those in school B and were an average of 1.4
years older. Except for heart rate, all measurements
were consequently higher in school A. The difference
between the schools was particularly marked for
urinary creatinine, 1.7 times greater for school A
students.
Boys were 4.4 pounds heavier than girls, although
virtually identical in age and height, and had higher
systolic blood pressures and lower heart rates. They
had higher daily levels of excretion of sodium, potassium and creatinine compared with girls.
Measurement of diastolic blood pressure was subject to more variability than systolic and was less
reproducible, in part because only the fifth phase was
recorded. The coefficient of variation for diastolic was
15.6%, while only 1 1. 1% for systolic. Similarly, the
correlation between the mean of the two measurements at the first and second sessions was 0.600 for
systolic and 0.343 for diastolic. Correlation between
the means of the two visits for heart rate was 0.568.
Daily urinary sodium excretion by sex and school is
presented in table 3 and for the entire sample in figure
1. The nadir in sodium output for the pooled sample
was on Wednesday, and the maximum on Saturday.
The coefficient of variation also tended to increase
toward the latter part of the week, particularly on
Saturday. School A and school B clearly followed
different patterns in the trend of sodium excretion over
the week, while boys and girls were similar, reflecting
the pattern of their school. These differences were also
apparent in the urine volume and were noted during
the study. Diet records and direct questioning
suggested that the black children in school A tended to
eat away from home, particularly in the fast-food
Total
58
VOL 62, No 1, JULY 1980
23
6
31
42
table at heart level, after 5 minutes of rest. Pulse rate
counted for 30 seconds and blood pressure
recorded with both random-zero sphygmomanometer
and standard mercury instrument; after a 30-second
pause the same procedure was repeated. Fifth-phase
diastolic Korotkoff sounds were recorded. Two
observers made all blood pressure measurements.
They had been trained and certified by the procedure
used in the Hypertension Detection and Follow-up
Program.21 The same measurements were made
before and after the week of urine collection, at an interval of about 4-6 weeks. The average of four
random-zero readings was used in the analysis.
Urine samples were analyzed by automated
laboratory methods for sodium, potassium and
creatinine. Duplicate samples were submitted blind to
the laboratory for approximately 10% of samples; a
technical error of 5% was estimated for sodium.
a
was
TABLE 2. Blood Pressure and Related Variables by Sex and School
Pooled
SD
Variable
Mean
Age (years)
12.2
0.9
Weight (lbs)
109.8
22.8
Height (in)
61.6
4.3
Body mass index
20.3
3.6
10.4
94.1
Systolic BP (mm Hg)
Diastolic BP (mm Hg)
57.8
9.0
Heart rate (beats/min)
79.3
10.1
7-day average
sodium (mEq)
132.7
43.5
7-day average
creatinine (mg)
856.9 357.6
7-day average
41.4
potassium (mEq)
12.6
=
Abbreviation: BP blood pressure.
Boys
Mean
SD
Girls
SD
Mean
School A
Mean
SD
12.8
0.7
20.8
115.6
62.9
4.5
20.7
3.7
8.8
95.0
58.9
8.6
76.7
9.8
School
Mean
11.4
100.7
59.6
19.8
92.6
56.2
83.5
B
SD
12.3
112.4
61.8
20.7
95.8
57.6
75.6
1.0
25.0
4.8
3.7
10.1
9.4
10.6
12.2
108.0
61.5
20.1
92.9
58.1
82.0
0.8
21.2
3.9
3.6
10.5
149.2
46.0
120.6
37.6
140.0
47.3
121.1
34.3
1015.8
389.7
739.6
283.3
1011.9
318.7
607.8
266.8
46.8
12.6
37.5
11.2
42.2
12.2
40.2
13.4
8.8
8.8
Downloaded from http://circ.ahajournals.org/ by guest on August 22, 2014
0.5
23.3
3.0
3.5
12.6
9.6
9.2
99
SALT AND BP IN CHILDREN/Cooper et al.
TABLE 3. Urinary Sodium Excretion (mEq) by Day of the Week
Mon
Tues
Sun
Sample
n
127.7
128.3
130.9
Mean
73
Pooled
53.4
50.2
SD
56.7
Mean
Thurs
134.0
Fri
135.8
Sat
149.8
Average
132.7
60.6
63.3
73.2
84.6
43.5
153.6
151.7
135.9
138.5
141.4
155.6
167.6
149.2
52.9
54.3
54.6
71.1
67.8
82.3
102.4
46.0
114.1
109.9
122.6
111.1
128.5
121.1
136.6
120.6
54.0
45.8
46.6
49.3
60.0
62.7
66.9
37.6
128.7
122.4
135.6
132.9
142.4
148.1
170.1
140.0
59.1
52.5
52.0
68.1
68.5
82.2
94.9
47.3
134.4
136.1
117.0
106.4
120.5
115.9
117.0
121.1
53.5
54.8
45.9
42.3
52.2
51.2
51.0
34.3
31
Boys
SD
Mean
Girls
42
SD
Mean
School A
45
SD
Mean
School B
28
SD
restaurants, on Friday and Saturday, while the ethnic
European families in school B celebrated Sunday feast
days.
A correlation matrix of the related variables is
presented in table 4. A high degree of intercorrelation of many of the variables is apparent. Systolic
blood pressure correlated positively (p = 0.001)
with diastolic blood pressure, sodium, potassium,
creatinine, weight and height. Sodium, potassium,
creatinine, weight and age are also interrelated. The
level of systolic-diastolic correlation is not high
(0.456) and sodium and diastolic are not related. Both
findings probably reflect the lower diastolic pressure in
boys than that in girls, as noted previously (table 2).
Within this 4-year age span, chronological age was unrelated to both systolic and diastolic blood pressure,
although it was a strong determinant of height, weight
and sodium. Heart rate fell with age, as expected,
producing a consistent set of negative correlations
between heart rate and other variables. Sodium/
pound bore no relation to blood pressure and the
significant correlations that it gave rise to (i.e., with
sodium, potassium, weight, and body mass index)
must be dismissed as spurious, since the same or a
highly correlated variable is considered in both parts
of the correlation. The ratio of sodium to potassium is
150i
134.0
127.7
128.3
H
122.8
Na
meq
Wed
122.8
100
56.7t
534
50 50.
SUNDAY
MONDAY
TUESDAY
WEDNESDAY THURSDAY
not correlated with systolic blood pressure, although
there is a significant negative correlation with diastolic
pressure (p < 0.05). Weight is apparently a central
determinant of all the measured variables, being
significantly correlated with each of them except the
sodium/potassium ratio.
From the univariate analysis it is readily apparent
that the crucial issue in testing the relationship
between sodium and blood pressure is the potential
confounding influence of body size, particularly
weight. Sodium and weight are presented in bivariate
analysis in table 5. Higher sodium excretion is
associated with higher blood pressure for each weight
category except between sodium tertile 1 and tertile 2
for children under 109 pounds. Systolic blood pressure
in sodium tertile 3 compared with tertile 1 is
significantly greater for the children who weighed 109
pounds or more (p < 0.05).
To test further the independent relation of sodium
to blood pressure, multiple linear regression analyses
were done (table 6). In equation I, with both weight
and height included as measures of body size, sodium
was significantly related to systolic blood pressure
(p = 0.045). Weight was the only other statistically
significant variable (p = 0.011) and no contribution
was made by age, sex, race, heart rate or height. Body
H
H
135.8
FRIDAY
149.8
SATURDAY
132.7
FIGURE 1. Chicago school children study
on salt and blood pressure urinary sodium
excretion by day of the week.
43.5
AVERAGE
A= X
t= SD
Downloaded from http://circ.ahajournals.org/ by guest on August 22, 2014
CIRCULATION
100
0) I
m
-
bl0
to
10
P-
m
COD
ci
'd1CS66
1,4.
d
t:t r4
0 N 10Ci CXO
0
,o
co
6
4-
n 00
o csc
z c66
"0$
0
0 0
04
0 &4
mO C)
CO
0
0e
0) to
o,
++
10
Cm
6-
0
CO
C
0
ci 0
CO'
6dc; 61 6
o
I:d4 -
---4
Co
0
CO
0
to
"-
CO
r-
statistical significance (equation III). However,
potassium entered in the multivariate analysis instead
of sodium was significantly related to systolic pressure
-
4-
(equation IV).
When creatinine was included in the multivariate
analysis, it had a strong and independent relationship
to systolic blood pressure, overriding the effect of
sodium (table 6, equation IV). To assess whether there
In
*
cc
cq
d
CO
CO
1O
was a pattern of creatinine output suggestive of a
dietary influence, average output by day of the week
was examined (table 7). Day-by-day variation was
small, less than for sodium; the maximum day exceeded the minimum by 11.1Y% for creatinine and
22.0% for sodium. Parallel trends for sodium and
creatinine were generally apparent for the sample
divided by school and by sex (data not shown). Meat
and salt in the diet may have varied from day to day in
a similar fashion, although the parallel trend could
also represent the degree of completeness of collection. Detailed dietary data are necessary to resolve
that issue.
Based on equation I, table 6, the total variance "explained" by the variables in this model was 30%. With
creatinine in the analysis, 39% of the variance in
systolic pressure is accounted for.
The same set of equations with diastolic blood
pressure as the dependent variable did not yield a consistent set of results. Height and weight as well as
sodium were not related, although creatinine was
I
In ".4
0
o
O 10
O 00X
0
e
6
oo
1
P-
6666
0
St
%D
Co
CO
'-4
0
Ci
c6
6
d 6666dd d
l
P.,
~4)
mass index was only poorly correlated with blood
pressure and left a large independent role for sodium
(equation II). The ratio Na+/K+ did not approach
1-4-
+C
b*
cq
0
cq
0
0
)-
cc
CD
ul0
c6 6
*
1.0
cq
*
10
00
C)
6 cmCi
d d 6(C
I
++
CO
c;
I
co
cO
m
p"4
6m
~0
mt +4
ko
10
*
C)
cq
4f-
+4
*
0
CO
CO
+
CO
Ci
o
o
o
Ci
4F
10
6
00
+4
*
44CO coC') m 0
cq
6e c; 6 6 d
X
10
+4*
F+4+
10 CO
10
Coo 10 co 0
CO
i C. 10
CO CO
10
d4 Ci
10
"0
"0
C)
.0
O
Co
Coo
CO
0
-
;:
+4
1.
Co
Q)
.0
0~
X m~
V
c;J2
1.2
a)
10m
1.
~14
*tao0
6
;
*
~Q
...
'7,
11
->p
pps
¢.v
O
&
S S w
+ 0o
w
g
VOL 62, No 1, JULY 1980
OSO'
g"0
0:a
~t
mAt
V V VQ1*.
A
P. P
again significant.
The overnight sample also showed no significant
relation with systolic pressure. Again, with use of the
variables in equation I, the coefficient for the mean of
seven overnight sodium values regressed on systolic
blood pressure was 0.532 (p = 0.343).
This study sampled children over a year apart in
mean age, from two different schools (table 2). The
age-related differences in means of measured variables
introduce the possibility that the relationship between
sodium and blood pressure may be a result of combining noncomparable samples. This problem was examined in several ways: None of the differences in
mean values for school A compared to school B are
statistically significant, although for sodium output it
is on the boundary. To test whether the higher sodium
excretion in school A is chiefly an age effect, children
of the same age (12 years old) in the two schools were
compared; the difference was not significant. Further,
with correction for age and weight between schools,
the samples were similar in sodium excretion.
The relationship of sodium excretion and systolic
pressure was also assessed for each school separately.
Based on the variables in equation I, table 6, the
coefficient for sodium in school A was 0.555, and for
school B 0.610. Although neither of these values is
statistically significant given the small sample sizes,
their similar magnitude suggests an equivalent role for
sodium in each sample. For the larger sample in
Downloaded from http://circ.ahajournals.org/ by guest on August 22, 2014
SALT AND BP IN CHILDREN/Cooper
et
al.
101
TABLE 5. Average Systolic Blood Pressure for Categories Classified by Average 24-hour Sodium and Weight
Na
excretion
(mEq)
< 117
117-139
> 140
n
Weight < 109 lbs
Mean
SD
90.07
88.96
93.67
15
13
9
t
t test
upper vs
=
n
10.25
6.54
9.37
Weight > 109 lbs
Mean
SD
91.44
98.15
100.46
9
13
14
(0.86
t
=
10.85
10.93
10.41
n
All
Mean
SD
24
26
23
90.58
94.06
97.80
10.27
9.77
10.37
2.00*
t
=
2.45*
lower quantile
*p < 0.05 for one-tailed test.
TABLE 6. Regression Equations of Systolic Blood Pressure on Related
Equation I
Equation II
Coeffi- Standard Coeffi- Standard
Variable
cient
error
cient
error
Average 24-hour
sodium (mEq)
0.059 0.029
0.085 0.029
(p = 0.005)
(p = 0.045)
Average 24-hour
creatinine (mg)
Variables
Equation III
Coeffi- Standard
cient
error
0.020
(p
(p
Sodium:potassium
-0.506
1.719
(p = 0.769)
0.308 0.327
(p = 0.350)
0.159
0.061
Height (in)
Weight (Ibs)
(p
mass
=
0.011)
index
Age (years)
=
0.014
Average 24-hourq
potassium (mEq)
Body
Equation IV
Equation V
Coeffi- Standard Coeffi- Standard
cient
error
cient
error
0.614
0.323
(p = 0.062)
=
0.030
0.512)
0.005
0.003)
0.224
0.971
(p = 0.024)
0.252
0.328
(p = 0.445)
0.170
0.596
(p = 0.006)
0.122
0.313
(p = 0.698)
0.137
0.058
(p = 0.020)
0.710
0.342
(p = 0.042)
-1.527
1.816
(p = 0.403)
-0.903
1.917
(p = 0.639)
-0.112
2.115
0.958)
1.820
-0.573
(p = 0.754)
-1.590
1.708
(p = 0.356)
-1.239 2.476
(p = 0.618)
-0.573
2.616
(p = 0.827)
2.604
-3.197
(p = 0.224)
-0.653 2.516
(p = 0.796)
1.716 2.517
(p = 0.498)
Race
0.670
3.416
(p = 0.845)
1.869
3.595
(p = 0.605)
2.761
3.827
(p = 0.473)
-0.313
3.417
(p = 0.993)
-3.629
3.504
(p = 0.304)
Heart rate (beats/min)
0.124
0.101
(p = 0.418)
0.131
0.055
(p = 0.676)
0.104
61.425 26.526
(p = 0.024)
74.969 24.563
(p = 0.003)
75.001
Sex
Constant
(p
(p
TABLE 7. Urinary Creatinine Excretion (mg) by Day of the Week
Wed
Tues
Sun
Mon
826.5
Mean
821.4
857.6
864.5
Pooled
439.7
SD
410.4
388.9
385.7
(p
=
=
=
0.138
0.452)
26.124
0.005)
0.069
(p
51.524 26.350
(p = 0.055)
=
0.117
0.559)
73.690 25.266
(p = 0.001)
Thurs
830.1
Fri
884.6
Sat
912.8
Average
409.4
536.7
510.6
357.6
856.9
Mean
977.8
1004.2
1020.7
968.9
966.0
1039.3
1106.4
1011.9
SD
408.6
349.5
364.7
437.7
428.5
598.7
508.8
318.7
Mean
569.1
640.0
595.6
597.5
613.8
636.0
601.5
607.8
SD
266.1
336.0
266.5
339.2
261.7
282.7
332.2
266.4
School A
School B
Downloaded from http://circ.ahajournals.org/ by guest on August 22, 2014
102
CI RCULATION
school A, the p value for sodium and systolic blood
pressure from equation I is 0.06.
Discussion
To test satisfactorily for correlations between
lifestyle and physiologic variables within a population,
the subject must first be adequately characterized.
This task is particularly difficult for sodium flux, given
the large day-to-day intraindividual variation
observed in industrialized societies.'9' 20, 22 Furthermore, even with a fixed intake at usual levels, a 3-day
cyclical fluctuation in output has been described.23 24
Statistical methods for assessing and minimizing the
measurement problem introduced by high intraindividual variability have been presented in detail
elsewhere.'9. 20
In this study when 7-day collection of 24-hour urine
was used to minimize the effects of intraindividual
variability, a significant correlation between mean individual sodium excretion and systolic blood pressure
was demonstrated in univariate, bivariate and multiple regression analyses. With height, weight, pulse,
age, sex and race simultaneously considered, a significant independent role for sodium was recorded.
Dahl and Lover provided impetus to the study of
this relationship by their early work reporting significant correlations between salt intake and blood
pressure among employees at the Brookhaven
Laboratory.25 The original method was based on
history of salt use, subsequently shown to be unreliable; only 28 subjects were studied with urine
collection, and multivariate analyses were not done.2
Positive correlations within a population were also
reported from Belgium by Joosens et al.'8 In multiple
regression analysis, 24-hour sodium excretion was
significantly related to blood pressure for men
(n = 1314), but not for women (n = 713). However,
several different samples were apparently combined
for this analysis, and it is not clear to what degree
differences in group means were taken into consideration. In a subsample of 75 subjects, mean sodium for
10 24-hour collections was significantly correlated
with blood pressure, but height, weight, and other
variables were not controlled. Similar investigations
relying on a single 24-hour collection by Swaye et al.
at the Cleveland Clinic yielded negative results.13
Community-based surveys in Framingham, Evans
County (Georgia), Wales, Mississippi and the Cook
Islands likewise found no association.14-17
Cross-cultural comparisons, and regional comparisons within a country, have frequently shown that
higher salt consumption is associated with higher
blood pressure levels.3-9 Although such studies are
useful in regard to the possible etiologic role of dietary
sodium, they do not resolve the issue of an independent role for sodium. Adequate control for potential
confounding variables, e.g., body size, other dietrelated factors or psychosocial stress, cannot be
readily achieved.
However, a recent study of the Qash' qai tribesmen
of southern Iran, a population with a high sodium in-
VOL 62, No 1, JULY 1980
take and a communal preindustrial lifestyle, strongly
reinforces the hypothesis that excess salt intake contributes to risk of high blood pressure.26 Living as
desert nomads, these tribesmen have access to natural
salt lakes and consume more than 20 g of salt per day;
systolic blood pressure equal to or greater than 140
mm Hg was found in 18% of the adults. Other cultural
factors were not adequately assessed in that brief
report, however. Differences in salt sensitivity may
also play a role in both the inter- and intrapopulation
variation in hypertension, although this has not been
demonstrated.
The ratio of sodium to potassium was not independently related to blood pressure in the present
study. Langford and Watson reported a significant
correlation of blood pressure with that variable using
six 24-hour urine samples.'7 The Stanford Three Community Study, relying on a spot morning void,
reported an association between change in blood
pressure and Na+/K+.27 A significant negative correlation between diastolic pressure and potassium has
also been described.28 In the present Chicago study of
school children, sodium and potassium were the two
most highly correlated variables in this sample
(r = 0.731) and as noted potassium was positively
related to systolic blood pressure (table 6, equation
IV).
Of the variables considered in this study, mean 24hour creatinine excretion had the strongest
relationship to blood pressure. Even weight was less
highly correlated. We are unaware of previous reports
of this phenomenon. In the study of adults, Joosens et
al. reported a significant coefficient for creatinine in a
multiple regression analysis including sodium, but it
was strongly negative.'8
Creatinine is measured as a potential index of completeness of sample collection; however, its intrinsic
variability limits its usefulness for that purpose,29 as
was demonstrated with radioisotope techniques. Muscle mass appears to be the primary determinant of
creatinine excretion. The precise role of animal protein in the diet has not been well defined;30 31 serum
creatinine, for example, has been shown to double in
the hours after a meal of cooked meat.'2 In the present
study, the pattern of creatinine excretion over the
week showed less day-to-day variation than for
sodium and only the suggestion of an increase on
Saturday (table 7). Sacks et al. presented evidence
suggesting that among a group of "macrobiotic"
vegetarians, consumption of animal products was
significantly associated with higher systolic and
diastolic pressures." Other observational reports have
appeared, although the independent role of animal
protein cannot be assessed.34 3' Kempner maintained
that the altered protein composition of the rice-fruit
diet accounted for its antihypertensive effect,
although, of course, it was also very low in sodium.'0
If diet does not account for the interindividual
differences in creatinine excretion, it may represent a
more refined measure of the aspect of body size which
determines blood pressure at this age. Height and
body mass are strongly correlated with blood pressure
Downloaded from http://circ.ahajournals.org/ by guest on August 22, 2014
SALT AND BP IN CHILDREN/Cooper et al.
in adolescent children, with
age
having
no
additional
effect.37 It has been postulated that blood volume may
account for the correlation of body size with blood
pressure.38 Blood volume appears to increase more
with lean body weight than with adipose tissue39 and
blood pressure has been reported as being better correlated with relative weight than adiposity.40 Voors et
al. postulated that while height and other measures of
stature are significantly related to blood pressure in
children, when adulthood is reached other factors
begin to be more important.37 Finally, because this
finding in regard to creatinine has not appeared in
other reports, the possibility must be considered that it
is spurious, i.e., a result of chance alone. Although this
finding must be confirmed before any conclusions are
in both
warranted, its consistency and strength
boys and girls, for both systolic and diastolic pressure
suggest the association is not fortuitous.
Black-white differences in blood pressure have been
inconsistently reported at this age.41-45 The sample size
in this study is too small to test racial differences in
salt intake in a meaningful way. After controlling for
age and weight there was no significant racial
difference in mean sodium output, although the output
for the black children did exceed that of the white
children by 8 mEq. A larger sample might have
yielded a significant result. Given the large difference
in blood pressure known to occur by the third decade
between blacks and whites, factors relating to elevated
blood pressure in adulthood may not operate in
children or may be hidden by the larger influence of
the process of normal growth and development.
The potential public-health importance of a
relationship between sodium intake and blood
pressure has been widely discussed.5 46 Habitual intake has never been adequately characterized for individuals, however, and the relative contribution of excess sodium intake, if any, to the lifelong process of
the development of high blood pressure has not been
clearly defined. Furthermore, a possible threshold
level has not been established. There appear to be only
three moderately well established points on a
dose-response curve of sodium intake and blood
pressure for populations: very low levels, associated
with an absence of hypertension (e.g., South Pacific
Islanders, Amazonian Indians), the usual levels in
industrialized society, and intake over 20 g/day (e.g.,
the Qash' qai, Akita prefecture in northern Japan).3' 5, 6, 26 The Tarahumara Indians of Mexico may
be a possible exception to the linear relationship inferred from those data, with an estimated intake of
2-3 g/day and an absence of elevated blood pressure,
suggesting a threshold effect above the physiologic
minimum.47 The data reported here support the
hypothesis of a linear relationship over the range
presently observed in industrial society, at least for
children. Salt intake is not likely to be the sole
etiologic factor; the twofold greater prevalence of
hypertension among blacks in the U.S. compared with
whites, without demonstrable excess salt intake,
strongly suggests the interaction of multiple causes.
The recommendation in the Dietary Goals for the
103
United States prepared by the Senate Select Committee on Nutrition and Human Needs calls for a reduction in sodium from the current level of 3-4 g/day
to 2 g/day." If a linear response can be anticipated,
the incidence of hypertension would presumably fall
considerably with that preventive measure, although it
is very unlikely that the disease would be eliminated.
More precise estimates of risk associated with a given
level of sodium intake are needed before more secure
recommendations can be proposed. A pressing need
also exists to characterize individual salt use over
several years and examine the relationship to blood
pressure. The demonstration of a method to distinguish short-term differences between individuals
and the association of sodium excretion with blood
pressure reported here are first steps in that direction.
Additional cross-sectional studies with larger sample
sizes, prospective evaluations and randomized experimental trials are needed to elucidate this problem
further.
Acknowledgment
We acknowledge the generous cooperation of Robert Marciante,
Ed.D., and the participating students and teachers of the Catholic
Archdiocese of Chicago. Irma Robinson provided us with technical
assistance without which this study would not have been possible.
References
1. Stamler J, Katz LN, Pick R, Rodbard S: Dietary and hormonal
factors in experimental atherogenesis and blood pressure
regulation. In Recent Progress in Hormone Research, edited by
Pincus G. New York, Academic Press, 1955, pp 401-452
2. Dahl LK: Evidence for an increased intake of sodium in
hypertension based on urinary excretion of sodium. Proc Soc
Exp Biol Med 94: 23, 1957
3. Sasaki N: The relationship of salt intake to hypertension in the
Japanese. Geriatrics 19: 735, 1964
4. Prior IAM, Grimley-Evans J, Harvey HPB, Davidson F,
Lindsey M: Sodium intake and blood pressure in two Polynesian populations. N Engl J Med 279: 515, 1968
5. Page LB, Damon A, Moellering RC: Antecedents of cardiovascular disease in six Solomon Islands societies. Circulation 49: 1132, 1974
6. Oliver WJ, Cohen EL, Neel JV: Blood pressure, sodium intake,
and sodium related hormones in the Yanamamo Indians, a "nosalt" culture. Circulation 52: 146, 1975
7. Freis ED: Salt, volume and the prevention of hypertension. Circulation 53: 580, 1976
8. Meneely GR, Battarbee HD: High sodium-low potassium environment and hypertension. Am J Cardiol 28: 768, 1976
9. Page LB: Epidemiological evidence on the etiology of human
hypertension and its possible prevention. Am Heart J 91: 527,
1976
10. Kempner W: Treatment of hypertensive disease with rice diet.
Am J Med 4: 545, 1948
11. Watkin DM, Froeb HF, Hatch FT, Gutman A: Effects of diet
in essential hypertension. II. Results with unmodified Kempner
rice diet in fifty hospitalized patients. Am J Med 9: 441, 1950
12. Kawasaki T, Delea CS, Bartter FC, Smith H: The effect of
high-sodium and low-sodium intakes on blood pressure and
other related variables in human subjects with idiopathic
hypertension. Am J Med 64: 193, 1978
13. Swaye PS, Gifford RW, Berrettoni JN: Dietary salt and essential hypertension. Am J Cardiol 29: 33, 1972
14. Dawber TR, Kannel WB, Kagan A, Donabedian RK,
McNamara PM, Pearson G: Environmental factors in
hypertension. In The Epidemiology of Hypertension, edited by
Stamler J, Stamler R, Pullman TN. New York, Grune and
Downloaded from http://circ.ahajournals.org/ by guest on August 22, 2014
104
CI RCU LATION
Stratton, 1967, p 255
15. Grim CE, McDonough JR, Dahl LK, Hames CG: Racial
differences in Evans Co, Georgia. (abstr) Circulation 42 (suppl
III): 111-85, 1970
16. Miall WE: Follow-up study of arterial pressure in the population of a Welsh mining valley. Br Med J 2: 1204, 1959
17. Langford H, Watson RL: Electrolytes and hypertension. In
Epidemiology and Control of Hypertension, edited by Paul 0.
New York, Stratton Intercontinental Medical Book Corporation, 1975, pp 119-128
18. Joosens JV, Willems J, Claessens J, Claes J, Lissens W:
Sodium and hypertension. In Nutrition and Cardiovascular
Diseases, edited by Fidanza F, Keys A, Ricci G, Somogyi JC.
Rome, Morgagni Edizioni Scientifiche, 1970, pp 91-1 10
19. Liu K, Cooper R, McKeever J, McKeever P, Byington R,
Soltero 1, Stamler R, Gosch F, Stevens E, Stamler J: Assessment of the association between habitual salt intake and high
blood pressure: methodological problems. Am J Epidemiol 110:
219, 1979
20. Liu K, Cooper R, Soltero I, Stamler J: Variability in 24-hour
urinary sodium excretion in children. Hypertension 1: 631, 1979
21. Hypertension Detection and Follow-up Program Cooperative
Group: The Hypertension Detection and Follow-up Program.
A progress report. Circ Res 40 (suppl I): 1-106, 1977
22. Committee on Nutrition, American Academy of Pediatrics:
Salt intake and eating patterns in infants and children in relation to blood pressure. Pediatrics 53: 115, 1974
23. Baldwin D, Alexander RW, Warner EG: Chronic sodium
chloride challenge studies in man. J Lab Clin Med 55: 362, 1960
24. Black DAK, Thomsen AE: Day-to-day changes in sodium and
water output with and without posterior pituitary extract. Clin
Sci 10: 511, 1951
25. Dahl LK, Lover RA: Evidence for a relationship between
sodium intake and human essential hypertension. Arch Intern
Med 94: 525, 1954
26. Page LB, Vandervert D, Nader K, Lubin N, Page JR: Blood
pressure, diet and body form in traditional nomads of the Qash'
qai tribe, southern Iran. Acta Cardiol 33: 102, 1978
27. Farquhar JW: Relationship of urinary sodium/potassium ratio
to systolic blood pressure: The Stanford Three Community
Study. Presentation, 18th Annual Conference on Cardiovascular Disease Epidemiology, Council on Epidemiology,
American Heart Association, Orlando, Florida, March 1978
28. Walker G, Russell P, Whelton P, Hermann J: Relation between
blood pressure, plasma renin activity, aldosterone, urinary
sodium and potassium in 574 ambulatory subjects (abstr) Circulation 58 (suppl II): 11-165, 1978
29. Scott PJ, Hurle PJ: Demonstration of individual variation in
constancy of 24-hour urinary creatinine excretion. Clin Chim
Acta 21: 411, 1968
30. Peters JP, Van Slyke DD: Quantitative Clinical Chemistry. Vol
1. Interpretations. Baltimore, Williams & Wilkins, 1946
31. Barret E, Addis T: The serum creatinine concentration of nor-
VOL 62, No 1, JULY 1980
mal individuals. J Clin Invest 26: 875, 1947
32. Jacobsen FK, Christensen CK, Mogensen CE, Andreasen F,
Heilskov NSC: Pronounced increase in serum creatinine concentration after eating cooked meat. Br Med J 1: 1049, 1979
33. Sacks FM, Rosner B, Kass EH: Blood pressure in vegetarians.
Am J Epidemiol 100: 390, 1974
34. Malhotra SL: Dietary factors causing hypertension in India.
Am J Clin Nutr 23: 1353, 1970
35. Whyte HM: Body fat and blood pressure of natives in New
Guinea: Reflections on essential hypertension. Aust Ann Med
2: 540, 1958
36. Morse WR, McGill MD, Beh YT: Blood pressure amongst
aboriginal ethnic groups of Szechwan Province, West China.
Lancet 1: 966, 1937
37. Voors AW, Webber LS, Frerichs RR, Berenson GS: Body
height and body mass as determinants of basal blood pressure
in children - the Bogalusa Heart Study. Am J Epidemiol 106:
101, 1977
38. Alexander JK: Obesity and the circulation. Mod Concepts Cardiovasc Dis 32: 799, 1963
39. Alexander JK, Dennis EW, Smith WG, Amad KH, Duncan
WC, Austin RC: Blood volume, cardiac output, and distribution of systemic blood flow in extreme obesity. Cardiovasc Res
Cent Bull 1: 39, 1962
40. Taylor HL: Body composition and elevated blood pressure. In
The Epidemiology of Hypertension, edited by Stamler J,
Stamler R, Pullman TN. New York, Grune and Stratton, 1967,
pp 101-104
41. National Center for Health Statistics: Blood pressure levels of
persons 6-74, United States, 1971-1974. Vital and Health
Statistics, series 11, no 203, US DHEW, PHS, Health
Resources Administration, DHEW publication no (HRA) 781648, Hyattsville MD, 1977
42. Londe S, Goldring D, Gollub SW: Blood pressure and
hypertension in children: studies, problems, and perspectives. In
Juvenile Hypertension, edited by New MI, Levine LS. New
York, Raven Press, 1977, p 13
43. Kilcoyne MM, Richter RW, Alsup PA: Adolescent hypertension: I. Detection and prevalence. Circulation 50: 758, 1974
44. Fixler DE, Laird W, Fitzgerald V, Stead S, Adams R:
Hypertension screening in schools: results of the Dallas study.
Pediatrics 63: 32, 1979
45. Voors AW, Foster TA, Frerichs RR, Webber LS, Berenson
GS: Studies of blood pressure in children, ages 5-14 years, in a
total biracial community: The Bogalusa Heart Study. Circulation 54: 319, 1976
46. Select Committee on Nutritign and Human Needs, United
States Senate: Dietary Goals for the United States. 2nd ed.
Washington DC, US Government Printing Office, 1977
47. Connor WE, Cerqueira MT, Connor RW, Wallace RB,
Malinow MR, Casdorph RH: The plasma lipids, lipoproteins
and diet of the Tarahumara Indians of Mexico. Am J Clin Nutr
31: 1131, 1978
Downloaded from http://circ.ahajournals.org/ by guest on August 22, 2014


© Copyright 2026