
A
A
s we continue to
grow and become
more adventurous, we
would like to welcome
and thank all those who
have decided to join us
in disseminating information to our growing
readership. Of particular note is the
Botswana Bureau of
Standards who have contributed to this edition
of this newsletter and we hope the relationship
that is being forged will be a long and fruitful
one.
Like the first issue the second issue was
received with great enthusiasm and hope the
third edition with slight changes will be just as
appreciated. We have added a “Patient
Corner”, which we shall use to explain the
different terms that patients encounter in their
laboratory result slips. Another section known
as “Straight Talk” has also been added and
this will be dealing with day-to-day issues like
alcohol abuse and HIV AIDS.
It is with great pleasure that we inform
you that the Newsletter is now available on the
world-wide-web on the site www.diagnosticsupdate.com. We hope this will make the
newsletter available to a wider population than
that which we managed with the print version
of the newsletter. As always your opinions are
welcome, on what is in this issue and those to
come. Your contributions can be sent to our
online contact details or to [email protected] or the editor on Moonya
@diagnostics-update.com.
“
Be in perpetual improvement of
your work because you never
know what the next man, your
competitor, is doing to improve
his. [Anonymous]
Till the next issue, stay informed!
Moonya Mangwendeza
”
Diagnofirm Recent Events
1
Comparative Antibiogram
Sensitivity Report
2
Is Sodium Restriction Important to
Hypertension
3
Chlamydia the “Silent Scourge”
5
Key Factors Known to Affect
Haemotology Test
6
Current best practice for Traceability
in Testing Laboratories
7
Is Highly Sensitive (hs)CRP
an Effective Screening Test?
8
Dianostic Allergy Testing
10
A Student’s Perspective
11
Patient’ Corner
12
Tips on Getting the Best Service from
the Laboratory
14
Jokes Corner
14
When Drinking Becomes a Problem
15
by Silas Nunu
Recent Events @ Diagnofirm
B
y our busy standards this has been a
very quiet quarter of the year. Lets see,
what did we manage to do? Diagnofirm
donated blankets to Moshupa AIDS
orphanage, supported a walk from
Gaborone to Selebi Phikwe and the
remainder of the scientists who underwent
training on operation of the Nuclisens
EasyQ viral load analyser and other
laboratory machinery received their
certificates.
With Botswana experiencing a chilly
winter this year, Diagnofirm so it fit to
donate blankets to the most needy in our
midst. AIDS orphans in Moshupa received
thick blankets to help them beat the cold
during those extremely cold nights. For the
director, Mr Iqbal Chand, this donation
was fitting seeing as he grew up in Moshupa.
It was somewhat of a homecoming and an
understanding of the plight faced by his
home community. The Chief of Moshupa,
community elders, Mr Chand and his
family, Diagnofirm staff attended the
donation ceremony and it was covered by
the local media.
Diagnofirm laboratory also furthered
its philanthropic tentacles by supporting a
walk from Gaborone to Selebi-Phikwe for
AIDS orphans. This walk was very successful
as it managed to raise over P120 000 and it
also managed to raise awareness of the plight
of children who are victims of the AIDS
scourge.
Finally there was cheer for a some of
the Laboratory staff who finally got their
training certificates for handling Roche
machinery. As a gesture from Roche
diagnostics and also to validate the class of
personnel at Diagnofirm, the lab scientists
received their certificates of training from
the Director. Albeit without much pomp
and fanfare.
Report Compiled by Bozo/David
Comparative Antibiogram Sensitivity Report
JANUARY TO JUNE 2004
W
herever possible blood, urine,
cerebro-spinal f luid or swabs
should be submitted to the laboratory
before treatment is begun in an effort to
isolate the causative organisms. These
patients may require immediate treatment
with antibiotics without having to wait for
Microbiology results.
In most cases there will be little indication
of the nature of infecting species. At times
there could be more than one organism
causing the infection.
When the causative organism is isolated,
therapy may be changed or restricted as
indicated by the predictable sensitivity of the
organism.
Over a long period of time it can then
be established the sensitivity pattern of
different organisms.
Sensitivity tests of any organism isolated
may reveal a change in antibiotic sensitivity
and as such change may be an indication of
a fresh infection with an organism, which is
resistant to the antibiotic already used.
For a period of 6 months we established
that Escherichia coli and Streptococcus
Group B are the common causes of vaginal
infections besides Candida albicans. Their
sensitivity patterns were compiled and are
indicated by the tables below.
Observations:
Streptococcus Group B
From the table above it can be observed
that Group B Streptococci is developing
resistance to Clindamycin (20%), Fusidic
Acid (22%) and Oxacillin (25%) while
Gentamicin (97%) has become unsuitable
for treatment of Group B Streptococcal
infections.
However the other antibiotics are still
susceptible and therapy can be used for
treatment.
Escherichia coli
From the above table, it can be observed
that Escherichia coli is developing resistance
to Augmentin (11%), Chloramphenicol
(14%), and Piperacillin (8%).
However the rest of the other
antibiotics can still be used for treatment of
Escherichia coli.
The increase in developing of antibiotic
resistance may be attributed to the following:
a) Patients not completing their antibiotic
course.
b) Mis-use of antibiotics by buying them
over the counter e.g. those suffering
from sexually transmitted infections
would just buy these antibiotics without
going to the doctors.
c) Some doctors prescribe antibiotics
without a laboratory report on
sensitivity pattern for the specific
infection.
d) Patients prescribed with a low dosage
of antibiotics.
This then might result in the patient
being admitted to a hospital for treatment
of the particular resistant strain, which
would then be expensive for the patient.
COMPARATIVE ANTIBIOGRAM SENSITIVITY REPORT
Streptococcus gr. B
Escherichia coli
From 01/01/2004 Till 30/06/2004
Description
From 01/01/2004 Till 30/06/2004
Susceptible
Description
Resistant
Susceptible
AM: Ampicillin
0%
100 %
AN: Amikacim
0%
100 %
AUG:Augmentin
0%
100 %
AUG:Augmentin
11 %
89 %
CC: Clindamycin
20%
80 %
C: Chloramphenicol
14 %
86 %
CEFEPIME
0%
100 %
CAZ:Ceftazidime
1%
98 %
CEFPROZIL
0%
100 %
CEFEPIME
0%
100 %
CFC:Cefaclor
0%
100 %
CEFPROZIL
2%
98 %
CIP: Ciprofloxacin
2%
98 %
CFC:Cefaclor
0%
100 %
CRO:Ceftriaxone
0%
100 %
CIP: Ciprofloxacin
3%
97 %
CXM: Cefuroxime
1%
99 %
CRO:Ceftriaxone
0%
100 %
E: Erythromycin
4%
96 %
CXM: Cefuroxime
1%
99 %
F/M: Nitrofuratoin
0%
100 %
F/M: Nitrofuratoin
1%
99 %
FA: Fusidic Acid
22 %
78 %
GAT : Gatifloxacin
3%
97 %
1%
99 %
GM: Gentamicin
1%
99 %
INN : Levofloxacin
2%
98 %
NOR: Norfloxacin
3%
97 %
PIP: Piperacillin
8%
92 %
GAT : Gatifloxacin
GM: Gentamicin
INN : Levofloxacin
NOR: Norfloxacin
OX: Oxacillin
VA: Vancomycin
2
Resistant
97 %
3%
0%
100 %
5%
95 %
25 %
75 %
4%
96 %
By Kiran Bhagat; Cardiac Clinic
Is Sodium Restriction Important to Hypertension?
T
he data showing that sodium is an
important contributor to hypertension derive from a variety of studies.
Epidemiological studies have shown that
sodium intake is directly related to
cardiovascular mortality and to the increase
in blood pressure with aging. Guidelines
recommending sodium reduction for
persons with hypertension were originally
based on literature demonstrating a
decrease in blood pressure with reduction
in sodium intake. However, there have now
been multiple large treatment and outcome
trials demonstrating that a combination of
sodium reduction and other nutritional/
hygienic interventions is as effective as singleagent pharmacological treatment of
hypertension. Long-term studies of saltsensitivity of blood pressure have
demonstrated its adverse prognostic
implications in both hypertensive and
normotensive populations. These results
support the contention that sodium
restriction is a mainstay in the treatment of
prevalence of hypertension or diabetes at
hypertension.
baseline. Subsequently, He et al.[2] looked
What is the relationship between sodium
only at the overweight subjects, in whom
intake and mortality? The INTERnational
these characteristics, as well as BMI, did
study of SALT and blood
not vary
pressure (INTERSALT)
across the
Long-term studies of saltwas a multinational study
range of
sensitivity of blood pressure
of more than 10,000
sodium to
have demonstrated its adverse
persons in 52 centers in
energy raprognostic implications in both
32 countries. Urine sotios, and
hypertensive and normotensive
dium excretion (UNaV),
who were
populations.
blood pressure (BP), and
without a
body mass index (BMI)
history of
were measured. Using only the data for the
coronary disease or stroke at baseline.
12 European countries, Perry and
After adjusting for age, sex, race, systolic
Beevers[1] plotted each country's stroke
BP, cholesterol level, and BMI, there was a
mortality against mean UNaV, which
direct relationship between increasing
reflects average sodium intake. The data
quartiles of the sodium to energy ratio and
were normalized for age, and the
cum-ulative mortality. The rela-tionship
relationship was direct and significant,
was highly significant for all ca-use mortaindependent of BP and BMI. In the United
lity as well as mortality from stroke and
States, the National Health and Nutrition
cardiovascular disease (CVD), although
Examination Survey (NHANES) has
not mortality from coronary heart disease
conducted periodic examinations in
(CHD). All four mortality rates directly
representative communities since 1971. The
correlated with sodium to energy ratio in
NHANES I follow-up study examined
the group as a whole. Similar, although
mortality in 9500 people who were aged
not statistically significant, findings were
25-74 years at the time of the original survey.
seen in the Multiple Risk Factor
Sodium and energy intakes were estimated
Intervention Trial (MRFIT),[3] in which
from dietary recall using food models and
mortality rates from CHD and CVD were
the frequency of adding salt; from these,
greater in the highest quintile of sodium
the ratio of sodium to energy at the baseline
intake estimated from annual diet recalls
visit was derived. In the non-overweight
compared with the lowest. The relationship
subjects, those with a higher ratio were older
was stronger when the results were adjusted
and had higher blood pressure and
for total energy intake.
These large multicentre studies appear
to conflict with the results of Alderman et
al.,[4] who followed 2937 participants in a
work site program in Bronx, NY. Subjects
collected urine 3-4 weeks after stopping
antihypertensive therapy and after 4-5 days
of avoiding sodium. They were then
followed for an average of 3.5 years. Those
in the lowest quartile of UNaV had the
highest rate of cardiovascular events.
However, they also had slightly but
significantly higher BPs during the followup despite treatment, were thinner, and had
lower potassium excretion. Furthermore,
the relationship was found only in men. In
contrast, a positive relationship between
sodium intake and mortality was definitively
demonstrated by a Finnish study.[5] In that
community survey, UNaV was measured
in 2436 subjects at baseline. Using causes
of death from the national health registry,
the authors demonstrated a direct
relationship between increasing sodium
intake and all-cause/CHD/CVD mortality,
as well as with coronary events. The
implication of these studies is that in the
Western world, higher sodium intake is
associated with increased mortality,
particularly from cardiovascular causes.
A variety of population-based surveys
have shown an increase in BP with increasing
sodium intake. INTERSALT was the largest
Continued on next page
3
such study, and it also demonstrated a direct
The placebo group sustained a reduction
relationship between average sodium intake
of BP of 9/9 mm Hg, whereas the treated
in a population and the degree to which BP
groups sustained a reduction of 16/12 mm
increases with aging.[6] The increase was seen
Hg. This difference was sufficient to
in all societies except nonindustrialized ones
decrease the combined end point of major
such as indigenous people of the Amazon
and other cardiovascular outcomes (i.e.,
rain forest, who eat <1 mM sodium per
hospitalization for transient ischaemic
day, have very low energy intake, and die
attack, angina or claudication, and
young, largely from noncardiovascular
peripheral arterial disease) in the treated
causes. Hence, at least in the industrialized
vs. the placebo groups (11% vs. 16%;
p<0.05). However, there was no significant
world, there seems to be a direct relationship
difference in the primary outcome of
between sodium intake and increasing BP
cumulative rates of death or nonfatal
with age.
cardiovascular events between the groups
But is there any evidence that lowering
(5.1% vs. 7.3%; p=0.21). The Trial of Nonsodium intake decreases BP? Metapharma-cological interventions in the
analyses[7] of randomized trials of sodium
Elderly (TONE)[11] studied 975 persons
restriction in subjects with hypertension
aged 60-80 years with BP <145/85 mm
predict BP decreases of 3-6 mm Hg systolic
Hg on monotherapy. They were
and 1-3 mm Hg diastolic for a decrease of
randomized to reduction in sodium (to 80
100 mmol in sodium intake, but this
mmol), weight loss (if obese), both, or usual
decrease in consumption is difficult to
care, and then drug therapy was withdrawn
achieve. In the Dietary Approaches to Stop
after 3 mon-ths. The pri-mary end point
Hypertension (DASH)
was a combitrial,[8] subjects were given
nation of the
Whatever the mechanism,
either a typical US diet or
recurrence of
most subjects with
the DASH diet. In persons
high BP, need
hypertension are salt sensitive for antihyperwith hypertension, this
and should restrict their
tensive treatintervention lowered BP
sodium
intake
to
reduce
BP
ment, or a
by 11/6 mm Hg. The
cardiovascular
and
to
possibly
improve
DASH-Sodium trial furevent.The reoutcomes.
ther randomized subjects to
sult was that
one of three targets: 150
persons
randomized
to
sodium
reduction
mmol, 100 mmol, or 50 mmol sodium, and
alone were significantly more likely to be
actually achieved 142 mmol, 107 mmol, and
free of the end point after 30 months than
65 mmol, respectively. The lowest sodium
those who received usual care. Further,
intake, compared with the highest,
sodium reduction was as effective in
significantly reduced BP on both diets,
reducing the primary outcome as was
although the effect was greater on the typical
weight loss in the obese subjects. In subjects
US diet. DASH-Sodium reduced BP
with hypertension, reducing sodium intake
regardless of race and sex and had the biggest
both lowers BP and helps prevent
effect in subgroups with hypertension.
cardiovascular events.
The final question, and the most
Salt sensi-tivity of BP is defined as an
increase in a person's BP due to a sod-ium
controversial, is whether decreasing sodium
load, and most subjects with hypertension
intake improves outcomes. From
exhibit it. We have studied one of the
epidemiological data, a reduction of 2 mm
factors that may be involved, the eicosanoid
Hg in systolic BP would be expected to
20 hydroxyeicosatetraenoic acid
reduce mortalities from stoke by 6%, CHD
(20HETE), which is known to be deficient
by 4%, and all causes by 3%.[9] To date,
in inbred, salt-sensitive strains of rats. We
there have only been two trials that have
demonstrated an effect of sodium balance
provided some evidence for such benefit.
in subjects with hypertension on the
The Treatment of Mild Hypertension Study
urinary excretion of 20-HETE, which
(TOMHS)[10] included 900 adults aged 45doubled from sodium-depleted to sodium70 years with diastolic BP <100 mm Hg. All
loaded states. While levels of 20-HETE did
received "nutritional-hygienic" advice to
not differ between salt-sensitive and saltreduce weight and intake of alcohol and
resistant subjects with hypertension, there
sodium (goal <70 mmol) and to increase
was a difference in the relationship between
physical activity. They were then randomized
20-HETE and natriuresis during sodium
to placebo or one of five antihypertensive
loading in these two groups.[12] In saltresistant subjects there is a direct
monotherapies and followed for 4 years.
relationship between 20-HETE and
UNaV, which is lacking in salt-sensitive
4
subjects. Conversely, in salt-sensitive subjects
there is a direct relationship between BP
and UNaV, which is not found in saltresistant subjects. It is as if a deficit in action
of 20-HETE in salt-sensitive subjects makes
their natriuresis pressure dependent.
Furthermore, this deficit was worsened by
obesity, which is associated with salt
sensitivity of BP.
Whatever the mechanism, most subjects
with hypertension are salt sensitive and
should restrict their sodium intake to reduce
BP and to possibly improve outcomes. Salt
sensitivity of BP is related to obesity, which
is also increasing in prevalence.
Recommendations to lose excess weight have
also been shown to improve control of
hypertension. Lower BP reduces
cardiovascular morbidity and mortality;
hence, the public health advice to restrict
sodium intake and avoid weight gain can be
applied to society as a whole.
References
1. Perry LJ, Beevers DG. Salt intake and stroke: a possible direct
effect. J Hum Hypertens. 1992;6:23-25.
2. He J, Ogden LG, Vupputuri S, et al. Dietary sodium intake
and subsequent risk of cardiovascular disease in overweight
adults. JAMA. 1999;282:2027-2034.
3. Stamler J, Cohen J, Cutler JA, et al. Sodium intake and mortality
from myocardial infarction: multiple risk factor intervention
trial (MRFIT). Can J Cardiol. 1997;17:272B.
4. Alderman MH, Madhavan S, Cohen H, et al. Low urinary
sodium is associated with greater risk of myocardial infarction
among treated hypertensive men. Hypertension.
1995;25:1144-1152.
5. Tuomilehto J, Jousilahti P, Rastenyte D, et al. Urinary sodium
excretion and cardiovascular mortality in Finland: a
prospective study. Lancet. 2001;357:848-851.
6. Stamler J, Rose G, Elliott P, et al. Findings of the international
cooperative INTERSALT study. Hypertension. 1991;17:I9I15.
7. Cutler JA, Follman D, Allender PS. Randomized trials of sodium
reduction: an overview. Am J Clin Nutr. 1997;65(suppl
2):643S-651S.
8. Sacks FM, Svetkey LP, Vollmer LM, et al. Effects on blood
pressure of reduced dietary sodium and the dietary
approaches to stop hypertension (DASH) diet. N Engl J Med.
2001;344:3-10.
9. National High Blood Pressure Education Program Working
Group Report on primary prevention of hypertension. Arch
Intern Med. 1993;153:186-208.
10. Neaton JD, Grimm RH, Prineas RJ, et al. Treatment of Mild
Hypertension Study. Final results. Treatment of Mild
Hypertension Study Research Group. JAMA.
1993;270:713-724.
11. Whelton PK, Appel LJ, Espeland MA, et al. Sodium reduction
and weight loss in the treatment of hypertension in older
persons: a randomized controlled trial of nonpharmacologic
interventions in the elderly (TONE). JAMA. 1998;279:839846.
12. Laffer CL, Laniado-Schwartzman M, Wang MH, et al.
Differential regulation of natriuresis by 20-hydroxyeicosatetraenoic acid in human salt-sensitive versus salt-resistant
hypertension. Circulation. 2003;107:574-578.
Interlude
Doctor: “Nurse, how is that little girl that
swallowed a five Pula coin.”
Nurse:
“No change yet.”
By Munyaradzi Mangwendeza
Chlamydia the “Silent Scourge”
C
hlamydia is a sexually transmitted
causing neonatal conjunctivitis, which in
disease (STD) caused by a tiny
some cases can lead to permanent damage
bacterium, which is known as Chlamydia
to the eyes and the child can also develop
trachomatis. It is known as the silent disease
pneumonia as a further complication.
As a preventive measure, latex condoms
because about 75% of the infected women
can be used and prior to stopping using them,
and half of the infected men have no
it is advisable to make sure that both you
symptoms. Most people who are at risk of
and your partner are not infected with
this infection do not really know what
Chlamydia or any other STD. If either of
Chlamydia is, yet it is the most common
you is infected make
treatable STD. It is most
sure to get treatment.
commonly transmitted
Repeated infection
through sexual interChlamydia mostly presents
can cause far worse
course and the likeliwith no symptoms in men
fertility problems, it is
hood of infection with
or women. The occasions
therefore advisable
the disease depends on
when it does result in
for expectant women
sexual behaviour. Chlasymptoms the
to get tested for the
mydia has too often
complications will be such
infection.
been publicised as a
that treatment will be too
To prevent the
problem affecting only
late to stop any permanent
serious consequences
women but it has been
damage.
of chlamydia appearalso shown to equally
ing, screening at least
affect men. However,
annually for chlamydia is recommended for
the infections are more likely to cause serious
all sexually active men and women below the
complications in younger women. If you are
age of 25 years.
less than 25 years old and sexually active you
There are several laboratory tests for
have a one in ten (1:10) chance of having
diagnosis of C. trachomatis but the sensitivity
chlamydia. The risk is higher for those people
of the tests will depend on the nature of the
under the age of 20 and having unprotected
disease, the site of specimen collection and
sex. Even though it is the most common STD,
the quality of the specimen. Since chlamydia
there is a substantial amount of under
are intracellular parasites, swabs of the
estimation of the statistics. This is because most
involved sites rather than exudate must be
of the individuals with Chlamydial infection
submitted for analysis. It is estimated that as
are unaware of their infections and therefore
many as 30% of the specimens submitted
do not seek any testing.
Chlamydia mostly presents with no
for analysis are inappropriate.
symptoms in men or women. The occasions
1. Cytology - Examination of stained
when it does result in symptoms the
cell scrapings for the presence of inclusion
complications will be such that treatment will
bodies has been used for diagnosis but
be too late to stop any permanent damage.
this method is not as sensitive as other
The symptoms that do occur include cystitis,
methods.
change in vaginal discharge and mild lower
2. Culture - Culture is the most specific
abdominal pain. In men it is the most
method for diagnosis of C.trachomatis
common cause of urethral discharge from
infections. Specimens are added to
the penis. Slight irritation at the end of the
cultures of susceptible cells and the
penis, which disappears after 2-3 days, is also
infected cells are examined for the
common. The discomfort can disappear but
presence of iodine- staining inclusion
infection will still persist and so the infection
bodies. Iodine stains glycogen in the
can still be transmitted to a sexual partner.
inclusion bodies.The presence of iodineMen can also experience inflamed testicles,
staining inclusion bodies is specific f o r
epididymitis with marked pain, swelling and
C. trachomatis since the inclusion bodies
redness of the scrotum. In women chlamydia
of the other species of chlamydia do not
damages the fallopian tubes leading to
contain glycogen and stain with iodine.
infertility, ectopic pregnancies and abdominal
3. Antigen detection - Direct immunopains. Women can also experience bleeding
fluorescence and ELISA kits that
after intercourse or bleeding between
detect the group specific LPS
or
menstrual periods. Infection with chlamydia
strain-specific outer membrane proteins
by a pregnant woman can result in early
are available for diagnosis. Neither is as
labour and delivery. The disease can also be
passed on to the baby during childbirth
goodas culture particularly with samples
containing few organisms (e.g. asymptomatic patients).
4. Serology - Serological tests for diagnosis
are of limited value in adults, since the
tests do not distinguish between current
and past infections. Detection of high
titer IgM antibodies is indicative of a
recent infection. Detection of IgM
antibodies in neonatal infection is
useful.
5. Nucleic acid probes - Three new tests
based on nucleic acid probes are
available. These tests are sensitive and
specific and may replace culture a s
the method of choice.
As a means of reducing chlamydial
infection rates there is a need for increased
school based sex-education programmes as
well as increased high profile public awareness
campaigns. Encouraging people to have
chlamydia tests will also help and so will
education of health practitioners as to the
consequences of chlamydial infection
especially obstetricians and gynaecologists.
If in doubt or not sure about your own
condition, ask for the test from your doctor.
Consider your situation and that of your
children. Talk about sex with your children.
It is time we accept that a high percentage of
children under 16 years are having sex and
are hence affected by most of these STDs.
Some do not use contraception when they
start having sex or they use condoms
inconsistently. With a high teenage pregnancy
rate, a high chlamydial infection rate is also
expected. The desire to have sex is
considerable and usually quite pleasurable.
It is unrealistic to expect adolescents to always
make sensible, rational decisions, but many
will if provided with the right information in
a way they can relate to or identify with.
Knowing the potential consequences of your
actions is one step on the way to weighing up
the risks and benefits.
Making an informed decision and
knowing where to go if you are concerned is
essential, and prompt action is advisable.
REFERENCES :
1: The NETDOCTOR, Women's Health
2: Center for Disease Control article on Sexually Transmitted
Diseases.
3: Dr. Gene Mayer.
Medical microbiology, MBIM 650/720. Murray et al. Medical
Microbiology, 3rd Edition, chapter 44.
5
By Rita Ngulube Gwaza
Key Factors Known to Affect Haemotology Test
Preanalytical variation
Factors that may influence test results include
phlebotomy, anticoagulant used, specimen
transport and storage of samples.
Phlebotomy
Difficulty in taking blood from the patient
may result in the sample clotting in the blood
tube. This can result in fully clotted samples
at one extreme to tiny fibrin 'clots' that can
be difficult for the laboratory to detect at the
other. Effect on Full Blood Count (FBC)reduced platelet count due to activation. All
parameters can be affected if the clot is
removed from the tube before sending to the
laboratory.
Effect on Coagulation tests - increased
results due to the reduction in available
fibrinogen / or decreased results due to
activation of the coagulation factors.
Effect on ESR - elevated resultsTaking
blood from a patient's drip arm can result in
a dilution of all tests results. Taking blood for
coagulation tests from a patient's heparin drip
arm will result in falsely elevated results.
Anticoagulant
EDTA can cause platelet clumping in
approximately 1% of patient samples. The
effect is variable and can be detected on
examination of the blood film. The problem
can be overcome by repeating the FBC and
taking both EDTA and Trisodium Citrate
tubes (platelets do not clump in citrate, but
this anticoagulant is unsuitable for routine
use as blood films are poor that are made
from this anticoagulant).
Incorrect sample volume to anticoagulant is another common problem.
Effect on FBC causes 'storage changes'
affecting the White Blood Cell count (reduces
count and gives a false neutropenia).
Effect on Coagulation tests - small
sample size will result in prolonged results
(increase in anticoagulation of the blood).
The laboratory may not always detect this.
Specimen Transport and Storage
If the specimens are subjected to excessive heat
when transported (left in the window of a car
in direct sunlight) then the laboratory will
reject the FBC, as the results will be bizarre.
Coagulation tests will be falsely elevated.
Storage of samples is not recommended
before testing.
6
Coagulation samples should be tested
within 6 hours of phlebotomy or results will
be increased.
ESR's should not be stored at 4 degrees
C as this will increase the result even more
than if they are left overnight at room
temperature.
FBC Should be kept at 4 degrees C
overnight if cannot be analysed on the same
day. Will still result in 'storage changes' as
above.
interpretative comments in relation to red
cell, white cell and platelet numbers.
Red Cells
Anisocytosis
i.e. Variation In size
? Anaemia responding to
treatment
? Post transfusion
Dimorphic
i.e. Two populations of cells
? Anaemia responding
to treatment
? Post transfusion
Poikilocytosis
Biological variation
Haemoglobin, Packed Cell Volume and Red
Blood Cell count fluctuations usually repeat
on a regular diurnal basis, the morning values
typically being the highest. Mean WBC
counts are usually highest in the afternoon.
Analytical variation
As modern fully automated analysers have
replaced manual test procedures, analytic
variation has become a relatively minor cause
of test variation compared with biological
variation. Generally, it is expected to
contribute half, or less than half as much, to
the total test variation as does biologic
variation.
Users are advised to regard the haematology results as a guide to the assessment
and management of an individual patient. It
is helpful to indicate appropriate clinical
details on the request form, e.g. 'on
chemotherapy', 'post-transfusion', '? Anaemic'
etc. Where results appear inconsistent with
the clinical condition, users are advised to
discuss this with the laboratory and if
necessary submit a repeat specimen. There
are no absolute thresholds for urgent action
in the light of laboratory results as the clinical
condition is in general of greater importance
than the laboratory data. Usually, however,
adult patients will be symptomatic with a
haemoglobin of <8 g/dL unless this anaemia
has developed extremely gradually to allow
for compensation. A further generalisation
is that patients will not develop spontaneous
bleeding unless the platelet count drops to
<50x109/L as an isolated phenomenon,
naturally a coagulation screen would provide
additional useful information in a bleeding
patient. In practice, persistent leucopenia is
not too uncommon and in the absence of
infectious symptoms, this finding should not
generate undue alarm
There follows a brief description of some
frequently used morphological terms and
i.e. Variation in shape
Teardrop cells may
suggest marrow fibrosis
Elliptocytosis
Consider iron deficiency
Spherocytes
Consider haemolysis
Target cells
Consider liver disease,
splenectomy,HbC,
thalass-aemia
Macrocytosis
Consider Liver disease
(+ alcohol), B12 +/- folate
deficiency HIV patients on
Zidovudine drug
Howell-Jolly
bodies
Lack of spleen, splenic
atrophy
Microcytosis
Consider Iron deficiency,
thalassaemia
Hypochromia
Consider iron deficiency,
thalassaemia
Polychromasia
Indicates reticulocytosis
e.g. in response to bleeding,
haemolysis, haematinics
White Cells
Neutrophilia
Consider bacterial infection,
inflammation, neoplasm,
steroid treatment. A normal
finding in pregnancy
Hypersegmented
Right shifted neutrophils.
Consider B12 +/- folate
deficiency
Consider bacterial infection,
myelodysplasia
Left shifted
Neutrophils
Neutropenia
Consider B12 +/- folate
deficiency. Normal variant
especially Afro-Caribbean.
Autoimmune disease. Drugs
(especially chemotherapy)
Lymphocytosis
Normal in children.
Consider viral infection &
TB. Chronic Lymphocytic
Leukaemia (smear cells
typically seen)
Eosinophilia
Consider parasitic infection,
Allergic disoders
Platelets
Reduced
Marrow failure, ITP, drugs
(often platelet anisocytosis
or giant platelets)
Increased
Response to bleeding,
inflammation, neoplasm,
infection. If persistent,
consider myeloproliferative
disease
Current Best Practice for Traceability in Testing Laboratories,
When certified reference materials are unavailable
T
he subject of Reference materials is very
complex especially since today's market
does not have sufficient answers for the use
of traceable reference materials in all areas
of testing. This situation poses a significant
problem especially for those aware of the
importance of the quality and
comparability of test results through
traceability to common references.
ISO/IEC 17025:1999 (1) section
5.6.3.1 requires that “ …..reference
standards shall be calibrated by a body that
can provide traceability….” All laboratories
need therefore, to request/find appropriate
reference materials (RMs) that meet the
requirements of the market and the
requirement for traceability to calibrate
their test systems.
The EURACHEM/CITAC Guide (2)
provides excellent guidance on identifying
traceability requirements; this short article
attempts to describe the possibilities to
comply with the traceability requirement of
ISO/IEC 17025 in testing laboratories
when certified reference materials are
unavailable.
Traceability
The international Vocabulary of Basic and
General terms in Metrology (VIM) (3),
defines traceability as the “property of the
result of a measurement or the value of a
standard whereby it can be related to stated
references, usually using national or
international standards, through an
unbroken chain of comparisons all having
stated uncertainties.”
In practice traceability to the
International System of Units (SI) is
obtained either through traceability to a
value of a compound or through traceable
calibrated equipment. When the above
routes of traceability are unavailable then
one is left with the traceability of the test
method.
Reference materials
The RMs used for calibration in the
industry and in all sections of analytical
laboratories are essential for the
comparability of chemical and biological
test results.
Currently the “best” available RMs are
the certified reference materials (CRMs).
CRMs are expensive, since their value has
been assigned after being tested in many
laboratories including metrology institutes
with different valid procedures. Each CRM
has the uncertainty calculated within a
defined confidence level for each assigned
value, which includes the uncertainties from
homogeneity and stability. This
information is available on the certificate
of calibrator and basis for traceability in
testing reports.
CRMs, however, can be used only where
they are available and are relevant to the
test being performed. For many of the
chemical, biological and physical tests, this
is not the case. It is therefore, necessary to
define which measures should be taken, in
order to work as traceable as possible.
The following “best working practice”
to ensure (as far as possible) traceability is
proposed, which includes the following:
1. Look for and use traceable RMs
whenever available, preferably primary
standards or CRMs.
2. Enquire whether the RM producer has
or intends to pursue accreditation to
ISO/IEC 17025 or ISO/IEC Guide
34 (4) since an RM from an accredited
producer would save the customer
valuable resources in confirming the
links for traceability.
3. Define the uncertainties of the results
and the variables in the test method
which may affect the quality of the
results. Concentrate in these variables
that they be traceable to SI units where
possible.
4. Work traceable to SI units:
a. Temperature (K): Calibrated
therm-ometers, temperature and
humidity meters.
b. Mass (Kg): Ensure the weights and
the balances are calibrated.
c. Volume (L): Use defined glassware
(Class A) calibrated pipettes,
volumetric flasks, etc.
d. Length (m): Where the length has
an effect on the result of the test
use calibrated measuring meters.
5. Work with a valid method.
6. Perform on-going QC monitoring in
the initial validation procedure and
then on regular basis (calibration
curve, vs response, control charts, etc.)
7. Perform intermediate verification
checks with master calibrated weights,
secondary thermometers, etc.
8. Prepare solutions in calibrated volume
vessels. Perform intermediate checks
with working solutions, which are
comparable to the RM or CRM.
9. Document and monitor historical
data collected for identification of
possible trends.
10. When preparing a working RM in the
lab:
a. Ensure that the equipment is
calibrated.
b. Monitor the stability and
homogeneity.
c. 3Document the procedure and the
test results.
11.When no CRM can be found:
a. Request that the producer of a
compound/RM used be ISO
9000certified.
b. Check whether the certificate of
analysis received with the compound
defines the type of the RM
(secondary, working or it may not
be stated).
c. Requestadditional information
from the supplier/producer
regarding stability, homogeneity,
traceability and uncertainty assigned
to the values stated in the certificate
of analysis.
d. Continuously document all
available information of the
standard/RM (collect on-going and
historical data).
When all else fails there is the possibility to
be traceable to the valid test method. If the
test method is used in the same manner with
the same materials in the same conditions
with sufficient controls, then the traceability
would be the method itself.
There are a few accreditation bodies
that have started accrediting the producers
of reference materials to ISO/IEC Guide
34, so there is some hope and positive
encouragement that in the next years to
come we may see an increase in the number
of accredited RM producers that may
provide subjective evidence of traceability
and lessen the burden on the
laboratories.
References
1. ISO/IEC 17025:1999. General requirements for the
competence of testing and calibration laboratories. The
International Organization for Standardization (ISO), Geneva.
2. Eurachem/CITAC Guide (2003) Traceability in chemical
measurements, a guide to achieving comparable results in
chemical measurements. Eurachem. Http://
www.eurachem.ul.pt/
3. International vocabulary of basic and general terms in
Metrology (1993). ISO, Geneva.
4. ISO/IEC Guide 34. General requirements for the competence
of reference materials producers. ISO, Geneva.
7
By Kiran Bhagat
Is Highly Sensitive (HS)CRP an Effective Screening Test?
H
ighly sensitive C-reactive protein
(hsCRP), the acute-phase reactant
that is a marker of infectious and
noninfectious inflammation, has emerged as
a potential risk factor for future cardiac
events. Even moderate elevations in CRP
typically present in apparently healthy
individuals are also postulated to be strong
predictors of future cardiovascular events.
The relationship between increased
cardiovascular risk and CRP is based on the
premise that inflammation correlates to the
presence of atherosclerosis. Research has
established that lowering inflammation
markers helps to reduce heart-related
conditions; however, the exact relationship
between inflammation, atherosclerosis, and
heart disease still needs further examination.
Known to rise rapidly after an inflammatory stimulus and possessing a half-life of
19 hours, CRP levels can be detected and
measured by a simple blood test. CRP is not
significantly metabolized, and its clearance is
not influenced by any known processes.
Therefore, its concentration is dependent only
on its rates of production and excretion.
Inflammation as a basis for
atherosclerosis
There is a preponderance of research that
has illustrated a very strong correlation
between CRP and cardiovascular disease,
especially when viewed concurrently with other
known risk factors (ie, smoking, obesity, low
HDL cholesterol, high blood pressure, and
decreased physical activity). Physicians and
researchers have affirmed the important role
of CRP in heart disease, contending that half
of all cardiovascular events have occurred in
people with normal cholesterol levels.
Cholesterol has been widely accepted as a clear
indicator of high-risk for future cardiac
events. In the group not "classically" viewed as
high-risk candidates, other deleterious
pathways have been hypothesized to take
place, and inflammation has shown the
greatest promise as the missing link.
Atherosclerosis is thought to be a chronic
inflammatory disorder resulting from a
combination of processes, and acute
exacerbation of this inflammation is also
associated with acute coronary syndromes
(ACS). This associated link is attributable to
the fact that the major inducers of CRP are
antigenic in nature. As part of the "innate
8
defense," CRP binds to monocytes,
macrophages, and neutrophils and activates
the complement system cascade (proteinmediated immune response) that leads to
the opsonization of "foreign" molecules. If
this occurs on the endothelial tissue of arteries,
fatty deposits will remain with the
macrophages in the intima (fatty streaks) of
these vessels and subsequently begin the
process of atherosclerosis.
The evolution to advanced atherosclerotic Lesions is dependent on concomitant
hemodynamic forces such as hypertension
and plasma levels of atherogenic lipoproteins
(high LDL cholesterol, especially oxidized
LDL, or low HDL cholesterol). Progression
to the next atherosclerotic stage is marked by
the formation of fibrous plaques, and if left
untreated, will progress to the final and most
harmful stage of atherosclerosis. Calcified
plaques that may be necrotic and contain
thrombi are the hallmark of complicated
lesions, which occur in the final stage of
atherosclerosis. The calcified plaque may
participate in heart disease by either
narrowing the lumen of the vessel directly or
by rupturing and creating massive local
inflammation and clotting.
Researchers are now finding that many
people who have heart attacks do not
necessarily have arteries severely narrowed by
plaque. In fact, "vulnerable plaque" may be
buried inside the artery wall and may not
always bulge out and block blood flow.
Inflammation leads to the development of
soft or vulnerable plaque, which can
predispose the thin covering over the plaque
to crack and bleed, spilling the contents of
the artery into the bloodstream. The sticky
cytokines on the artery wall capture blood
cells, mostly platelets that rush to the site of
injury. When these cells clump together, they
form a clot large enough to block the artery.
Despite this kind of inflammatory activity, a
patient may appear asymptomatic.
Correlation Between Coronary
Calcification and CRP
As suggested by researchers from the
Framingham Heart Study (FHS), a good
way to measure inflammatory activity in the
body is to monitor CRP levels. Determining
the level of coronary calcium, a measure of
subclinical atherosclerosis, in conjunction
with CRP levels can also indicate the increased
risk of future cardiovascular events.
Such conclusions were based on a
random sample of 321 patients from FHS
who underwent blood tests to measure CRP
and, after stratification by CRP level,
subsequently underwent electron-beam
computed tomography (EBCT) to detect the
presence of subclinical coronary
atherosclerosis, as measured by a coronary
artery calcification (CAC) score. Researchers
found, after adjusting for other risk factors,
that there was a direct correlation between
elevated levels of CRP and higher CAC scores
(P < .01) in both men and women. There was
also a correlation between higher levels of
CRP and increased body mass index;
however, the results were significant only in
women (P = .09), but not in men (P < .05).
A second study, recently published in the
journal Circulation, confirmed the predictive
roles of coronary calcium and CRP levels;
however, they were noted to be independent
of one another. Researchers from HarborUCLA Research and Education Institute (Los
Angeles, California) conducted Cox
regression analysis in 967 asymptomatic,
nondiabetic patients with known
intermediate risk factors to determine whether
the risk-factor-adjusted relative risks of CAC
and CRP influenced the incidence of
nonfatal myocardial infarction (MI) or
coronary-disease-related death; or any
cardiovascular event, including coronary
revascularization or stroke. Over the course
of 77-month follow-up, there were 50 MIs or
coronary deaths and 104 cardiovascular
events. CAC was noted as a predictor (P <
.005) for both endpoints, and CRP was
found to be a predictor of any cardiovascular
event (P = .03). On the basis of these findings,
the investigators concluded that risk
stratification based on hsCRP and CAC may
benefit patients because both factors are
independently associated with an increase in
cardiovascular events.
Both the FHS and Harbor-UCLA
studies conclude that measuring CRP during
a routine cardiac workup could reveal any
inflammatory processes that are under way,
especially if a patient has a concurrent history
of low HDL cholesterol, high blood pressure,
diabetes, and/or obesity.
CRP and LDL: Need for Change?
Over the course of the past year, several studies
have emerged that confirm earlier studies
showing a link between elevated levels of CRP
and risk of heart disease among women. The
most recent data to emerge challenge the
current guidelines, which pinpoint LDL
By Titus Maswabi; Principal Standards Officer BOBs
cholesterol levels as the basis for determining
risk of cardiovascular events. Researchers
conducted a head-to-head comparison of
CRP versus LDL cholesterol levels to
determine which measure had greater value
in terms of predicting cardiovascular events,
and CRP won out. Using data collected from
27,939 women who were followed for 8 years
as part of the Women's Health Study,
researchers compared the relative risks
associated with varying levels of CRP to the
relative risks associated with varying LDL levels.
They found a linear relationship, whereby
higher levels of each measure correlated to a
higher degree of risk. Overall, the degree of
risk was higher for all levels of CRP compared
with the varying levels of LDL.
A separate analysis concludes that the
same measures can be utilized to screen women
regardless of whether they are on HRT.
Although risk is slightly lower among HRT
users, researchers found similar incremental
risks associated with nonusers of the therapy.
A survival analysis was also conducted
that stratified participants based on high or
low levels of CRP and LDL, respectively. As
expected, those with high levels of CRP and
high levels of LDL were at high risk, and those
with low levels of each were at lower risk. Of
particular interest, however, was the fact that
those with high levels of CRP and low levels
of LDL were at a significantly higher risk than
those with high levels of LDL and low levels of
CRP. Researchers are quick to point out that,
unfortunately, it is the latter group that would
be targeted the most for "aggressive
prevention."
Coupled with the fact that 77% of the
first cardiovascular events over the course of
follow-up occurred in women with LDL levels
< 160 mg/dL and 46% of events occurred in
those with LDL levels < 130 mg/dL, this
finding indicates that the current practice
guidelines from the National Cholesterol
Education Program warrant some change
with regard to "threshold values for
intervention and treatment." Because there
was only a minimal correlation between the
2 factors, it is believed that each marker acts
upon different pathways, thereby identifying
a unique high-risk group. Screening for both
of these markers subsequently strengthens risk
assessment. The addition of these further
measures will help to strengthen clinical
outcomes by identifying the best candidates
for therapy. The authors strongly believe that
a large-scale trial evaluating statin therapy in
individuals with low levels of LDL and high
levels of CRP is needed.
Statins and CRP
A recent study found that statins not only act
on cholesterol levels, but they also significantly
reduce hsCRP levels. In the crossover, doubleblind trial, 40 men and women with elevated
LDL cholesterol were randomly assigned to
1 of 2 groups; the first group received
simvastatin (40 mg) for 14 days followed by a
placebo for 14 days; and the second group
received placebo first, followed by the 2-week
regimen of the drug. The mean LDL level in
both groups decreased by 56 +/-4 mg/dL (P
< .0001) in the first week and by an additional
8 +/- 3 mg/dL (P = .02) by day 14. In addition,
at 2 weeks, CRP levels were significantly lower
when compared with placebo (P = .011).
However, no correlation was noted between
decreasing LDL levels and the decrease in
hsCRP. These results led investigators to
conclude that statins work through multiple,
independent mechanisms to help protect the
body from heart disease, and that, regardless
of their effect on lowering LDL cholesterol,
the drugs protect against first and recurrent
heart attacks by lowering hsCRP levels.
CRP and Menopause
It has been suggested that postmenopausal
women are at increased risk for heart disease
because of the significant drop in estrogen
levels. Up until the recent release of the results
from Heart and Estrogen/progestin
Replacement Study (HERS II) and the
Women's Health Initiative (WHI), which
proved otherwise, hormone replacement
therapy (HRT) was prescribed to women
under the premise that restoring estrogen
levels would serve as primary prevention
against the risk of heart disease. However,
long-term use of HRT has been associated
with increased levels of CRP. Using data
obtained in the WHI involving 75,343
women with no history of heart disease or
cancer, researchers sought to determine the
correlation between HRT use, CRP, and IL6 and their effects on the incidence of
cardiovascular events. The analysis, published
in JAMA, compared 304 postmenopausal
women who experienced a coronary event to
a well-matched group of 304 women who
remained incident free.
Interestingly, researchers found that
women who had experienced a cardiac event
had higher levels of IL-6 and CRP at baseline
compared with controls, and that the
variables were independently associated with
a 2-fold increase in cardiac risk, regardless of
whether women were treated with HRT. This
led investigators to conclude that HRT use
did not contribute to cardiovascular risk.
The findings from the aforementioned
study concur with those from an earlier study,
in which Ridker and colleagues studied various
inflammatory markers as the possible culprits
for increased risk for the 122 women who
experienced cardiac events during the course
of 3-year follow-up of the Women's Health
Study. Compared with 244 well-matched
individuals who did not experience an event,
the 122 women who went on to develop
cardiac events had significantly higher levels
of CRP at baseline (P = .0001). In addition,
those with higher levels of CRP at baseline
were 5 times more likely to suffer any vascular
event and had a 7-fold increase in risk of MI
or stroke (P = .0001).
Lowering CRP Through Increased
Physical Activity
The link between improved cardiovascular
health and physical activity may, in part, be
due to the fact that exercise decreases CRP
levels and subsequently reduces the risk for
heart disease. Researchers from LDS Hospital
(Salt Lake City, Utah) studied 135 women
from 3 ethnic groups (African-American, n
= 44; Native American, n = 45, Caucasian, n
= 46) who were part of the Cross-Cultural
Activity Participation Study (CAPS) to
determine whether increased physical fitness
also translated into lower CRP levels. Women
were chosen from the CAPS study because
each participant in the study underwent a
treadmill test to determine exercise threshold.
Researchers used these data to determine
baseline physical fitness and stratified each
ethnic group according to level of fitness (low,
moderate, or high). CRP levels were measured
by testing frozen blood samples originally
obtained during the CAPS study. Overall,
women with low fitness levels had significantly
higher CRP levels than those in the moderateor high-fitness categories. Likewise, women
with the highest levels of BMI and/or the
largest waist size also had significantly higher
levels of CRP. Both Caucasian and NativeAmerican women who were physically fit had
lower levels of CRP compared with those who
were less fit; however, this correlation was not
observed in African-American women.
CRP and Cancer?
Again using data from the ongoing Women's
Health Study, Rifai and colleagues performed
an analysis to evaluate whether, in addition
to heart disease, high CRP levels also predicted
an increased risk for cancer. Over the course
of a 58-month follow-up, half of the 1286
women studied developed cancer or heart
continued on page 15
9
By Desire B. Mhlabi
Diagnostic Allergy Testing
T
he modern era of diagnostic allergy
testing dates back to 1967 when two
laboratories reported the discovery of an
immunoglobulin (now called IgE) that was
shown to be responsible for the skin
sensitizing activity of serum from patients
with allergic disease.
It is well known that allergic disease
occurs in genetically predisposed individuals
and that the allergic sequence begins in
infancy with cutaneous manifestations
(atopic eczema) and gastrointestinal signs
and symptoms that progress with age to
involve the respiratory tract (rhinitis and
asthma). In infants and children less than
three years of age the offending allergens
are mostly the common foods, particularly
proteins of egg white (albumin), cow's milk,
wheat and soya.
Detection of IgE antibodies to these
allergens is useful clinically to establish the
presumptive etiology of disease and as an
indicator of the risk of sensitization to
additional allergens later in childhood.
Clinical studies have shown that
sensitization to egg proteins prior to the age
of three is associated with a significantly
increased risk of developing inhalant allergies
later in life.
Routine testing for IgE antibodies to
most inhalant allergens is not as useful prior
to the age of three. Exceptions to this
statement are children with recurrent
wheezing who may already be sensitized to
house dust mites (Dermatophagoides
farinae and D pterynisinus) or other
inhalants.
A manifestation of allergic disease in
children older than the age of three typically
includes respiratory signs and symptoms
such as rhinitis, wheezing and persistent
cough. These signs of respiratory allergy are
compatible with allergic rhinitis, asthma or
a combination of the two. Sensitization to
inhalant allergens is progressive with age in
atopic children and typically proceeds from
perennial to seasonal allergens.
After the age of three, sensitization to
non-seasonal inhalant allergens is
increasingly common with development of
antibodies to cat and dog epithelia, house
dust mites and ubiquitous moulds such as
Alternaria tenuis. Later in childhood it is
common to encounter IgE antibodies to
seasonal inhalants, especially pollen allergens
10
of trees, grasses and weeds. These antibodies
are often responsible for seasonal
exacerbations of rhinitis in children with
predominant upper respiratory disease.
With other individuals, allergy disease is
never diagnosed until adulthood and the
laboratory together with clinicians play a
major role in this respect.
Laboratory Diagnosis of Allergies.
A thorough clinical history is the cornerstone of a confident and reliable allergy
diagnosis. Total IgE, skin prick tests,
Phadiatop (inhalants), food mix and other
individual tests are available for allergy
diagnosis. Other allergy tests available
include drug allergy (e.g. penicillin) and
allergy to bee venom.
Total IgE
This has been widely used as a benchmark
indicator for allergy, but it has several
clinical limitations in that its reference range
is age dependant and has been established
to be applicable mainly to the Caucasian
community. The high incidence of parasitic
infections in Sub-Saharan Africa
particularly Ascaris limits the application
of total IgE as a test for allergies.
Despite these demerits, total IgE assay
remains an important tiebreaker where
other allergy tests are discrepant e.g. a
positive Phadiatop and a negative skin prick
test.
Phadiatop
The name Phadiatop is derived from
Pharmacia differential atopy test and
measures the presence in serum of allergen
specific IgE to a wide range of common
inhalant allergens. The most important
inhalant allergens are all included in the
range of this test including house dust mites,
cat, dog, horse, cockroach, various grass
pollen, weed pollen, and mould spores.
He Phadiatop results are not affected
by age, race, parasites, medication, or
symptoms. A positive Phadiatop result is
then followed up in the laboratory by a
panel of specific IgE tests to the locally
relevant individual allergens. This will
almost always lead to the identification of
the individual causative allergen(s).
therefore similar to the Phadiotop assay in
concept. An allergy to food is described as
an adverse reaction by a patient to a
particular food that involves the IgE
mechanism. All adverse reactions to a food
are called “Hypersensitivity” and involve
other (non-IgE mediated) mechanisms, e.g.
food itself can contain histamine (as found
in tuna fish, cheese and red wine), and food
may directly cause the release of histamine
by the patient's body into the blood stream
e.g. Strawberries. Food may also contain a
toxin (e.g. mushroom), which as a result
cause adverse reactions but not allergies.
Avoidance of the causative allergen(s) is
the optimal therapy for food allergy and so
it is essential to accurately and reliably
identify the individual causation of the food
allergy. The multi allergen screening test
covers the six most common allergic foods
in baby or infant diets i.e. egg white, cow's
milk, fish, peanut, soya and wheat.
For older children and adults, as
the diet is expansive to include a wider range
of foods, other potential allergens are
encountered, these should be considered by
the doctor in relation to clinical
presentation and history. Several other
specific IgE food-screening tests are available
and the most clinically important are IgE
(nuts), IgE (sea foods mix) and IgE (cereals
mix).
Conclusion
Allergic reactions are a growing concern to
modern world medicine thus proper and
timely treatment is paramount to effective
inter ventions and proper patient
management.
As discussed above, there is a wide
range of both inhalant and food allergens
and it is therefore vital for the clinician to
make a careful choice of the allergens to be
tested for based on thorough clinical history
and presentation.
Interlude
ANAGRAMS
BIIYUTQU
AAIIMNXP
YMOOZERT
Specific IgE Paediatric Food Mix
This is the screening test to identify a patient
allergic to a limited range of food and is
YYTGOISZ
By Baboloki Peter Joseph & Gilbert Gonnetsweng
A Student's Perspective
Our Experience During The
3 Months Practical Attachment At Diagnofirm Medical
Laboratory (dml)
T
o have been attached at DML is a
lifetime experience. During our tenure
at the lab we were exposed to the world of
high tech machines & the latest diagnostic
methods. It's amazing, because we never
anticipated such kinds of machines to in
use anywhere but in developed countries.
On arrival at DML we toured around
the lab and saw a fascinating environ-ment.
DML has 4 core departments, which are;
MICROBIOLOGY, HAEMATOLOGY,
VIROLOGY and CHEMISTRY (which
comprises Serology and Biochem-istry). We
were each assigned to a depart-ment. From
then on we did a 2-week rota-tion in all
departments.
The MICROBIOLOGY department is
the least automated of all the departments.
Most of the work is done manually as it
involves the culturing of clinical samples that
are provided by the patients. A sample is
received from the phlebotomy department
and is cultured and incubated and the
results of the culture interpreted the
following day or as soon as possible. We
have learnt and acquired knowledge, skills
on reception &processing of specimens.
Furthermore we did sensitivity tests using
different antibiotics discs. During these 2
weeks in Microbiology we came to realise
that the specimen that are most frequently
analysed are URINE & SWABS. In most
cases we had to isolate yeast cells showing
infection by CANDIDA organism causing
the disease CANDI-DAISIS. The organism
was mostly isolated from high vaginal swab
(HVS) specimen.
Unlike the other departments, which
are completely automated, the DML
Microbiology department has one machine
called the Bact-Alert, which is blood culture
machine. It alerts the operator when there
is a blood culture bottle showing any
indication of BACTERIAL GROWTH.
The machines principle is based on the
production of CO2 during bacterial growth
thus bringing about PH &COLOR changes
in the bottle indicator.
The Haematology (blood cell-study)
dept is equipped with a full blood count
machine (Sysmex), which analyses the
blood parameters like WBCS, RBCS,
platelets & morphology. This is the most
requested test in this department. The
department also houses the ALIFAX Test
1 machine. This machine measures the
erythrocyte sedimentation rate, which is a
non-specific test used normally to show the
presence of infection in a patient. The ESR
is however elevated in TB infection, thus
making it a reliable marker for this
infection.
The department also incorporates the
Coagulation department. This area covers
the clotting abilities of blood. The tests
done here are the Prothrombin Time (PT)
and the Activated Partial Thromboplastin
Time (APTT), which are the screening tests
for coagulation disorders.
The machines provide quick &reliable
results, which is most advantageous to
patients & techs.
The most fascinating department in
our opinion was the VIROLOGY
department. This department deals with
the tests used for HIV monitoring, which
are; the viral load test and the T-cell subsets
test (commonly referred to as the CD4
count). This department is housed in its
own premises. Its lab is divided into 2
sections, the one for performing the viral
loads and the other for the T-cell count.
The machine used to for the T-cell subsets
is the EPICS flow cytometer. The machine
enumerates the CD3, CD4 and CD8 cells,
which are T-cells actively involved in the
body's immune response to viral infection.
The viral load test involves the viral
isolation and then amplification and
quantification by PCR. The isolation is a
manual process, whilst the sophisticated
NucliSens Easy-Q analyzer performs the
PCR process. Normally when the CD4 cell
count is low, the VIRAL LOAD is high.
DML has implemented safety precautions
to ensure quality results & service to
patients.
The chemistry department is ever busy
and is a highly equipped department. It
has the COBAS 4OO PLUS machine
which analyses for urea and electrolytes,
liver function analytes, cardiac enzymes,
blood glucose, HBA1c (long term glucose
detection) and some other enzymes.
Another heart test that is performed is the
Pro BNP. It is analysed using the Elecys
1010. This heart marker is very innovative
as its increase is an early signal for heart
disease. The other machine found in this
department is the AXSYM. It is a very versatile
machine, but at DML it is used mainly for
Endocrinology (hormone) studies and HIV
testing.
These tests include the Thyroid function
tests and sexual development hormone
assays. It was interesting learning on how to
operate & maintain these machines. In
serology we performed Pregnancy,
Rheumatiod factor and C-reactive protein
tests.
QUALITY CONTROL is done in all
the departments (both internal and external
QC) before any tests are run so as to ensure
quality result output. Without such controls
nothing can be done. Regular service &
maintenance to the machines is done weekly
and monthly so as to keep them on good
conditions.
The DML staff comprises of techs,
nurses, receptionists, a cleaner and drivers,
making it a big laboratory. Among all these,
coordination, peace, love, harmony,
cooperation prevails. There are of one
accord, one goal &one vision. This is even
proved by their punctuality at work, quick
& quality results, friendship & loyalty.
In summary we really appreciate the
relationship, friendship, knowledge we
acquired from the staff members as a whole.
DML has equipped us with lifetime
opportunity in the world of laboratory
medicine. We learnt on how to work with
other people harmoniously.
The management coordinates with
enthusiasm & harmony. With this regards
with no doubt, we can recommend any
technician of quality &patients to DML for
services. Hopefully DML will grow to be the
best lab in the country (Botswana) as a
whole.
Wish the best.
Medical Laboratory Technology Students
Institute Of Health Sciences Gaborone
Interlude
DECODE
— — — — — — — — — — — —
O Z Y L I Z G L I R V H
— — — — — — — — — — —
N T I C D O S I A G S
11
By Silas Nunu
Patients' Corner
This column of our newsletter
is dedicated to giving an
overview or generally to demystify the laboratory science.
It is prompted primarily by the
questions thatwe as Technologists are asked by patients on
reception of results and also by
anyone enquiring ordinary
person asking what laboratory
sciences are all about.
In this the first article in the
series, we aim to cover the
tests that are most often
requested by clinicians, such as
FBC, U/E's and urinalysis. In
later editions we will cover
other common conditions and
explain why certain tests are
requested in those circumstances.
Full blood count
The full blood count (FBC) is one of the
most commonly ordered tests and provides
information as to the types and the numbers
of cells in the blood: red blood cells (RBC),
white blood cells (WBC) and platelets.
The FBC is used as a screening test to
diagnose and manage numerous diseases. The
results can reflect problems with fluid volume
(such as dehydration) or loss of blood. It can
show abnormalities in the production, life
span, and rate of destruction of blood cells.
It can reflect the presence of infection, allergies
and problems with clotting.
Variations in these cells are present
according to sex and age. Variations can also
appear as a result of differences in body build,
occupation and diet, but these variations are
taken account for in the normal range. Any
Abnormalities outside of the normal range
can indicate the presence of a medical
disorder. A lack of any abnormality in the
FBC on the other hand does not necessarily
rule out presence of any disorder.
How is it used?
The CBC is used as a broad screening test to
check for such disorders as anemia (decrease
in red blood cells or hemoglobin), infection,
and many other diseases. It is actually a panel
of tests that examine different parts of the
blood. Results from the following tests
provide the broadest picture of your health:
12
WBCs are primarily used in the body to
fight infection. If an infection develops, white
blood cells attack and destroy the offending
organism causing the infection.
White blood cell (WBC) count is n
estimation of the actual number of white
blood cells per volume of blood. Both
increases and decreases can be significant.
Low numbers of WBCs (leukopenia) may
indicate:
Bone marrow failure (for example, due
to infection, tumor or fibrosis)
Presence of cytotoxic substance
(poisonous material)
Autoimmune/collagen-vascular diseases
(such as lupus erythematosus)
Disease of the liver or spleen
Radiation exposure
High numbers of WBCs (leukocytosis) may
indicate:
Infectious diseases
Inflammatory disease (such as rheumatoid arthritis or allergy)
Leukemia
Severe emotional or physical stress
Tissue damage (such as seen in burn
victims)
White blood cell differential count looks
at the types of white blood cells present.
There are five different types of white
blood cells, each with its own function in
protecting us from infection. The
differential classifies a person's white
blood cells into each type: Neutrophils
(also known as segs, PMNs, grans),
lymphocytes, monocytes, eosinophils,
and basophils.
Red blood cell (RBC) count is a count
of the actual number of red blood cells
per volume of blood. Both increases and
decreases can point to abnormal
conditions. Dependin on the laboratory's report forms, red blood cells
are reported as millions in a microliter
of blood (4,250,000/µL or 4.25x10⁶/
µL) or as millions in a liter of blood
(4.25x10¹²/L).
Haemoglobin measures the amount
of oxygen-carrying protein in the
blood
Haematorit measures the amount of
space red blood cells take up in the
blood. It is reported as a percentage.
The platelet count is the number of
platelets in a given volume of blood. Both
increases and decreases can point to
abnormal conditions of excess bleeding
or clotting. Mean platelet volume (MPV)
is a machine calculated measurement of
the average size of your platelets. New
latelets are larger, and an increased
MPV occurs when increased numbers of
platelets are being produced. MPV gives
your doctor information about plateleto
production in your bone marrow.
Mean corpuscular volume (MCV) is
a measurement of the average size of
your red blood cells (RBC). The MCV is
elevated when your RBCs are larger than
normal (macrocytic), for example in
anemia caused by vitamin B12 deficiency.
When the MCV is decreased, your RBCs
are smaller than normal (microcytic),
such as is seen in iron deficiency anaemia.
Mean corpuscular hemoglobin (MCH)
is a calculation of the amount of oxygencarrying hemoglobin inside your RBCs.
Since macrocytic RBCs arelarger than
either normal or microcytic
RBCs, they would also tend to have
higher MCH values.
Mean corpuscular hemoglobin concentration (MCHC) is a calculation of the
percentage of hemoglobin in the RBCs.
Decreased values point to hypochromasia, decreased oxygen- carrying capacity
because of decreased hemoglobin inside
the cell. Hypoch-romasia is seen in iron
deficiency anemia and in thalassemia.
Red cell distribution width (RDW) is
a calculation of the variation in the size
of your RBCs. In some anemias, such as
pernicious anemia, the amount o f
variation (anisocytosis) in RBC size
(along with variation in shape
poikilocytosis) may help your doctor
evaluate the severity of your condition.
Liver Profile
A liver profile, also known as liver (hepatic)
function tests or LFT, is used to evaluate liver
function and any damages that may exist and
also to help monitor response to treatment..
It usually includes a panel of tests that are
run at the same time on a blood sample. These
include:
Lactate dehydrogenase (LDH) - This is a
tissue enzyme, which in the relation to the
liver is commonly elevated in diseases such
as hepatitis (inflammation of the liver). It
can also be elevated drugs such as aspirin
and anaesthetics.
Gamma glutamyl transferase (GGT) GGT is an enzyme found mainly in the
liver; it is very sensitive to changes in liver
function an elevated GGT with an
elevated ALP would strengthen the
diagnosis of liver or bile-duct disease.
The GGT has also been used as an
indicator of heavy and chronic alcohol
use, where it commonly is very much
elevated. Drugs such as oral
contraceptives will lower the blood levels
of GGT.
Alanine aminotranferase (ALT) - the best
test for detecting hepatitis. When the liver
is injured or inflamed, the levels of ALT
in blood usually rise; therefore, this test is
done to check for signs of liver disease.
Alkaline phospatase an enzyme related
to the bile ducts; often increased with
diseases associated with injury toblocked
bile ducts
Aspartate aminotransferase an enzyme
found in the liver and a few other places,
particularly the heart and other muscles
in the body. In relation to the liver, when
it'sdamaged, AST is released
into
the blood stream, hence resulting in it
being elevated.
Bilirubin Exists as either total or direct
bilirubin. Total bilirubin measures all
the bilirubin in the blood; direct bilirubin
measures a form made in the liver. Drugs
such as antimalarials, antibiotics, anabolic
steroids and oral contraceptives may
increase the blood levels of this liver
test.
Albumin measures the main protein
made by the liver. In some diseases the
liver's capacity for albumin production is
reduced resulting also in a low total
protein.
Total protein - measures albumin and all
other proteins in blood, including
antibodies made to help fight off
infections. Proteins take a long time to be
degraded hence when their production
is lowered it takes some time for it to be
reflected in the blood.
Definition
Liver function tests, or LFTs, include tests for
bilirubin, a breakdown product of
hemoglobin, and ammonia, a protein
byproduct that is normally converted into
urea by the liver before being excreted by the
kidneys. LFTs also commonly include tests to
measure levels of several enzymes, which are
special proteins that help the body break
down and use (metabolize) other substances.
Enzymes that are often measured in LFTs
include gamma-glutamyl transferase (GGT);
alanine aminotransferase (ALT or SGPT);
aspartate aminotransferase (AST or SGOT);
and alkaline phosphatase (ALP). LFTs also
may include prothrombin time (PT), a
measure of how long it takes for the blood
to clot.
Urinalysis
Why get tested?
This may be done as a general screening
to check for early signs of disease. It may also
be used to monitor diabetes or to screen for
metabolic and kidney disorders. It may be
used to check for a urinary tract infection or
blood in urine.
Other than this a urinalysis is regularly
requested by clinicians on admission to a
hospital; in a work-up for a planned surgery;
as part of an annual physical exam; or when
evaluating a new pregnancy. May be done if
you have abdominal pain, back pain,
frequent or painful urination, or blood in
the urine.
What is being tested?
Urine is one of the body's waste products. It
is produced in the kidneys and collected in
the bladder until a person urinates. Disease
of other body organs may result in abnormal
waste products appearing in the urine. These
abnormal waste products will then give the
clinician an overview of the patient's health
status. Normally, the urine does not contain
significant numbers of any micro-organism.
However, if bacteria or yeasts are introduced
into the urinary tract, they can multiply and
cause a urinary tract infection (UTI) and
when a urine is cultured these microorganisms will grow.
Most UTIs are caused by Escherichia coli
(E. coli), one of the most common human
bacteria. Other frequently identified bacteria
are Proteus, Klebsiella, and Staphylococcus
saprophyticus.
Performance of the test
Urinalysis comprises a battery of chemical
and microscopic tests that help to screen for
UTIs, renal or any other disease that may
result in abnormal waste products. Culture
is done if the chemical and microscopic tests
indicate for it or if specifically requested for
by the doctor.
The chemical analysis involves the
following tests: Urine appearance and color (for
example, clear, cloudy, turbid, layered;
pale yellow, dark yellow, red, green, blue).
Besides disease, any unusual urine
coloration or smell can be as a result of
medication or food intake.
Bilirubin (a degradation product of
blood)
Glucose (sugar) as a result of diseases such
as diabetes
Hemoglobin an indication of blood
breakdown (haemolysis)
Ketones (a by-product of fat breakdown
and present in starvation and
uncontrolled diabetes)
Nitrite (an indication of urinary tract
infection)
Urine pH (the acidity or alkalinity of the
urine)
Urine protein normally found in cases of
kidney disease
Urine specific gravity (shows how
concentrated or dilute the urine is) The
microscopic examination consists of the
analysis of urine for the following:
Bacteria and other microorganisms (not
normally present) when seen can
signify urinary tract infection
Crystals
Red blood cells (an indication of damage
to the tubules except in women
where they could be residual menstural
flow cells.)
Epithelial cells which in cases of
inflammation to the urinary tract will
increase in number in urine
White blood cells (their presence and
quantity can be an indication of urinary
tract infection and its extent)
Culture
Urine culture may be ordered when
symptoms indicate the possibility of aurinary
tract infection, such as pain and burning
when urinating and frequent urge to urinate.
In addition, it may be ordered for patients
who have a catheter inserted for an extended
period of time, even if they do not show overt
symptoms of an infection, since there is a risk
of bacteria being introduced via the catheter.
Pregnant women without any symptoms may
be screened for bacteria in their urine, which
could harm the baby.
A negative culture (i.e. no bacterial
growth) usually means there is no
infection. However, a culture may be
repeated in 1-2 days if the symptoms
persist.
The presence of bacteria, as indicated by
a positive culture, indicates an
infection. Any bacterial infection may
be serious and can spread to other areas
of the body if not treated. Since pain is
often the first indicator of an infection,
prompt treatment, usually with
antibiotics, will help to alleviate the
pain.
In our forthcoming edition we will be focusing on HIV monitoring
tests, urea & electrolytes and coagulation studies.
13
Jokes Corner
Actual Medical Chart Notes
☺ Patient has two teenage children, but
no other abnormalities.
☺ Patient has chest pain if she lies on her
left side for over a year.
☺ On the second day, the knee was better,
and then on the third day it
disappeared.
☺ The patient is tearful and crying
constantly. She also appears to be
depressed.
☺ The patient has been depressed since
she began seeing me in 1993
☺ Discharge status: Alive, but without my
permission.
☺ Healthy-appearing decrepit 69 year
old male, mentally alert but forgetful.
☺ The patient refused autopsy.
☺ The patient has no previous history of
suicides.
☺ Patient has left white blood cells at
another hospital.
☺ Patient’s medical history has been
remarkably insignificant with only a
40-pound weight gain in the last three
days.
☺ Patient had waffles for breakfast and
anorexia for lunch.
☺ Between you and me, we ought to be
able to get this lay pregnant.
☺ She is numb from her toes down.
☺ While in ER, she was examined, xrated and sent home.
☺ The skin is moist and dry.
☺ Occasional, constant, infrequent
headaches.
☺ Patient was alert and unresponsive.
☺ She stated that she had been
constipated for most of her life until
she got a divorce.
☺ Rectal examination revealed a
normal-size thyroid.
☺ I saw your patient today, who is still
under our car for physical therapy.
☺ The lab test indicated abnormal lover
function.
☺ The patient was to have a bowel
resection. However, he took a job as a
stockbroker instead.
☺ Skin: somewhat pale but present.
The pelvic exam will be done later on
the floor.
☺ Patient was seen in consultation by
Dr._____, Who felt we should sit on
the abdomen and I agree.
☺ Large bowl stool ambulating in the
hall.
☺ She has no rigors or shaking chills, but
her husband states she was hot in bed
last night.
☺ Patient was found in bed with her
power mower.
14
Tips on Getting the Best
Service from the Laboratory
1- Be sure to complete all requested
information on request forms.
Complete patient information, identification of your office and the correct
test name are essential. Be sure to print
clearly. If you want a test not stated
on the request form consult the
laboratory staff and find out if there
are alternative tests or if arrangements
can be done to send to a referral
laboratory.
2- Please always remember to include the
patient's clinical data in addition to the
required diagnosis. This information is
vital in interpreting the laboratory
results. Some information is essential to
provide, such as the fasting status of a
patient tested for plasma glucose, or use
of a medication prior to collection of a
sample. The reason for ordering a
qualitative or quantitative beta-HCG
test should also be stated as this helps in
interpreting the attained results. The
need for clinical data cannot be of very
emphasized
3- Attention to detail in filling out the
Laboratory test request form is
important. Correctly identifying the
patient is important if more thano n e
member of the family if is treated as an
error can result in the wrong family
member getting the results.
4- Age and sex should be shown on the
request form so the l laboratory can
indicate the correct age and sex specific
reference values for comparison with
patient's results.
5- The laboratory result report forms
should be easy to read and contain
appropriate reference ranges. If you
have difficulty reading test results, discuss
with the laboratory staff, as a different
reporting system may be possible.
Report delivery over the Internet is also
possible.
6- If you develop a closer working
relationship with the laboratory staff
problems can be dealt with faster and
more effectively and you can use the
laboratory optimally.
7- Consultation is always available at a
professional level and the laboratory
staff is always more than happy to advise
their users about test selection, result
interpretation for specific patients, test
interferences due to food, drugs or other
factors and specific methods for
performing complex tests.
8- Carefully follow the laboratory's
instructions about the correct collection
tube to use. Compulsive attention to
anticoagulants and preservatives is
essential for correct test results.
Substituting a different kind of tube
may result in a specimen that is unsuitable for testing.
9- Communication: make your expectations known to the laboratory staff and
this will make work relationships much
better.
Reference:
Daniel M. Baer, M.D. R.E. Besley, M.D. Getting the best
from your referral laboratory.
continued from page 9
Highly Sensitive (HS)CRP
disease. The researchers could not find a
direct correlation between CRP levels and
cancer risk. However, they did conclude
that there was a significant relationship
between CRP and heart disease, thus
strengthening the theory that CRP is a
strong predictor for cardiovascular risk.
The Future of CRP
Despite some initial doubt, the majority
of the studies mentioned above clearly
show evidence that strongly suggests that
high levels of hsCRP serve as predictors
of cardiovascular risk. As an adjunct to
other screening methods, testing for high
CRP levels can be easily employed for
the early detection and subsequent
primary prevention of heart disease.
Among the studies highlighted, several
revealed anassociation between high levels
of CRP and increased BMI and waist
Straight
By Moonya
talk
When Drinking Becomes a Problem
W
hen drunk frequently, alcohol
can be addictive. A person is
generally considered to be dependent on
alcohol when they have experienced 3 or
more of the following symptoms during
a year
a strong urge to drink
difficulty controlling drinking
physical withdrawal symptoms e.g.
sweating, shaking, agitation, and
nausea when they try to reduce
drinking
a growing tolerance to alcohol i.e.
needing larger quantities to get the
same effect
gradual neglect of other activities
persistent drinking even though it is
obviously causing harm.
The strength of an alcoholic drink is
indicated by the percentage of alcohol by
volume (ABV). A unit of alcohol is
8grams of pure alcohol regardless of the
amount of liquid it is contained in. the
number of units in one liter of any drink
is equal to the ABV. A 500ml can of 8%
ABV lager contains 4 units and a 340ml
can of 3.5% ABV is 1.2 units. Some
medical experts believe men should drink
size, physical inactivity, and the presence
of coronary calcification. Lifestyle
modifications for high-risk patients can
help to decrease cholesterol levels, reduce
inflammatory processes, and decelerate
atherosclerotic progression.
Inflammation represents an attractive target of therapeutic intervention
for patients at risk for cardiovascular
disease. Monitoring inflammatory markers such as CRP is a viable complement
to the evaluation of traditional risk
factors such as hypertension, high LDL
cholesterol, obesity, smoking, and
genetics. As the research of CRP continues, a greater understanding of the
direct role CRP plays in cardiovascular
risk and the means by which pharmaceuticals, such as statin drugs, work to
reduce CRP levels will emerge.
no more than 3-4 units per day and women
no more than 2-3 per day and it does not
help to 'save up” the units over the week
and use them binge over the weekend.
Women become more impaired then men
do after drinking the same amount of
alcohol. This is because women's' bodies
have less water then men's bodies. Sincere
alcohol mixes with body water a give
amount of alcohol becomes more highly
concentrated in a woman's body than in a
men's body. Hence the lower units quoted
for women. Chronic alcohol abuse takes a
heavier physical toll on women than on
men. Alcohol dependence and related
medical problems such as brain, heart and
liver damage progress more rapidly in
women that in man.
Short-term effect of alcohol include (i)
alcohol suppress the part of the brain that
controls judgment resulting in loss of
inhibition. (2) It also affects physical
coordination (3) Causes blurred vision
slurred speech and loss of balance.
Drinking a very large amount of alcohol at
one time can lead to unconsciousness, coma
and even death. Alcohol is implicated in a
large proportion of fatal road accidents,
assault and incidents of domestic violence.
Excessive drinking overtime is associated
with loss of brain cells, liver failure, irritated
stomach lining and bleeding from stomach
ulcers, high blood pressure, heat failure and
epilepsy. Excessive drinking has also been
linked to vitamin deficiency, obesity, sexual
problems, skin problems and inflammation of the pancreas.
Women who drink heavily during
pregnancy are at risk of having babies with
a condition called fetal alcohol syndrome,
which can result in growth deficiency,
nervous system problem, lowered
intelligence and facial problems in the child.
Pregnant women who drink more than 10
units in week are likely to have under weight
babies. It is not known if there is an
absolutely safe limit for drinking during
pregnancy, but it may be wise to avoid
alcohol all together.
Problem drinking occurs when a
person in not dependent on alcohol, but
drinks enough to cause actual physical or
psychological harm. Alcoholism is actually
a disease with symptoms and requires
treatment. Screening for an alcohol
problem can be done in two ways. One
method involves a person recognizing that
problem themselves through a selfscreening on begin interviewed by some
one else.
The acronym CAGE can be used for
self-screen
C have you ever felt that you should Cut
down on your drinking
A Have u even felt Annoyed by other
people criticizing your drinking
G have you ever felt Guilty about your
drinking
E do you have morning “Eye Opener
(Morning Drink)
The second method involves health
professional ordering lab test that can
detect body changes associated with
excessive alcohol consumption.
If an alcohol problem has been
identified, one should consider cutting
down or stopping drinking altogether.
Tips on cutting down include
Go out later, so u start drinking later
Replace your usual drink to one with
less alcohol
Have at least two alcohol free days a
week.
Set yourself a limit for any one
occasion
Find other way to relax.
When deciding to stop drinking
consult a General Practitioner who will
give you confidential support. To prevent
with drawl symptoms, a chronic heavy
drinker may be prescribed medication for
a few days after stopping drinking.
We need to start recognizing alcohol
abuse and alcoholism not as issues of
morality or “Will Power”, but public
health and social issues.
The article includes information from Medical College of
Wisconsin health Link, National Institute on Alcohol Abuse and
Alcoholism and National Council on Alcoholism and Drug Abuse
BUPA alcohol fact sheet.
Interlude
Dentist: “Could you give out a few of your
loudest, most painful screams?”
Patient: “Why, doctor? It’s not that bad.”
Dentist: “There are so many people in the
waiting room right now, and I
don’t want to miss the four
o’clock game.”
15


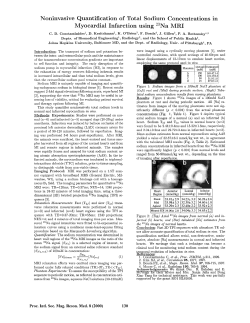


© Copyright 2026