
Evaluation of Driver`s Psychophysiological Load At Freeway
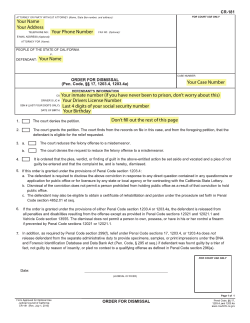
TRB ID Number : 01-0535
Evaluation of Driver's Psychophysiological
Load at Freeway Merging Area
Submitted for Presentation and Publication
for 2001 TRB Annual Meeting
Dr. Myungsoon Chang, Professor
Department of Transportation Engineering, Hanyang University
1271 Sa 1 Dong, Ansan, Kyunggido, Korea, 425-791
Tel : +82-31-400-5151
Fax : +82-31-406-6290
E-mail : [email protected]
Mr. Juyoung Kim, Researcher
Korea Highway Corporation
293-1, Kumtodong, Sujonggu, Sungnam, Kyunggido, Korea, 461-380
Tel : +82-2-2230-4652
Fax : +82-2-2230-4182
E-mail : [email protected]
Dr. kyungwoo Kang, Professor
Department of Transportation Engineering, Hanyang University
1271 Sa 1 Dong, Ansan, Kyunggido, Korea, 425-791
Tel : +82-31-400-5153
Fax : +82-31-406-6290
E-mail : [email protected]
Mr. Jungho Yun, Researcher
Department of Transportation Engineering, Hanyang University
1271 Sa 1 Dong, Ansan, Kyunggido, Korea, 425-791
Tel : +82-31-407-3540
Fax : +82-31-406-6290
E-mail : [email protected]
1
ABSTRACT
This study evaluated the change of driver's psychophysiological load of occipital lobe
at freeway merge area and compared with basic driving section. Ten persons of 8 men
and 2 women were investigated at 3 basic sections and 3 merging areas on the
Youngdong freeway. It is found that driver's load in acceleration lane before merging is
2.21 times higher than the basic driving section. Further, driver's load for merging was
maintained for 4 seconds after merging. Particularly, driver's highest loading point in
merging behavior was found to be from gore area to 80m.
INTRODUCTION
In seeking ways to prevent traffic accidents, it is important to pay particular attention
to the causes associated with drivers, in addition to such preventive considerations as
improving roadway facilities and vehicle performance.
The objective of this study is to identify changes of drivers' work load by quantitative
measurement of psychophysiological load as they drive in freeway merge area. Freeway
merge area is specifically chosen for the study because in that area drivers encounter
complicated traffic environments as they have to enter freeway through ramp,
accelerate, and merge into freeway in poor sight distance while high degree of alert and
concentration is required on their merging performance.
REVIEW OF RELATED STUDIES
Psychophysiological Load Measurement
Workload measurement is widely used to identify factors in a quantitative form that
give psychophysiological influence to drivers. With the development of measuring
technology, researchers have been able to begin measuring and analyzing drivers' work
load using physiological signals generated from drivers.
Physiological measurement may be conducted for electroencephalogram,
electromyogram, and electrocardiography to identify pupil size, changes in heartbeat,
brain activity, etc. Physiological measurement should be conducted in a way and to the
extent that drivers are not interrupted. It offers advantage of giving continuous output.
Electroencephalogram
Electroencephalogram is tiny rhythmical electrical activity of brain cell, derived
using an electrode attached to head skin, amplified using electroencephalograph, shown
on a vertical axis with time on a horizontal axis. It is a live signal form brain function
that changes all the time.
Electroencephalogram found from human brain is classified into four types in
general: α, β, δ and θ, depending on their amplitude and frequency. Type β is detected
when a person is in physical or mental activities, with 2∼ 20 ㎶ amplitude and 12∼ 40
Hz frequency. It was discovered that occipital lobe in human brain governs drivers'
2
visual function. Considerable reaction is detected when they drive on a curve or when
they change the lane. Frontal lobe is also known to control some of the visual function.
In recognition of the fact that physiological signal reflects the change of the driver
situations, many researches have been conducted to identify the level of vigilance with
detection of drivers' electroencephalogram. Some researchers(1) reported that drivers'
performance varies depending on the vigilance level and conducted experiments to find
ways to improve drivers' vigilance level.
There was another research(2) related to electroencephalogram measurement reporting
that the complication degree of external excitement has effect on the activation of
electroencephalogram, which consequently influence human perception. They reported
that, as the complication degree of excitement becomes higher, the activation of
electroencephalogram related to tension relief is blocked, and the activation of
electroencephalogram related to improvement of vigilance level increased. This finding
may well be explained in connection with drivers' overload. When a driver is
overloaded, his or her brain system demands alert and concentration required to process
information received from drivers' traffic environment, consequently increasing the
vigilance level.
Helander(3) conducted a survey in 1975 to identify the correlation of drivers’ vehicle
operation and physiological response. They measured physiological response including
skin electricity response, electrocardiogram and electromyogram. The study showed
that the driver responded most at the intersections with bridge, at the road bump, and at
the merge area.
Brookhuis and others(4,5) conducted a research in 1993 for the changes in
physiological signal to identify the drivers’ conditions on freeways. For this research,
20 people drove on freeway under vigilance condition for 150 minutes to identify the
effect on their manipulation of steering wheel and their driving performance to follow
vehicle ahead going at varying speeds. Based on the measurement of energy factors
(Theta+Alpha)/Beta), the standard deviation of handle movement increased, whereas
the number of wheel returning decreased. The energy factor of the driver following
vehicle ahead going at varying speed decreased with time.
DATA COLLECTION AND REDUCTION
Survey Area and Subjects
After visiting feasible sites to determine survey locations on the Youngdong
Expressway, three basic tangent sections without merging situation with 200m distance
and three merging areas covering ramp, acceleration lane, and a section beyond the
merging point to certain distance ahead were selected. The design speed of expressway
and ramp was 80 and 50km/h respectively with grades between 1.4% and 1.0%
The basic section and merging section are alternately located and the two sections
were separated by the sufficient distance that is not affected by each other. The survey
locations were determined to satisfy the conditions that drivers' vigilance level should
not be influenced by large advertisement structure and construction zones except
roadway geometry. Ten driving testees were selected with normal vision capacity, one
year or more of driving experience, and clean record.
3
Survey Vehicles
The survey vehicle was equipped with measuring devices to collect physiological
signals and external environmental data, which enable quantification of changing
testee’s physical and emotional data. Figure 1 shows the survey vehicle.
CCTV Camera
Notebook
Physiological Signal Measurement
Apparatus
CCTV Camera
Velocity/Distance
Measurement
Inertia force
Measurement
Tachometer
Velocity/Distance
Measurement
FIGURE 1 Survey Vehicle Diagram
The physiological signals that the measuring device could collect included
electroencephalography (EEG), skin conductance response (SCR), electrocardiography (ECG), electromyogram (EMG), and electrooculomotorgraphy (EOG).
The measuring device could also collect environmental data, including vehicle speed,
drivers' behavioral changes, movement of adjacent vehicles, and their approaching
speed and distance. The measuring equipment included interface module, simulator
module, and amplifier with 16 channels that amplifies detected body signals.
Data Collection
The study aims to measure drivers’ electroencephalography signal to analyze the
drivers’ vigilance level. The changes of the β signal from the occipital lobe is collected
together with following data.
Testee's personal records (age, driving records, gender, eyesight)
EEG signal from occipital lobe at merging section
Roadway geometry characteristics at merging section
Distance from gore to the point of the vehicle merging
Traffic volume on freeway at the time of vehicle merging
4
When testees arrived at the survey site, their personal records were identified. Before
electrodes were attached to testee's body, the pertinent areas of skin were cleaned using
oil removal skin cream. Appropriate electrodes and lead cables necessary to measure
signals from body were installed at the predetermined locations on the body. The
measuring system was checked to ensure that body signals are detected from each
respective channel.
For the stablization of subjects, they were allowed to drive for 10 to 20 minutes to
relieve the uncomfortableness by the attached electrodes. When the testees drove on the
merging area, the signals from their body were measured and recorded. We took the
same measurement on the basic sections for comparison with that of merging area. The
merging area used for the study was from the beginning of the ramp to the point where
the driver has proceeded for 10 seconds after he or she completed merging into the
freeway traffic flow. To analyze the relation between merging distance and the
electroencephalography change in the acceleration lane, The distance in the acceleration
lane is marked by 40m increment. The 40m span was chosen since the measuring
equipment was unable to divide signal in less than one second increment.
Video recorder installed in the survey vehicle recorded the front view of the vehicle
along with the time so that analyzers could later trace the data of the desired time to
conduct the body signal data division using appropriate analysis program. The body
signal was converted to frequency band to collect the β signal of the occipital lobe.
DATA ANALYSIS
In consideration of the fact that drivers are most influenced by vision rather than the
sense of hearing or smell, the study analyzed the electroencephalography data of
occipital lobe where vision is controlled. The collected data were analyzed by fast
Fourie transform to obtain relative power spectrum for each frequency band of
electroencephalography, i.e., δ(0.5∼ 4 Hz), θ(4∼ 8Hz), α (8∼ 12 Hz) and β (12∼ 30
Hz). Finally, we used β data for this study.
We obtained the value of β change in three different sections: the ramp section, the
gore to the point of merging, and the section after merging. For the basic driving section,
we collected the relative spectrum of the β value as well.
In Figure 2, where the survey vehicle enters the ramp and drives up to the beginning
point of the acceleration lane is section 1. The second section is where the vehicle
passes gore, accelerating and merging to freeway. The third section is started when the
merging vehicle had moved fully in the freeway through lane and continues for 10
seconds. The purpose of adding the third section in the survey was to find out how long
the drivers' physiological change from previous section would last.
5
Median Barrier
Section2
Section 3
Section 1
Merging
Starting Point of Point
Acceleration Lane
4 Seconds
after merging
FIGURE 2 Section Division of Merging Area
Traffic volume data from the point the vehicle enters the acceleration lane to the
point the vehicle was merged and proceeded in the freeway traffic was also collected on
the outside lane of the freeway at the same time of collecting brain signals,. The traffic
volume collected did not take account of the vehicle type, and was converted to the
traffic volume per hour. The distance needed for the vehicle to merge was measured
using the video recordings and the distance marking. The video recording was also
utilized for the signal division.
The β signal was calculated by the 40m distance interval. The β signal increase was
then calculated using the following formula.
β Signal Increase=
β Signal from Merging Area
β Signal from Basic Roadway
(1)
Effect of Section Division in Merging Area
The β signal increase was obtained by averaging 3 sectional data collected by 10
testees, which means 3 different data were available for each section. In this process,
the data that could not be analyzed due to its generation in less than one second, as
described previously, was eliminated to give consistency in the data presentation.
Figure 3 shows the β signal increase in the merging area divided into 3 sections as
described. Comparing with the β signal of the basic driving section, the first ramp
section showed 1.09 times greater β signal, 2.21 times greater β signal for the second
section (accelerating and merging), and 1.22 times greater β signal for the third section
(for 4 seconds after merging). Apparently, it was found that drivers' vigilance level
considerably rose as they started accelerating and then merged to freeway.
ANOVA analysis was conducted on these results. Table 1 indicates the difference
between survey sections based on 5% significance level. To identify more accurate
difference, Duncan's test was conducted with the result shown in Table 1. This table
may be interpreted to show major difference between first and second sections, and
between the second and third sections, indicating that the second section is the highest
vigilance level section.
As mentioned, the drivers showed highest vigilance level (2.21 times greater than on
basic section) in the second section as they accelerated and merged into the freeway. It
seems that this happened because this was the section where the two traffic flows from
ramp and the freeway met, and the driver was demanded a great deal of visual
6
information to search the gap for merging. The β signal increase ratio of 1.22 found
after merging indicates that the drivers vigilance level experienced in the second section
would remain for some period of time even after merging was completed.
3
β Signal Increase
2.5
2. 21
2
1.5
1. 22
1. 09
1
0.5
0
1
2
3
Section
FIGURE 3 β Value of Occipital Lobe at Merging Area
TABLE 1
source
model
error
total
ANOVA and Duncan’s Test By Three Merging Sections
sum of
mean
df
F value
Pr>F
squares
square
2
3.24012659 1.62006329
11.35
0.0003**
27
3.85408571 0.14274392
29
7.09421229
Duncan Grouping
A
B
A
Mean
1.09
2.21
1.22
n
10
10
10
Section
1
2
3
Acceleration Lane Analysis by Distance
It was found that drivers’ vigilance level was at its highest from the beginning of
acceleration to the time just before merging was made. In order to further identify the β
signal increase in acceleration section, we divided the 240m acceleration section in 40m
increment, which was the minimum distance that allowed the signal analysis. We
collected 3 merging area data from each testee, totaling 180 data altogether. Then,
after excluding those data collected from the subsections with distance corresponding to
the time less than one second, a total of 132 data were collected for the analysis.
As shown in Figure 4 and Table 2, the β signal increase found in this section ranged
1.24 to 2.88. It is noted that relatively lower rate (1.24) was found in the section
between the 160m and 200m distance. This is believed to have happened due to an
unidentifiable factor encountered.
Duncan's test was conducted to further find out difference between each 40m section,
7
and confirmed that 160m-to-200m section was the only section that indicated the
difference. Most of the testees showed continued increase starting gore to the 40m
section and then to the 80m.
6
β Signal Increase
5
4
2.88
3
2.88
2.58
2.39
2.31
2
1.24
1
0
0- 40m
40- 80m
80- 120m
120- 160m
160- 200m
200- 240m
Merging Distance
FIGURE 4 β Signal Increase by 40m Distance Interval Before Merging
TABLE 2
ANOVA and Duncan's Test for Distance Interval before Merging
sum of
squares
mean
square
source
df
model
5
40.4134956 8.08269912
error
126
354.841478 2.81620221
total
131
395.254973
F value
Pr>F
2.87
0.0173**
Duncan Grouping
A
Mean
2.88
n
22
Gore(0m)∼ 40m
A
2.88
22
40m∼ 80m
A
2.31
22
80m∼ 120m
A
2.39
22
120m∼ 160m
A
2.58
22
200m∼ 240m
B
1.24
22
160m∼ 200m
8
Section
Acceleration Lane Analysis for Accumulated Distance
In addition to the analysis for each separate distance sections, similar analysis was
conducted for accumulated distance sections for varying total merging distances.
Through this analysis, we could obtain the vigilance level for each merging distance. It
was found as shown in Figure 5 and Table 3 that the drivers showed the β signal
increase of 2.88 times when they merged within 0 to 40m and 0 to 80m distance as well,
whereas 2.01 and 1.96 ratio were found when they merged within 0 to 200 m and 0 to
240m distance respectively.
β Signal Increase
6
5
4
3
2. 88
2. 88
2. 63
2. 35
2. 01
2
1. 96
1
0
0- 40m
0- 80m
0- 120m
0- 160m
0- 200m
0- 240m
Cum ulated Merging Distance (m )
FIGURE 5 β Signal Increase by Cumulated Distance Before Merging
ANOVA analysis shown in Table 3 was made to check any difference between
accumulated sections. Since differences were confirmed, we conducted a Duncan's test
and found that there were difference between the ratios found in the sections of 0 to
40m and 0 to 80m and the ratios found in the sections of 0 to 200m and 0 to 240m.
9
TABLE 3
ANOVA and Duncan's Test for Cumulated Distance Before Merging
sum of
squares
mean
square
source
df
model
5
18.6692011 3.73384022
error
126
152.832884 1.21295940
total
131
171.502085
Duncan Grouping
F value
Pr>F
3.08
0.0118**
Mean
n
Section
A
2.88
22
0m∼ 80m
A
2.88
22
0m∼ 40m
A
B
2.63
22
0m∼ 120m
A
B
2.35
22
0m∼ 160m
B
2.01
22
0m∼ 200m
B
1.96
22
0m∼ 240m
Since the highest vigilance level is found from the gore to 80m on the acceleration
lane, a special marking treatment such as shown in Figure 6 is recommended for
implementation.
80m
80m
FIGURE 6 Suggested Special Marking Treatment on Acceleration Lane
10
Vigilance Increase Analysis on Acceleration Lane
β Signal Increase
This part of the study is intended to find a model for the vigilance level in relation to
associated factors. Since we could believe through this study that the increase rate of β
signal from drivers while they are on the acceleration lane, was a function of the
merging distance and the traffic volume on freeway outside lane as shown on Figure 7
and 8, we looked for a model representing their relations.
4. 5
4
3. 5
3
2. 5
2
1. 5
1
0. 5
0
0
50
100
150
200
250
300
Merging Distance (m)
β Signal Increase
FIGURE 7 β Signal Variation by Merging Distance
4.5
4
3.5
3
2.5
2
1.5
1
0.5
0
0
500
1000
1500
2000
Freeway Outside Lane Volume (vph)
2500
FIGURE 8 β Signal Variation by Freeway Outside Lane Volume
From each testee, 3 outputs were collected totaling 30 outputs. We excluded those
data which could not be analyzed due to its corresponding time less than one second.
Also excluded were the data we judged to be outlier. A total of 21 outputs therefore
were used in finding the relation. Through a regression analysis, an equation was
derived.
∆ β = 0.04565759D – 0.00447506V + 0.00000261V2 – 0.0001258D2 (R2=0.92) (2)
Where,
∆ β = β signal increase compared to basic section
V = freeway outside lane volume (vph)
D = merging distance (m)
11
According to this equation and Figure 9, drivers' visual vigilance level increases with
merging distance to certain point and then decreases, whereas it continues to increase
with increasing traffic volume on the freeway outside lane.
FIGURE 9 β Signal Increase by Merging Distance and Mainline Volume
Analysis after Merging
An analysis was conducted to further identify the subsequent influence after merging.
We analyzed β signals in one second increment starting first signal in 2 seconds after
merging. The signal data were collected and analyzed for each time increment after
merging, taking 3 merging area data from each testee, totaling 120 data altogether for 4
time duration cases with 10 testees.
As shown in Figure 10, β signal rate of 1.53 was found in two seconds after merging,
which was then decreased to 1.49 in three seconds, down to 1.22 in four seconds, and to
0.62 in 5 seconds.
It is found that the drivers' vigilance level after merging remained for the first four
seconds considerably. As shown in Table 4 of ANOVA and Duncan's test, there is a
considerable difference of the rate in the first 4 seconds from 5 seconds.
12
3
β Signal Increase
2. 5
2
1. 53
1. 5
1. 49
1. 22
1
0. 62
0. 5
0
2 Sec
3 Sec
4 Sec
5 Sec
Time After Merging
FIGURE 10 β Signal Increase by Time After Merging
TABLE 4
source
model
error
total
ANOVA and Duncan's Test for Time Duration after Merging
df
sum of
mean
F value
Pr>F
squares
square
3
16.0065898 5.33552995
5.82
0.0010**
116
106.419545 0.91740987
119
122.426135
Duncan
Grouping
A
A
A
B
Mean
n
1.53
1.49
1.22
0.62
30
30
30
30
Time After
Merging
2
3
4
5
CONCLUSION
The study identified the changes in drivers' vigilance level at the freeway merge area
in comparison with normal basic section, by quantifying associated β signal outputs
collected in the survey. The results of the study may be summarized as follows.
When the drivers drove on ramp leading to a freeway, accelerated and merge into the
freeway, the drivers' vigilance level increased to a range of 1.09 to 2.21 times greater
than that found with the same drivers driving on a basic roadway. Highest vigilance
level increase as much as 2.21 times was found from where the drivers started
accelerating to where they had completed merging to freeway.
Drivers who have completed merging to freeway remained under the influence of the
vigilance they had during their merging, for the duration of 4 seconds further. Drivers
who merged within 80m acceleration distance showed much higher vigilance level than
those who made the merging within 240m. In addition, Drivers visual vigilance level
13
increased with merging distance to certain point and then decreased, whereas the level
continued to increase with increasing freeway outside lane volume.
ACKNOWLEDGMENT
This paper is supported by the fund from Brain Korea(BK) 21 Project administered by
The Korea Research Foundation under the Ministry of Education, Republic of Korea.
REFERENCE
1. Wilson, J. R. & Rutherford, A., "Mental Models : Theory and Application in Human
Factors", Human Factors, 31(6) , 1989
2. Wierwille, W. W., J. C. Hicks, T. G. and Muto, "Secondary Task Measurement of
Workload as a Function of Simulated Vehicle Dynamics Driving Conditions", Human
Factors, 35(2),1977
3. Helander, M.G., "Physiological Reactions of Drivers as Indicators of Road
Traffic Demand", TRB 530, 1975
4. Brookhuis, K. A., Waard, D. and Mulder, L. J. M., "Measuring Driving Performance
by Car-following in Traffic", Ergonomics, 1993
5. Wierwille, W. W. & Eggemeier, F. T., "Recommendations for Mental
Workload Measurement in a Test and Evaluation Environment", Human Factors,
35(2), 1993
14
![[FAQ] How to merge several AVI files into a single file?](http://cdn1.abcdocz.com/store/data/000175551_1-1455c90b50ea466edf462bbb4705a9c0-250x500.png)


© Copyright 2026