
t-Test Two-Sample in Excel > Tools > Data Analysis
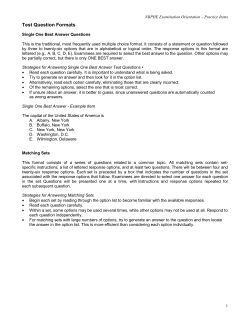
t-Test Two-Sample in Excel > Tools > Data Analysis
t-Test: Paired Two Sample for Means
Before-and-after dependent samples
Does not assume that variances are equal; it uses a
pooled variance.
t-Test: Two-Sample Assuming Equal Variances
t-Test : Two-Sample Assuming Unequal Variances
z-Test:
A two-sample z-Test for means with known
variances.
Dialog box for the t-Test Two-Sample tests
The dialog box for all of the t-Tests looks like this; only the title varies:
Excel Help says:
Variable 1 Range
Enter the cell reference for the first range of data that you want to analyze. The range
must consist of a single column or row and contain the same number of data points as the second range.
Variable 2 Range
Enter the cell reference for the second range of data that you want to analyze. The
range must consist of a single column or row and contain the same number of data points as the first
range.
Hypothesized Mean Difference
Enter the number that you want for the shift in sample means. A value
of 0 (zero) indicates that the sample means are hypothesized to be equal.
Labels
Select if the first row or column of your input ranges contains labels. Clear this check box if your
input ranges have no labels. Microsoft Office Excel generates the appropriate data labels for the output
table.
Alpha
Enter the confidence level for the test. This value must be in the range 0...1. The alpha level is a
significance level that is related to the probability of having a type I error (rejecting a true hypothesis).
Output Range
Enter the reference for the upper-left cell of the output table. Excel automatically
determines the size of the output area and displays a message if the output table will replace existing data.
New Worksheet Ply
Click to insert a new worksheet in the current workbook and paste the results
starting at cell A1 of the new worksheet. To name the new worksheet, type a name in the box.
New Workbook
Click to create a new workbook in which results are added to a new worksheet.
Discussion of each of the t-Tests
From Excel Help:
t-Test: Paired Two Sample For Means
You can use a paired test when there is a natural pairing of observations in the samples, such as when a
sample group is tested twice — before and after an experiment. This analysis tool and its formula perform
a paired two-sample Student's t-Test to determine whether observations that are taken before a treatment
and observations taken after a treatment are likely to have come from distributions with equal population
means. This t-test form does not assume that the variances of both populations are equal.
NOTE
Among the results that are generated by this tool is pooled variance, an accumulated measure of
the spread of data about the mean, which is derived from the following formula.
t-Test: Two-Sample Assuming Equal Variances
This analysis tool performs a two-sample student's t-test. This t-test form assumes that the two data sets
came from distributions with the same variances. It is referred to as a homoscedastic t-test. You can use
this t-test to determine whether the two samples are likely to have come from distributions with equal
population means.
t-Test: Two-Sample Assuming Unequal Variances
This analysis tool performs a two-sample student's t-test. This t-test form assumes that the two data sets
came from distributions with unequal variances. It is referred to as a heteroscedastic t-test. As with the
preceding Equal Variances case, you can use this t-test to determine whether the two samples are likely to
have come from distributions with equal population means. Use this test when there are distinct subjects in
the two samples. Use the Paired test, described in the follow example, when there is a single set of
subjects and the two samples represent measurements for each subject before and after a treatment.
The following formula is used to determine the statistic value t.
The following formula is used to calculate the degrees of freedom, df. Because the result of the calculation
is usually not an integer, the value of df is rounded to the nearest integer to obtain a critical value from the t
table. The Excel worksheet function TTEST uses the calculated df value without rounding, because it is
possible to compute a value for TTEST with a noninteger df. Because of these different approaches to
determining the degrees of freedom, the results of TTEST and this t-Test tool will differ in the Unequal
Variances case.
The z-Test Two Sample for Means (Known Variances)
Dialog Box
Pretty much the same as for the t-Tests with added fields for the two populations’ variances.
The z-Test: Two Sample for Means analysis tool performs a two sample z-Test for means with known
variances. This tool is used to test the null hypothesis that there is no difference between two population
means against either one-sided or two-sided alternative hypotheses. If variances are not known, the
worksheet function ZTEST should be used instead.
When you use the z-Test tool, be careful to understand the output. "P(Z <= z) one-tail" is really P(Z >=
ABS(z)), the probability of a z-value further from 0 in the same direction as the observed z value when
there is no difference between the population means. "P(Z <= z) two-tail" is really P(Z >= ABS(z) or Z <= ABS(z)), the probability of a z-value further from 0 in either direction than the observed z-value when there
is no difference between the population means. The two-tailed result is just the one-tailed result multiplied
by 2. The z-Test tool can also be used for the case where the null hypothesis is that there is a specific
nonzero value for the difference between the two population means. For example, you can use this test to
determine differences between the performances of two car models.


© Copyright 2026