
QUEST FOR GROWTH NV
QUEST FOR GROWTH NV
Quest for Growth 2002-2003
2
CONTENTS
5
Profile,Aim, Policy
. . . . . . . . . . . . . . . . . . . . . . . . . . . . . . . . . . .6
Corporate Governance
. . . . . . . . . . . . . . . . . . . . . . . . . . . . . . . . . . .7
Board of Directors
. . . . . . . . . . . . . . . . . . . . . . . . . . . . . . . . . . .8
Key facts
. . . . . . . . . . . . . . . . . . . . . . . . . . . . . . . . . . .13
Investment Report
. . . . . . . . . . . . . . . . . . . . . . . . . . . . . . . . . . .14
Investment Manager’s Report . . . . . . . . . . . . . . . . . . . . . . . . . . . . . . .14
Sector developments
. . . . . . . . . . . . . . . . . . . . . . . . . . . . . . . . . . .16
Portfolio
. . . . . . . . . . . . . . . . . . . . . . . . . . . . . . . . . . .26
Portfolio composition: By country . . . . . . . . . . . . . . . . . . . . . . . . . .26
By sector . . . . . . . . . . . . . . . . . . . . . . . . . . .26
By stock market . . . . . . . . . . . . . . . . . . . . .26
Holdings at June 30th, 2003 . . . . . . . . . . . . . . . . . . . . . . . . . . . . . . . . .27
Company profiles:
Unquoted companies . . . . . . . . . . . . . . . . .28
Venture capital funds . . . . . . . . . . . . . . . . . .29
Quoted companies . . . . . . . . . . . . . . . . . . .30
Financial data
. . . . . . . . . . . . . . . . . . . . . . . . . . . . . . . . . . .36
Balance sheet
. . . . . . . . . . . . . . . . . . . . . . . . . . . . . . . . . . .36
Profit and loss account . . . . . . . . . . . . . . . . . . . . . . . . . . . . . . . . . . .36
Profit distribution
. . . . . . . . . . . . . . . . . . . . . . . . . . . . . . . . . . .37
Off balance sheet positions . . . . . . . . . . . . . . . . . . . . . . . . . . . . . . . . .37
Post balance sheet events . . . . . . . . . . . . . . . . . . . . . . . . . . . . . . . . . .37
Notes to the financial statements . . . . . . . . . . . . . . . . . . . . . . . . . . . .38
Valuation rules
. . . . . . . . . . . . . . . . . . . . . . . . . . . . . . . . . . .40
Report of the Board of Directors . . . . . . . . . . . . . . . . . . . . . . . . . . . . . . .41
Report of the Independent Directors . . . . . . . . . . . . . . . . . . . . . . . . . . . .42
Report of the Statutory Auditor . . . . . . . . . . . . . . . . . . . . . . . . . . . . . . . .43
Glossary
. . . . . . . . . . . . . . . . . . . . . . . . . . . . . . . . . . .44
General information
. . . . . . . . . . . . . . . . . . . . . . . . . . . . . . . . . . .46
Financial calendar
. . . . . . . . . . . . . . . . . . . . . . . . . . . . . . . . . . .50
Key information
. . . . . . . . . . . . . . . . . . . . . . . . . . . . . . . . . . .51
Statement by the Chairman . . . . . . . . . . . . . . . . . . . . . . . . . . . . . . . . . . .
3
Quest for Growth 2002-2003
Quest for Growth 2002-2003
4
STATEMENT BY
STATEMENT BY THE CHAIRMAN
THE CHAIRMAN
Dear shareholder,
For the year as a whole the result remains negative, which is disappointing.
Nevertheless in the final quarter of the year Quest for Growth was able for the first time in six quarters
to show a profit and in relative terms the overall performance for the year compares well with that of
similar investment funds and relevant indices.
The so called IPO window remained firmly shut during the year. With no technology based companies
emerging as imminent stock market candidates, the Board of Directors relaxed the investment criteria for
the privately held companies in the portfolio from 18 months before a liquidity event to 36 months.This
has had a positive impact on the number of potential investments and has already resulted in a new
unquoted investment after the end of the accounting year.
The ongoing malaise in the technology markets and the lack of new stock market introductions has led to
major problems for the specialist stock markets that sprung up in Europe in the late nineties. Nouveau
Marché, Neuer Markt and Nasdaq Europe (formally Easdaq) are all in the process of a formal close down.
The best companies on these markets have migrated to the main exchanges, but going forward Europe
faces again a challenge to develop a liquid market for its growth companies.
In the middle of the year Quest for Growth received the award for the best investor communication from
the Flemish Federation of Investment Clubs and Investors (the VFB) and from Morningstar/Cash Magazine
for best communications outside the Bel-20. For the team at Quest Management these rewards were a
great encouragement to continue the policy of voluntary quarterly reports, comprehensive website
information and regular investors clubs, even in times of decline.
On your behalf I would like to thank the team at Quest Management for their ongoing commitment to
their task. A special thanks goes to Mr Philip Fearnhead who will step down from his role as Chief
Executive of Quest Management at the time of the General Meeting of shareholders of Quest for Growth.
Under Philip’s’ stewardship Quest for Growth was able to pay a record dividend in 2000 and to
consistently rank among the best technology investment funds in the world in relative performance.We are
pleased that he will continue to provide Quest Management with his insights in the macro-economic
developments and their possible impact on the world stock markets.
The cumulative losses of Quest for Growth over the past three years resulted in a situation were the
management fee which is payable to Quest Management was no longer in line with market practices,
equally the way the incentive for performance was structured would not allow Quest for Growth to make
result related payments for many years to come. Quest for Growth has renegotiated its contract with
Quest Management such that subject to regulatory and shareholders approval a substantial reduction in
the management fee will result and a performance related reward can be paid in case dividends are paid to
the shareholders. I am convinced that these changes will realign the interest of shareholders and
management and that markets permitting we should be able to return to positive absolute results.
Dr. Jos B. Peeters
Chairman
Quest for Growth 2002-2003
With this fifth annual report we are leaving the third year of harsh market
conditions behind us. Last year I concluded by noting that history tells us that such
significant downturns in the stock market as the one we were experiencing don’t
reverse quickly. Sadly the first half of the year gave no comfort and only in the last
months of the accounting year did we start to see a revival of the stock markets.
It is too early to tell whether or not this revival is based on a lasting
improvements in the fundamentals of the companies or whether it will be a short
lived excursion.
5
PROFILE,
AIM, POLICY
PROFILE, AIM, POLICY
Quest for Growth 2002-2003
6
Quest for Growth focuses on European technology-based
Tax Benefits
growth companies in sectors such as biotechnology, medical,
The Privak benefits from important tax advantages. These benefits
health care, information technology, software, electronics, new
only apply as long as the investment rules are adhered to and:
materials and special situations in other growth sectors. Funds
under management amount to € 47 million, on June 30th 2003.
-
All investments are made in companies, subject to a normal
tax regime;
Quest for Growth has been listed on Euronext Brussels since
September 23rd, 1998.
-
Over 80% of the realised benefits of the fiscal year are paid
out as dividend. (Quest for Growth states in its bylaws that
at least 90% of the realised benefits will be paid out.)
The Privak, created by Royal Decree of April 18th, 1997, is an
investment vehicle, specially tailored to provide a suitable
Dividends:
The part of the dividend resulting from capital
framework for investments in private equity and in growth
gains will be exempt from withholding tax.
companies.
The remaining part of the dividend will be
subject to a withholding tax of 15%.
The Privak is a closed-end fund under the regulation of the
Individuals: withholding taxes are considered as
Belgian Banking Commission and subject to specific investment
final taxes;
and dividend pay out rules:
Investment rules
-
A minimum of 50% of the portfolio must be invested in equity;
-
A minimum of 70% of the portfolio (qualified investments)
must be invested in:
●
Unquoted companies;
●
Companies quoted on a growth market1 or
●
Venture Funds with an investment policy similar to the
Companies: 95% of the gross dividend income
resulting from capital gains can be deducted from
taxable profit (Dividend Received Deduction),
withholding taxes can be credited against
corporate taxes.
Capital gains: Individuals: exempt from taxation;
Companies: subject to normal corporate taxes.
Privak.
However, investments in quoted companies on a growth
market can never exceed 50% of the qualified investments.
INVESTMENT POLICY
Quest for Growth invests in growth companies with the
objective of converting capital gains into tax-free income
-
The company is not allowed to invest over 20% of the
through the Privak structure. The largest part of the
portfolio in one company, nor invest over € 6,2 million in
portfolio is invested in companies listed on growth markets
one year, in one company.
(NASDAQ Europe, EuroNM, NASDAQ, AIM) and other
regulated markets. Under Privak rules this part may not
exceed 65% of the assets from June 2003.
The balance will be invested in unquoted companies
intending to seek an introduction to a stock exchange
within 36 months. Investments in start-ups or early stage
companies are allowed, but will be exceptional.
Up to 15% of the assets can be invested in venture or
1
Defined by the Belgian Banking Commission as NASDAQ Europe, NASDAQ, Nieuwe Markt (Belgium),
Le Nouveau Marché (France), Neuer Markt (Germany), Nuovo Mercato (Italy), NMAX-New Market
(The Netherlands) and Alternative Investment Market (U.K.).
private equity funds having an investment policy compatible
with that of Quest for Growth.
CORPORATE
GOVERNANCE
CORPORATE GOVERNANCE
7
The Board also created an audit committee. The audit
corporate law, by the Privak legislation in particular and by a set of
committee is composed of four directors – amongst them, two
rules, laid out in the Ethical Code that applies to the directors of
independent directors – who have no operational or functional
the Privak, of Quest Management NV and its personnel, the
responsibilities in the company. The primary function of the
depositary bank and the investment advisers. Quest Management
audit committee is to assist the Board of Directors in fulfilling its
NV is the investment manager for Quest for Growth NV.
oversight responsibilities by reviewing:
The board of Quest for Growth includes 11 directors, of which
-
accounting and financial reporting processes;
4 are nominated by the owners of the A-shares and 4 are
nominated by the holders of the B-shares.
The quality and integrity of the company’s auditing,
-
The financial reports and other financial information
provided by the Company to the shareholders, government
bodies and the public;
The board of directors of Quest for Growth has appointed
two independent directors to monitor the daily management
-
The company’s systems of internal controls regarding
of the company by its managing director, Quest Management
finance, accounting, legal compliance and ethics that
NV. They verify, in particular, any situations where one of the
management and Board have established.
following persons has a direct or indirect interest in a
transaction by the company:
information and personnel with information pertinent to the
-
The depository bank or the management company, or
-
Persons with whom the company, the management company
or the depositary bank are linked or
-
The audit committee has unlimited and direct access to all
Board members, directors, persons who are responsible for
proper performance of its duties and can dispose of all
resources necessary to perform its tasks. The company is
expected to maintain free and open communication with the
auditors and management of the corporation.
the daily management of the Privak, the management
The daily management of the company has to abide to the
company or the depository bank.
general principle in the Privak legislation that the company has
to be managed in the sole interest of the shareholders (Art. 24,
The annual report must justify these transactions, especially with
Royal Decree 18th April 1997).
regard to the benefit the Privak could draw from the
transactions and compliance with its investment policy.
In addition, the company has to act according to Articles 523,
524 and 529 of the Belgian Company Code. These articles
The auditor, in his general responsibility for the control of the
contain a set of special rules, which apply in the case where a
accounts, also has the duty to report specifically about such
company represented by a board member has a commercial
situations in the annual report.
interest in a decision to be taken by the Board.
BOARD OF DIRECTORS
Dr. Jos B. Peeters, Chairman
Quest Management NV, Managing Director, represented by Philip Fearnhead BVBA,
Managing Director, Quest Management NV
Bergendal & CO SPRL, Vice Chairman, represented by Comte Diego du Monceau de Bergendal,
Tacan BVBA,Vice Chairman, represented by Mr. Johan Tack
Philippe Haspeslagh BVBA, represented by Prof. Philippe Haspeslagh
Joedheco NV, represented by Mr. Leo Claeys
Mr. Patrick Millecam
Mr. René Avonts
Gengest BVBA, Independent Director, represented by Mr. Rudi Mariën
Prof. Koen Debackere, Independent Director
Mr. John Boeckmann
Quest for Growth 2002-2003
Quest for Growth is governed by a set of rules imposed by
THE
OF DIRECTO
THEBOARD
BOARD OF DIRECTORS
Bergendal
& Co SPRL
Quest for Growth 2002-2003
8
Vice Chairman
Dr. Jos B. Peeters
Chairman
represented by
Tacan BVBA
Comte Diego du
Monceau de
Bergendal
Vice Chairman
represented by
Mr. Johan Tack
Jos B. Peeters is the founder and
Diego du Monceau de Bergendal
Johan Tack obtained a degree in
managing partner of Capricorn
brings with him a wealth of senior
Economic Sciences and a Special
Venture Partners NV. For seven
management experience. After a
License in Management at the
years he was managing director of
successful career in corporate finance
University of Ghent. Since 1976 he
BeneVent Management, a Belgian
with Merrill Lynch and Swiss Bank
has been active within various
based venture capital operation
International Corporation, he joined
commercial
associated with the Kredietbank-
GIB Group where he rose to become
functions with Generale Bank (now
Almanij
Group.
Managing Director and subsequently
Fortis Bank). As a member of the
worked
for
Chief Executive Officer.
Executive Committee of Fortis
Previously
the
he
international
technology based consulting group
Bank, he
and
was
managerial
responsible
for
PA Technology and for the Bell
Today he is Vice Chairman of
Marketing and Finance and Control
Telephone Manufacturing Company,
Continental Bakeries (Netherlands),
(1994-1997), Asset
Management
now part of Alcatel.
Chairman
(1997-2000)
the
Dr. Peeters has Belgian nationality
Committee
of
and holds a Ph.D. in Physics from the
Independent
Director
University of Leuven.
Belgium,
He has also been Chairman of the
Applications)
of
the
Executive
E-Capital,
of
an
and
Credit
Department (1998-2000).
ING
(Ion
Beam
Mr. Tack also created in 1981 the
of
WE
Vlaamse Investeringsvennootschap,
European Venture Capital Association
International, as well as being on
actually Fortis Private Equity, where
(EVCA) and of the working group,
the boards of several non-profit
he was Managing Director until
which
organisations.
1983 and Board Member until 1994.
founded
the
European
of
IBA
and
Association of Securities Dealers
Today,
(EASD). He was a co-founder of
Director on several boards such as
EASDAQ and is currently a Director
Samsonite Corp. and City Hotels.
of NASDAQ Europe.
He
is
he
is
also
an
Independent
advising
companies as a consultant.
different
ORS
Quest
Management NV
Managing Director
Philippe
Haspeslagh
BVBA
repr. by Philip
Director
Joedheco NV
Fearnhead BVBA
repr. by
Director
Managing Director
Prof. Philippe
Haspeslagh
represented by
Mr. Leo Claeys
Quest Management, the investment
Philippe Haspeslagh is a Professor at
Mr. Claeys is shareholder of the
manager for Quest for Growth, carries
INSEAD, the international business
Roularta Media Group since 1972. He
out
school
in
built up the internal structure of the
due
recommends
diligence
investigations,
investment
with
campuses
and
Fontainebleau and Singapore, where
media group and is Vice-Chairman of
divestment decisions, and monitors and
he holds the Paul Desmarais Chair in
the Board of Directors.
produces valuations of the portfolio.
Partnership and Active Ownership. He
Philip Fearnhead BVBA, represented
is also a Professor at the Vlerick
Mr. Claeys is also active in the
by Mr. Philip Fearnhead, is Managing
Leuven Gent Management School.
Boards
of
Directors
of
SDE
software solutions,Accentis,Vincent
Director of Quest Management NV.
Mr. Fearnhead holds a B.Sc. degree in
He previously taught as a Visiting
Sheppard company and various
Physics from Imperial College in
Faculty member at the Harvard
family partnerships. He is President
London, and a M.Sc. degree from the
Business School and the Stanford
of the Cennini Investment Holding.
University of Wales. He spent nearly
Business School, and was a Chief of
ten years in sales and marketing posts
Cabinet for the Belgian Minister of
with IBM before joining Kleinwort
Agriculture and Small and Medium
Benson (now Dresdner Kleinwort
Enterprises. His research is in the
Benson) as their computer industry
areas of Mergers and Acquisitions,
analyst and has worked as a consultant
Corporate Strategy, Managing for
to
Value and Corporate Governance.
international
IT
and
Telecommunications vendors. In 1993
Philippe
he
Academic
joined
London
insurer
NPI
Haspeslagh
Director
Board's
is
the
of
the
(National Provident Institution) where
Conference
he was responsible for international
Council on Corporate Strategy, as
investments in both quoted and
well as the Director of the ABN-
unquoted companies, with a particular
AMRO
focus on technology investments.
Managing for Value at INSEAD. He
Research
European
Initiative
in
is the Chairman of Brains in
Motion NV, Dujardin Foods NV,
and Quest Management NV. He is a
Board
Venture
Member
of
Partners
Capricorn
NV
and
Kinepolis. He is also a nonexecutive partner in Procuritas, a
Scandinavian buy-out firm.
Quest for Growth 2002-2003
Quest Management NV
9
Quest for Growth 2002-2003
10
Mr. Patrick Millecam
Director
Patrick Millecam has a degree in Economic Sciences from the University of Ghent (RUG) and a degree in informatics from the
University of Brussels (VUB). In the beginning of 1993 P. Millecam joined Corluy as a financial analyst. As a portfolio manager he
won a lot of recognitions and awards for Bank Corluy: the Tijd Award for the highest return in 1 year in the pension funds
category in 1996 and 1997, the Tijd Award for highest return in 1 year for the Belgian stocks category in 1997, the Tijd Award for
the highest return in 3 years in the pension funds category in 1997 and 1998 and the Sicav de Cristal for the highest return in 1
year for the Belgian stocks category in 1998. P. Millecam is currently responsible for the investments in Flemish stocks (VLAM21),
Belgian stocks (Top Global Belgian Shares) and the pension fund (Top Global Pension) of the Bank Corluy.
Mr. René Avonts
Director
Graduated in applied economics (Ingénieur Commercial) from the University of Leuven in 1970 and started his career in the
IT-division of Paribas Belgique. He joined the International Division in 1972 and became head of that Department in 1985. He
was elected member of the Executive Committee and Director in 1995 with responsibility over Capital Markets and
Corporate Banking. In 1998, he became member of the Executive Committee of Artesia Bank and Bacob, in charge of Financial
Markets and Investment Banking as well as chairman of Artesia Securities, the groups equity broker, which was renamed Dexia
Securities after the acquisition of Artesia by Dexia in 2001. He Left the bank in March 2002 at the time of the legal merger
between Dexia and Artesia. He was subsequently appointed Director and CFO of Elex nv: the reference shareholder of e.g.
Melexis, Xfabs and EPIQ. He also joined Unit International, an investor in energy projects in Turkey and the Middle East, as
Company Director and Chief Financial Officer.
Gengest BVBA
Independent Director
repr. by Mr. Rudi Mariën
Rudi M. Mariën, born in 1945, is co-founder of INNOGENETICS; he has been Chairman of the Board of Directors and major
shareholder since the foundation of the company.
Mr. Mariën is also the founder, shareholder and Representative Director of several medical laboratories.
He is the President of BARC NV, an accredited international leading central clinical laboratory, specialised in pharmaceutical
studies and in performing analyses within the framework of occupational medicine.
He has a degree in pharmaceutical sciences at the State University of Ghent and a specialisation in clinical biology.
11
Independent director
Koenraad Debackere holds M.Sc. and Ph.D. degrees in Electrical Engineering and Management. He studied at the University of
Ghent and MIT, Cambridge, U.S.
He is a full professor in Technology and Innovation Management at the University of Leuven. He has been a visiting professor at
Nijmegen Business School and is a faculty member at the Vlerick Leuven Ghent Management School. He has been a guest lecturer at
various European business schools (Manchester, Kiel, Tilburg, Insead). He is the head of the research division INCENTIM at the
University of Leuven. This division has developed extensive experience in doing fundamental and applied research in the area of
technology and innovation management. Koenraad Debackere has received several international awards and nominations for his
research activities in the area of technology and innovation management. He obtained Best Research Paper Awards from the American
Academy of Management and the Decisions Sciences Institute. He has authored over 70 articles and book chapters in this field.
He has been involved in projects for the European Commission, the Belgian and Dutch government and multinationals. Koenraad
Debackere is the Managing Director of K.U.Leuven Research & Development and Chairman of Gemma Frisius-Fonds K.U.Leuven
nv, the Venture Fund of the University.
In November 1999 he was nominated Chairman of Leuven.Inc (Leuven Innovation Networking Circle).
Mr. John Boeckmann
Director
After training as a stockbroker, John Boeckmann joined M&G in 1967 as an Investment Manager for UK assets. Between 1971 and
1978 he was a director of two listed public companies, specialising in asset realignment, which were both successfully sold. Until
he left M&G in 1997, he managed a wide range of M&G funds such as equities, bonds, for retail and charity accounts, UK mutual
funds, pension funds and special accounts including US accounts. From 1985 he successfully developed M&G Continental
European exposure for specialist, pension and mutual fund activities. In 1997 he joined Compagnie Monégasque de Banque as a
director responsible for Compagnie Monégasque de Gestion. He remains a consultant to banks in Portugal and Switzerland.
Quest for Growth 2002-2003
Prof. Koenraad Debackere
Quest for Growth 2002-2003
12
KEY
KEYFACTS
FACTS
13
1/7/200130/6/2002
1/7/200030/6/2001
€
€
€
€
€
(14,198,939)
(49,311,136)
(19,523,576)
56,426,078
3,126,851
(2.62)
(9.10)
(3.60)
20.83
1.15
Ordinary dividend:
0
0
0
37,363,457
3,106,746
Dividend to A and B shares:
0
0
0
7,053,266
0
Profit / loss carried forward:
(71,004,191)
(56,805,252)
(7,494,116)
12,029,460
20,105
Ordinary Dividend per share (before withholding taxes):
0
0
0
13.80
1.15
Ordinary Dividend per share (after withholding taxes):
0
0
0
13.60
1.09
Net profit / loss:
Net profit / loss per share:
1/7/1999- 23/9/199830/6/2000 30/06/1999
June 30th, June 30th, June 30th, June 30th, June 30th,
2003
2002
2001
2000
1999
N.A.V.:
46,223,375
60,422,315
109,733,451
123,575,750
70,256,418
N.A.V. / share:
8.53
11.16
20.26
45.63
25.94
Stock Price / share:
5.30
6.90
15.65
34.89
19.00
Warrant Price:
0.41
5,416,000
5,416,000
2,708,000
2,708,000
Number of Shares:
5,416,000
Number of Warrants:
5,416,000
VOLUME (000)
STOCK PRICE
120
43
38
100
33
80
VOLUME
EURO
28
23
18
60
40
13
20
8
3
99 99 99 00 01 00
00 /00
7/ 9/ 1/ 1/ 4/ 03/
7/
9
/0 /0 /1 /0 /0
/
/0 5/0
01 03 08 12 03 15
24
2
0
01 01 01
02 02 02
01 01
02 02 02 03 03
1/ 4/ 04/
2/ 04/ 06/ 08/ 10/ 12/ 02/ 04/
8/ 0/
/0 /1
/
/
/0 /0
/
/
/0
/
/
/
/
30 03 03
07 09
12 16 18
20 22 24 26 30
02 02 02
99 99 99
02
02
03 03
02
01
00
00
00
01 01 01
00
01
00
01
00
7/ 09/ 11/ 01/ 03/ 05/ 07/ 09/ 11/ 01/ 04/ 06/ 08/ 10/ 12/ 02/ 04/ 06/ 08/ 10/ 12/ 02/ 04/
/0
/
/
/
/
/
/
/
/
/
/
/
/
/
/
/
/
/
/
/
/
/
/
18
01 03 08
16
20 22 24
26 30
12
12
18
11
15
24
05 07 09
25
03
28
30
Quest for Growth 2002-2003
1/7/200230/6/2003
INVESTMENT REPORTREPORT
INVESTMENT
Quest for Growth 2002-2003
14
Investment Manager’s Report
1 In last year’s report we said that the near term outlook for
5 Data from the OECD’s Leading Indicators suggests that an
equities was difficult, and it certainly was. Between 30th June
2002 and October the CSFB Technology Index (CSET), which
reflects the performance of 50 of Europe’s largest technology
firms, fell over 50% and the Bloomberg 50 index of small
European technology stocks (BENMAX50) fell 30%. This was
followed by a strong rally and then a further sharp decline in the
first quarter of 2003.
economic improvement can be expected in the US during the
2 Despite several failed rallies in equity markets, bonds have
showed that business conditions in Germany have remained dire
enjoyed one of their best ever periods, doubling in value during
the past 2 1/2 years, as investors sought certainty of returns.
for the past year and are not yet showing significant signs of
next 6 months, while Europe may also be seeing early signs of
improving prospects.
Within Europe, Germany remains the
laggard, with its economy more dependent than most on
manufacturing industries.
6 The IFO Institute survey of business conditions in June 2003
improvement.We are, however, encouraged that both the German
and French governments have recognized the need for reform
In March 2003, following the "successful" outcome to the Iraq
war, equities started a new rally, which has continued through to
the time of writing. This rally, initially described as a post-war
relief rally, is being supported by the extraordinarily low returns
now available on long term bonds, as well as high expectations
for an earnings recovery. Unless one believes that price deflation
is likely in the near to medium term, which we do not,
government bonds have to be considered to be quite expensive.
of their labour and pensions systems as this should eventually
3 Nonetheless, the aggressive monetary and fiscal loosening by
7 Although many manufactured goods are subject to strong
the US Federal Reserve has driven equity valuations back to high
levels based on earnings multiples, particularly in the technology
sector where a P/E ratio of around 28 for the Information
Technology section of the S&P 500 Index is a 50% premium to
the market average, despite falling expectations for the long term
rate of earnings growth (still around 14%).
pricing pressure, the service sector is finding more pricing power
4 Significant profits growth is possible in the coming year,
particularly among US companies which have been aggressively
shedding labour to reduce costs. The result of this lower cost
base is that company earnings can grow substantially on a modest
improvement in revenues. It remains to be seen, however,
whether the profits recovery can match investors’ expectations.
free resources for the corporate and personal sector.
Two main issues face the equity market in the coming year. The
first is the achievement of revenue growth (which is still only a
forecast). The second is that the economy recovers too quickly
and bond yields rise rapidly, since that would reduce the
attractiveness of equities compared to bonds.
as it is harder for low cost foreign companies to compete in this
area. Although many economists cite the challenge of low cost
production from Asia, particularly China, it is also important to
note the growing contribution from demographic changes that
are occurring in Europe and the US. Aging populations consume
less goods but require more services.
Because of this
demographic change, we do not expect to see demand driven
inflation of manufactured goods in Europe or the US. This is in
contrast to Asia and the Middle East, where the proportion of
young people entering the workforce greatly outweighs the
number of retirees, Japan being a notable exception.
15
120
Quest for Growth 2002-2003
1
Performance of Technology Indices rebased to 1/7/02
CSET
BENMAX50
NASDAQ Composite
110
100
90
80
70
60
9 Semiconductor sales have recovered significantly
01/06/2003
01/05/2003
01/04/2003
01/03/2003
01/02/2003
01/01/2003
01/12/2002
01/11/2002
01/01/2002
and electronic products have also remained flat for the
01/09/2002
40
sales have been stagnant. Similarly, US sales of computer
01/08/2002
50
in Asia during the past 2 years, while European and US
01/07/2002
8
past 2 years. This highlights the difficulties faced by
2
technology companies.
There is considerable momentum in equity markets as we
end the financial year. However, with valuations stretched,
7
Governement Bond Yields
7
6
6
5
5
4
4
3
3
there is considerable risk in the market until earnings are
economic downturn, the 50% P/E premium of technology
3
03/05/2003
03/03/2003
03/01/2003
03/11/2002
03/09/2002
03/07/2002
03/05/2002
03/03/2002
03/01/2002
03/11/2001
03/09/2001
03/07/2001
2
03/05/2001
03/03/2001
03/01/2001
03/05/2000
03/03/2000
very few new companies listing on the stock markets
03/01/2000
1
The market uncertainty of the past year has resulted in
and private equity valuations have continued to decline.
10 Year US Treasury
Fed Funds Target
ECB Refinance Rate
UK Base Rat
2
stocks to the broader market seems hard to justify.
03/11/2000
valuations always look expensive near the end of an
03/09/2000
While
03/07/2000
demonstrated to be recovering significantly.
S&P 500 information technology valuation & growth
1
an improvement in the coming year as confidence
60
55
50
45
40
35
30
25
20
15
10
2,5
returns to both public and private equity markets.
2,0
Nonetheless, we are cautious that any recovery may be
1,5
1,5
slower than markets currently anticipate due to high
1,0
1,0
levels of consumer, corporate and governement debt.
0,5
0,5
This has hurt our portfolio valuation as we have seen
considerable reductions in value in the private equity
portfolio. However, it also leads to the emergence of
new investment opportunities at more attractive
valuations than during the past 3 years. We hope to see
P/E*
Earnings Growth**
Jun
P/E Relative to S&P 500
Jun
60
55
50
45
40
35
30
25
20
15
10
2,5
2,0
There also remain significant problems of both debt and
trade imbalances for many governments, which could
still cause difficulties in the year ahead.
* Price divided by 12-month forward consensus expected operating earnings per share using mid-month data.
** 5-year forward consensus expected earnings growth. Percent annual rate.
Source:Thomson Financial/Prudential Securities
4
US Jobless Claims
4000
600
550
3500
16
500
000's
Quest for Growth 2002-2003
400
2500
000's
450
3000
350
300
2000
5
02/03/2003
02/03/2002
02/03/2001
02/03/2000
02/03/1999
02/03/1998
02/03/1997
02/03/1996
250
02/03/1995
02/03/1994
02/03/1993
02/03/1992
02/03/1991
02/03/1990
1500
Continuing Claims
Initial Claims
200
Euro area, Japan and USA
12
8
4
0
-4
Japan
USA
Eura area
-8
-12 1994
1995
1996
1997
1998
1999
2000
2001
2002
2003
OECD Trend Restored Composite Leading Economic Indicator, 4th July 2003
6
Assessment of Current Business Situation vs. Business Expectations
Trade and Industry
1)
1998 to 2003
30
Boom
Upswing
20
Jan. 2000
10
Jan. 1998
0
Jan. 2001
June 2003
Jan 1999
-10
Jan
2002
-20
Downswing
Recession
-30
0-35
-30
-25
-20
-15
-10
-5
0
5
Current business situation
1) Manufacturing industry, construction, wholesale and retail trade.
Balances, seasonally adjusted data.
Source: ifo Business Survey, West Germany.
10
15
20
25
30
7
4,0%
Annual Consumer Price Inflation in the Euro area
Goods
Services
3,5%
17
3,0%
2,0%
1,5%
1,0%
0,5%
0,0% Jan
96
8
Jul
96
Jan
97
Jul
97
Jan
98
Jul
98
Jan
99
Jul
99
Jan
00
Jul
00
Jan
01
Jul
01
Jan
02
Jul
02
Jan
03
US Computers & Electronics Products
monthly sales & inventories
40
Shipments
35
30
25
20
15 Jan
Jan
93
92
Jan
94
Jan
95
Jan
96
Jan
97
Jan
98
Jan
99
Jan
00
Jan
01
Jan
02
Jan
03
9
Monthly Semiconductor Sales
-3 months moving average ($m)
20000000
7000000
18000000
America
Europa
Japan
Asia Pasific
Worldwide (RHS)
6000000
5000000
16000000
14000000
12000000
4000000
10000000
3000000
8000000
6000000
2000000
4000000
1000000
0
2000000
Jan
90
Jan
91
Jan
92
Jan
93
Jan
94
Jan
95
Jan
96
Jan
97
Jan
98
Jan
99
Jan
00
Jan
01
Jan
02
Jan
03
0
Quest for Growth 2002-2003
2,5%
Quest for Growth 2002-2003
18
Sector developments
Overview Private equity – investments in
unquoted companies and venture funds
early-stage venture opportunities. Nowadays, traditional ‘late
stage’ players such as Quest for Growth have been joined by
venture capital funds that were previously focused on earlier
Current status of the European Private Equity Market
stage investment opportunities.This is leading to an ‘over-supply’
1 The past year has seen total European investment in private
of funding chasing the few credible mature investment
equity hold steady, while there was a further decline in the
opportunities. For many investors, finding more stable
output of new funds raised, particularly in the technology
opportunities with perceived lower downside risk outweighs the
sector. According to the European Venture Capital Association,
€
27.5 billion was raised in 2002 and € 27.6 billion was
invested, compared to the peak of € 34.9 billion investments in
2000. European private equity investments in technology
continued to fall in 2002 despite the fact that total private
equity investments had their second best year ever. The
technology sector suffered a drop in investment of almost 30%
previously much more valued upside criteria.
Companies attracting investor interest today require robust
business models with strong near-term profit potential. In many
technology sectors, development is slower than expected forcing
the venture capital industry to take a longer-term perspective.
compared with the previous year, and 50% from its peak in
2000 (Source: PCW Money for Growth Survey). Fundraising
Financing, internal rounds, down-rounds
for technology investment decreased to € 4.2 billion in 2002,
4 An increased proportion of companies is receiving follow-on
compared to € 9.6 billion in 2001. In 2001 technology
financing from their existing investors, reflecting sustained
represented 25% of all European private equity funds raised
support to promising portfolio companies. As much as 62.3% of
while in 2002 it represented only 15%.
venture-backed companies received follow-on financing in 2002.
Venture capitalists are tending to focus more on their existing
High competition in late stage venture capital area
2
3 In general, we see a repositioning of funds and investment
focus away from early stage towards later stage companies. The
bulk of private equity money has been going into late-stage
companies, spin-offs and public companies (‘public-to-private’)
which these days are often valued as low as a new start-up, but
have a longer track-record and are closer to reaching success.
portfolio than on new opportunities. Where possible, a higher
proportion of the funds is reserved for continuing support of the
most promising portfolio companies.When financing rounds are
done entirely by existing investors (‘internal rounds’), severe
down-rounds can be avoided. In a down round, existing investors
are diluted and a lower valuation is placed on the invested
The proportion of technology private equity investment going
company by new investors. Early stage companies in sectors such
into buy-outs almost doubled from 2001 to 2002. Venture
as telecom may only be able to attract new financing at 10% of
capitalists are more wary of chasing ‘the next big thing’ than a
their peak valuations. Early investors then face the choice
few years ago. During the bull market of the late 1990s to 2000,
between being diluted and putting in more money to remain a
much of the capital in the venture capital industry flowed into
significant shareholder.
1
Funds raised and investments made in Europe in 2002
(Source: EVCA)
60
Funds Raised
investments
50
in million €
40
30
20
19
10
1991
1992
1993 1994
1995 1996
1997
1998
1999 2000
2001
2002
Funds raised and Investments made in Europe in 2002
(Source: EVCA)
2
10
8
Median Pre-money Valuation of European Venture Backed Companies
(Source: Venture One/E&Y)
7.7
7.9
7.5
in million €
6.4
6.3
6.0
5.7
6
6.0
5.3
4.6
4
3.5
3.8
Virtually no IPOs
Over the past year, the exit market has remained
2
continued and led to a high proportion of write-offs
Q4-02
Q2-02
Q4-00
Q2-01
cleaning up of portfolios across the industry
Q4-00
0
particularly for exits in the form of IPOs. The
Q2-00
troubled for the private equity market in general,
3
(30% of all exits in 2002).
862
1000
Not a single IPO with a value of more than € 30 million
took place in the technology sector in the first half of
Seed
Start-up
Expansion
800
707
2003 in Europe.This compares with only one technology
611
IPO > € 30 million in the first six months of 2002, and five
600
534
449
in the same period in 2001 (Source: CSFB). In the United
431
369
400
States, the previous IPO factory known as Silicon Valley
341
328
316
has been switched off. Of the mere 70 IPOs in 2002, only
200
19 were public offerings of venture-capital-backed
37
companies while during the boom of the Nasdaq, venture-
0
backed IPOs were almost a daily occurrence. Currently
38
Q2 2002
33
Q3 2002
22
Q4 2002
Q1 2003
Number of investments done by stage
very few IPOs are underway or effective and it is unclear
when the window will reopen. Too many investors and
Q1 2002
49
(Source: EVCA/ PWC/ Thomson Financial Venture Economics)
4
companies alike got burned in the shakeout.
With investors so cautious, only very high quality
Start-up
9.5%
Expansion
24.8%
Replacement
Capital
3.4%
companies can hope for successful IPOs. Nowadays
companies
going
public
will
be
mostly
long-
established businesses, sometimes units of already
public companies and not just business plans hatched
in a garage a year ago. The average age of companies
going public from 1980 to 2002 was 7 years, in 2002 it
was 14 (Source: Forbes Global). And today even well
Seed
1.1%
Buyout
61.2%
established companies such as Google have chosen to
bide their time.
Stage distribution by percentage of amount invested in 2002 (Source: EVCA)
Quest for Growth 2002-2003
0
5
6
Monthly deal-flow of Quest for Growth
(Source: Quest Management)
35
Technology earnings growth forecasts
70%
70%
40%
2002E
30
2003E
60%
60%
50%
50%
20
40%
40%
15
30%
30%
10
20%
20%
5
10%
10%
0
0%
0%
25
2004E
35%
30%
05/27/03
04/27/03
03/27/03
20%
02/27/03
05/01/03
02/01/03
11/01/02
06/01/02
25%
05/01/02
02/01/02
11/01/02
07/01/02
03/01/02
11/01/01
07/01/01
03/01/01
jun/03
mei/03
apr/03
mrt/03
feb/03
jan/03
dec/02
nov/02
okt/02
sep/03
aug/02
Actual
jul/02
Quest for Growth 2002-2003
20
Public reaction to the wave of scandals in the governance to
Quest portfolio
public companies might result in additional obstacles to
The value of private equity and venture capital portfolios has
companies seeking to go public such as higher risk of claims of
decreased as a consequence of lower company valuations and
improper disclosures; a shrinking pool of analysts to cover the
very difficult exit markets, which also imply longer holding
stock once the company is public; increased costs of maintaining
periods. Also Quest for Growth’s portfolio of private companies
a public registration and the not-so-distant threat of criminal
and venture funds has suffered with companies going through
penalties in the event financial results are misstated. When we
down-rounds, major restructurings and even failures.
look at investment banking, we see that the infrastructure to
support IPO’s has been decimated. For the foreseeable future,
Investments in quoted companies
trade-sales, mergers and acquisitions are the most realistic
option for companies seeking liquidity and investors seeking exits
from their investments.
6 The earnings forecasts for technology companies in 2003
and 2004 are expected to grow by more than 30% as shown in
the graphs. This seems doable with an economic turn as the
Another route to exit can be the recapitalisation of a portfolio
recent cost cutting resulted in more operational leverage. This
company. This mechanism involves the re-leveraging of the
means that the gross and operating margins of technology
company, so that cash can be returned to the shareholders by
companies increased. But at this stage we haven’t seen many
way of dividend and/or return of capital. However, this is only an
signs of an IT spend uptick.
exit option in the case of investments in mature businesses with
low levels of operational risk. It is rarely an exit option in the
While the hyper growth rates of the TMT sector in the late 1990’s
case of technology investments.
may be a thing of the past, we believe that there are enough
attractively valued stocks with strong fundamentals to invest in.
Quest for Growth deal- flow
5 The number of deals in the market has decreased
Semiconductors
considerably.We need to see a resurgence of activity across the
7 After two years of semiconductor revenue declines, -32% and -
technology sector before deal-flow has real momentum again.
2% in respectively 2001 and 2002, business is expected to show
Quest for Growth’s deal-flow consists for approximately one
growth again in 2003. Important is to analyse where this growth will
third of companies in the Life Sciences/ Biotech sector.There still
come from. Firstly, it is key to look at the average selling prices (ASP)
is a shortage of pre-IPO files, the area of investment that is
of chips.The structural overcapacity in the 90’s due to the emergence
targeted by Quest for Growth. Our fund is looking for
of the foundries model and the free access to capital in the notorious
technology companies that already have revenues and that are
bubble, resulted in declining ASP’s. In the graph you see that ASP’s are
on a clear path to profitability. On the Life Sciences/ biotech side,
finally going up again. Secondly, the volume or the number of units
we prefer companies that have started Phase II clinical trials.
produced are likely to bottom out in the summer at the time when
Quest for Growth’s targeted horizon to exit is 3 years.
prices are going up. Historically, the performance of the
7
Global semiconductor revenue forecast
200
2003E: $142 billlion
2-6% growth
150
100
50
0
1997
137
8
10
31
22
65
1988
8%
126
8
8
31
19
58
1999
19%
149
9
12
37
22
70
2000
37%
204
12
20
55
29
88
2001E
32%
139
12
13
29
24
61
2002E
-2%
137
14
16
25
24
60
2003E
4%
142
15
15
24
26
63
2004E
13%
161
18
17
25
28
72
8
Fig 3. Semiconductor Average Selling Price Growth (YoY & MoM)
Three-Month Rolling Average
8%
30%
25%
6%
20%
4%
10%
2%
semiconductor stocks has correlated well with the revenue
5%
growth of the semiconductors. Growth should mainly
0%
Jul-87
Jul-87
Jul-88
Jul-88
Jul-89
Jul-89
Jul-90
Jul-90
Jul-91
Jul-91
Jul-92
Jul-92
Jul-93
Jul-93
Jul-94
Jul-94
Jul-95
Jul-95
Jul-96
Jul-96
Jul-97
Jul-97
Jul-98
Jul-98
Jul-99
Jul-99
Jul-00
Jul-00
Jul-01
Jul-01
Jul-02
Jul-02
Jul-03
15%
-2%
-5%
come from increased semiconductor content and
0%
-10%
-4%
consumer spending (consumer electronics, PC’s and
-15%
3M rolling average ($ ASP)
mobiles).
-20%
YoY growth rate (LHS)
MoM growth rate (RHS)
Mo
-6%
-8%
-25%
Semiconductor equipment
8
9 10 The units growth and the low capital spending
9
by semiconductor companies in the last 2 years led to a
pick up in semiconductor equipment spending in 2003.
40%
Mainly DRAM producers (memory chips) and Japanese
30%
Fig 2. Semiconductor Unit Growth (YoY & MoM)
Three-Month Rolling Average
12%
10%
8%
semi manufacturers are ordering new equipment. It is
20%
end equipment. Primarily the back end (inspection,
packaging of chips) business is improving, driven by unit
6%
10%
4%
0%
2%
growth. If the number of units increase, more packaging
-10%
and inspection equipment will be ordered.
-20%
The front end (actual production of the chips on the
-30%
wafer by lithography tools) is still very difficult and is
-40%
Jul-87
Jul-87
Jul-88
Jul-88
Jul-89
Jul-89
Jul-90
Jul-90
Jul-91
Jul-91
Jul-92
Jul-92
Jul-93
Jul-93
Jul-94
Jul-94
Jul-95
Jul-95
Jul-96
Jul-96
Jul-97
Jul-97
Jul-98
Jul-98
Jul-99
Jul-99
Jul-00
Jul-00
Jul-01
Jul-01
Jul-02
Jul-02
Jul-03
important to differentiate between front end and back
0%
-2%
-4%
3M rolling average (units)
-6%
YoY growth rate (LHS)
MoM growth rate (RHS)
-8%
not expected to pick up until next year. The front end
business is impacted by the capacity utilisation of chip
manufactures. This utilisation is now slightly picking up
10
Global semiconductor equipment forecast
but the manufactures are still hesitant to buy new and
100%
60
additional equipment.
50
2003E: $20.1 billlion
3% growth
80%
60%
($ billions)
40
40%
20%
30
0%
20
-20%
10
0
Equip Rews
SPE Growth
-40%
1997
$27,5
5%
1998
$21,8
-21%
1999
$25,5
17%
2000
$47,7
87%
2001E
$28,0
-41%
2002E
$19,5
-30%
2003E
$20,1
3%
2004E
$24,2
20%
-60%
21
Quest for Growth 2002-2003
Growth %
Total
Auto
Other
Comm
Consumer
Data Proc
Quest for Growth 2002-2003
22
Communication equipment and telecom
downside, the uncertainty is now more balanced between the
11 12 13 Within the telecom sector, the fixed line businesses
possible upside from the US and the downside in Europe.We can
remain under pressure in most markets on the back of
see some improvement in the US but Europe continues to be a
continued substitution by mobile, increased competition,
difficult area for software sales.The question is whether Europe will
uncertain government regulation and pricing risks (bundled
see a further slow down during 2003. The ECB recently cut its
substitutes). However, all telecom operators focused in the last
GDP forecast to 0.7% and 1.6% for 2003 and 2004 respectively.
year or two on cash generation in order to be able to meet the
high debt obligations. This resulted in restructurings and capital
spending cuts. The capex spending on telecom equipment fell
31% in 2002 and is expected to fall further in 2003 (-7%). It can
take several years to work off the overcapacity of the bandwith
which was built up in the late ’90. Capex as a percentage of
revenue of the operators fell back from 20% in 2000 to 12-14%
of revenues. This level is probably not sustainable over a long
Most software companies were able to implement cost cutting
measures to avoid serious operating degradation during the last
downturn. We doubt whether earnings growth driven by the
margin improvement is sufficient to continue to support this
outperformance without revenue growth.
We would focus on software names with a proven business
model, strong product cycle and a large installed base.
term as it will damage the quality of the service and could go
A trend in software is the further move to Linux. Surveys
back up to the long term historical rate around 16%. The low
indicate that nearly 45% of global companies have migrated
demand from telco operators and the overcapacity of the
select applications to Linux, with only 3% expressing
telecom equipment suppliers leads to price erosion.
dissatisfaction.Although that this will not accelerate until there’s
sufficient enterprise level support.
Hardware
A clear trend in the hardware area is the move to more modular
IT Services
systems in servers and storage which results in lower average
15 We remain cautious for IT services stocks, especially in
selling prices.This will put pressure on hardware revenue growth
Europe for several reasons.
for server and storage companies. CIO’s and IT managers are
Several surveys and IT companies indicate that the pricing is still
increasingly moving their applications to lower cost modular
highly competitive and discounts aren’t disappearing. End
architectures and realizing significant cost savings.
demand is still weak, especially in consulting, as CIO’s still expect
Software
14 A close correlation between GDP growth and IT software
spend has historically caused software stocks to lead technology
stocks into a recovery.
to spend less on external IT services.
IT Services companies face more competition from offshore IT
services companies (India, China and Eastern Europe). Clients
outsource mainly
IT application developments to these
There remains a big uncertainty regarding the IT spending
countries in order to lower the cost. This trend will further
environment. But, whereas in 2002 the risk was clearly on the
increase as security issues are resolved.
11
Global Telecom Capex Forecast
2003E: $156 billlion
-7% decline
300
250
200
150
100
50
0
2000
2001E
2002E
2003E
-5%
-31%
-7%
0%
167,2
156,1
156,7
Growth %
2004E
Total
252,4
240,6
Row
18,3
20,6
90
7,4
8,2
Asa (ind Japan)
67,4
67,3
60,2
56,6
54,0
Europe
N. Amerika
53,3
49,1
41,3
43,6
42,2
113,3
103,7
56,7
48,5
52,3
23
Source: UBS estimates
Global communication equipment
200000
180000
160000
140000
120000
100000
80000
60000
40000
20000
0
2003E: $103 billlion
-7% decline
1998
4%
130,168
40,043
90,426
6
Growth %
Total
Wireless Equp.
Wireline Equip.
13
1999
12%
145,536
43,937
101,699
2000
27%
184,834
53,949
130,885
2001
-18%
151,960
53,128
98,833
2002E
-27%
110,177
43,092
67,085
2003E
-7%
102,594
39,697
62,897
2003E
10%
440
21
164
28
85
34
109
2004E
10%
484
23
183
34
89
39
117
2005E
10%
533
26
199
41
93
45
128
Global mobile handset forecast
2003E: 440m units
10% growth
500
400
300
200
100
0
2000
50%
408
18
132
32
69
17
140
0
Growth %
Total
Row
Asis Pac.
Latin Amer.
North Amer.
Eastern Eur.
Western Eur.
14
2001
4%
390
21
134
30
82
24
99
2002E
3%
400
19
147
27
81
17
98
Relationship of US GDP growth versus
Equipment/software spend 1989-2003
5%
15%
4%
10%
3%
5%
2%
-1%
Mar 03
Mar-03
Sep-01
Mar-00
Sep-98
Sep-95
Mar-94
Sep-92
Mar-91
S 89
Sep-89
0%
Mar-97
GDP
Equ
Equip/Software
1%
Source: Bloomberg, Citigroup
15
Global IT Spending forecast
3000000
2500000
2003E: $2,3 trillion
6% growth
2000000
1500000
1000000
500000
0
Growth %
Total
Row
Latin Amer.
APAC
Japan
AI Europe
US/Canada
2000
2,234,920
73,117
137,428
241,400
249,801
633,488
899,685
5
2001
-1%
2,219,400
71,500
130,900
246,000
242,500
645,000
883,500
2002E
0%
2,214,900
77,800
127,700
249,400
237,200
548,200
874,500
2003E
6%
2,344,100
84,700
135,800
269,900
246,700
684,200
922,800
2004E
7%
2,497,600
91,800
147,800
293,400
258,800
720,600
985,200
2005E
6%
2,657,500
99,700
161,900
317,700
270,500
762,700
1,045,000
Quest for Growth 2002-2003
12
Quest for Growth 2002-2003
24
Biotech
available for investment to be split across national boundaries.
16 In both the Public and private sectors the past year has been
Each country will have local funds to invest in local companies.
a tough time for the life sciences sector. Investment has been
This allows a degree of protection to companies who may have
slow and down upon the boom years of 1999-2000. However
weaker business plans or management but are listed on stronger
2003 seems to be slowly showing signs of recovery with venture
markets.The rise and fall of regional technology markets such as
capital investment set to rise over 2002, the possibility of the
Easdaq (Nasdaq Europe), Neuer Markt has left companies that
IPO window slowly opening and total cash invested substantially
used to be big fish in small ponds and able to attract market
increased.
specific investment struggling to compete in full markets. A
continual suggestion to ease these problems is for the creation
The world stock markets have been going through the largest
of one European wide technology market to rival the US
bear market since biotechnology developed as a unique sector.
Nasdaq, currently this remains a pipedream and management
Therefore a lot of the downward price pressures are not
should be creating business plans to work with in the current
inherent to the industry. Add to that concerns about the world
markets. Switching to the US Nasdaq, although superficially
economy, possible military conflicts etc. Then it is natural for
attractive has yet to be shown to work with the large US
investors to retreat to what may be regarded as more secure
biotechnology funds still keeping a primarily US investment
sectors to place their dwindling cash. Many non-specialist
portfolio, and therefore most European companies usually
investors see the biotechnology sector as a high-risk, high-
significantly underperforming their US peers.
reward investment, and as such no place to be when the markets
are in decline. However the current status of the European
biotechnology markets has a real and direct bearing on the
willingness of investors to invest.
17 The current low levels of trading in the majority of
biotechnology stocks will deter all but the most specialist or
long term funds.An important question is why is the liquidity so
During the bubble market of 1999-2000 a great many companies
were able to take advantage of the desire of investment funds to
participate in what was seen as an exciting time in the
biotechnology sector. Private companies achieved fund raisings at
(with hindsight) grossly inflated valuations for their particular stage
of development or to raise substantial cash via a very high priced
low? In principle, in bear markets investors will shy away from
offering on public markets (LSE, Neuer Markt, Easdaq/ Nasdaq
cash burning companies that are not in a near cash neutral/
Europe). This has created several knock on problems with the
profitable situation, this covers the majority of European
current market and helped to create the current IPO blockage.
biotechnology stocks.
19 Many companies are now trading below their cash value. This
18 Additionally Europe still has a very parochial market
means that some companies have an apparent negative technology
structure for technology companies. The presence of several
value, while this may be justified in some cases it is clearly
national markets for technology stocks leads to the total sum
unwarranted in others.
16
Investment in the life scienes industry 1999-2003
25000
1999
2000
2001
2002
2003 Y TD
2003e
20000
15000
10000
25
5000
Quest for Growth 2002-2003
0
17
Profitable European
Biotechnology Companies
Country
Acambis
Celltech
Galen
PowderJect
Shire
SkyePharma
Qiagen
Serono
UK
UK
UK
UK
UK
UK
Germany
Switzerland
The consequences of the previous inflated market is that
there are many companies in the small to mid cap range
that may have the cash to drive their business, but not to
take the business to profitability. These companies are
18
Region
now sitting below their IPO price often with an overhang
USA
Europe
of VC funds as shareholders. Investors will know that
NASDAQ, NYSE
London: FTSE,AIM
Benelux: Euronext, National Bourse
Germany: Dax, previously Neuer Markt
Italy:
Milan;
France:
Paris, Neuvo Marche
Other national Exchanges, ie Swiss, Swedish
these shareholders will be looking for an exit and this
further depresses the valuation and liquidity. Further these
quoted companies are now trading at values lower than
the last financing rounds of several of the leading private
companies who can not go to the public markets at their
current valuations. Until there is a major rise in quoted
19
biotechnology valuations these companies will remain
private and burning cash.The crunch is already being felt,
private companies that are delivering performance and
controlling costs will still have to return to the private
markets to raise cash at discounts to their last rounds.
This should not be seen as a sign of failure but of
European Biotechnology
Companies with
cash > Market cap
Country
British Biotech
Oxford GlycoSciences
Crucell
GPC Biotech
UK
UK
Netherlands
Germany
management and shareholder realism. Discounted cash
raising may place the company in the pole position for an
IPO when the window reopens, as well as attracting new
20
4952
5000
Sales (€m)
later stage investors, such as crossover funds and
investment banks.
20 Finally what the life sciences sector has to deliver to
Profit (€m)
4000
3620
3000
2829
ensure a sustained market recover is the transformation
from an industry with high potential to an industry
2325
2000
capable of generating sustained profits. However, as
figure 20 illustrates, in 2003 the industry is likely to start
1964
1940
1747
1660
1015
1000
to show the profit levels that will attract investors back
into the sector thus restoring confidence, liquidity and
opening the IPO window again.
551
0
17
129
1999
2000
151
2001
276
2002
2003
2004
2005
PORTFOLIO
PORTFOLIO
Quest for Growth 2002-2003
26
Portfolio composition at June 30th, 2003
Belgium
4%
US
27%
Denmark
1%
Finland
3%
France
11%
United
Kingdom
14%
Germany
12%
Switzerland
5%
Sweden
2%
Spain
4%
Netherlands
11%
Norway
3%
Portugal
3%
Distribution of the invested part of the portfolio by country
Cash + Other Net
Assets
32%
Commitments
3%
Electr. & Hardware
6%
IT Services
4%
Pharma & Biotech
13%
Nasdaq Tracker
11%
Telecom & Equipment
12%
Semiconduct. &
Equipment
14%
Software
5%
Distribution of the portfolio by sector
Nasdaq
18%
Nasdaq Europe
3%
Swiss Stock
Exchange
5%
Oslo
2%
Helsinki
3%
Stockholm
2%
Quoted - Unquoted
12%
Unquoted
4%
Venture Funds
9%
Madrid
4%
London
12%
Euronext Paris
4%
Euronext
Amsterdam
7%
Euro NM Germany
12%
Convertible Loan
Notes
3%
Distribution of the invested part of the portfolio by stock market
Holdings at June 30th, 2003
COMPANY
Quoted companies
ARTWORK SYSTEMS
BUSINESS OBJECTS
PSI
VMETRO
SECTOR /
MARKET
NUMBER OF
SHARES
CHANGE
SINCE
30/06/02
CURRENCY
SHARE PRICE
VALUATION
IN €
IN % OF
NET ASSET
VALUE
€
$
€
NOK
2.5000
21.8600
4.2500
19.5000
242,500
573,904
403,750
470,248
0.52%
1.24%
0.87%
1.02%
NASDAQ-100 TRUST
Nasdaq
Unquoted companies
ANGIOSONICS
ENDPOINTS INC.
EQUATOR
GALILEO
MAMUT ASA
NASDAQ Europe
OMRIX
OXAGEN Ltd.
PAGOO
PHYTERA
Pharma & Biotech
Semiconduct. & Equipment
Electr. & Hardware
Pharma & Biotech
Software
Software
Pharma & Biotech
Pharma & Biotech
IT Services
Pharma & Biotech
3,125,000
307,692
1,025,642
82,464
800,000
922
85,417
357,145
303,559
330,033
Convertible loan notes
ENDPOINTS Convertible
OMRIX Convertible
PHYTERA Convertible
Semiconduct. & Equipment
Pharma & Biotech
Pharma & Biotech
Face Value
150,000
2,350,000
250,000
$
$
$
0
0
0
0.00%
0.00%
0.00%
Warrants
OMRIX Warrant
Pharma & Biotech
80,078
$
0
0.00%
Options
OMRIX Options
Pharma & Biotech
16,667
$
0
0.00%
2.34%
Venture Funds
KIWI I VENTURA SERVICOS
NETFUND EUROPE
SCHRODER VENTURES LSF II
VENTECH CAPITAL 2
Telecom & Equipment
Software
Pharma & Biotech
IT Services
Last valuation at (2)
31/03/2003
31/12/2002
31/03/2003
31/03/2003
770,217
176,138
1,273,550
636,350
1.67%
0.38%
2.76%
1.38%
6.19%
Total invested
30,181,974
65.30%
15,217,000
32.92%
824,401
1.78%
46,223,375
100.00%
DANIONICS (1)
LOGITECH
MEDION
SINGULUS
INDRA SISTEMAS
ACAMBIS
CRUCELL (1)
SKYEPHARMA
TANOX (1)
ARC INTERNATIONAL (1)
ASM International
ASM Lithography
INFINEON
JENOPTIK
MICRONAS
SOITEC
SOITEC Convertible
97,000
30,000
95,000
200,000
10,000
-10,000
131,111
15,000
23,000
75,000
7,500
23,000
30,000
DKK
CHF
€
€
14.0000
50.8000
37.8600
15.0800
247,050
490,221
870,780
1,131,000
0.53%
1.06%
1.88%
2.45%
140,000
140,000
€
8.8500
1,239,000
2.68%
60,000
562,500
1,000,000
120,000
60,000
£
€
£
$
3.6500
2.5000
0.6950
16.0100
315,926
1,406,250
1,002,597
1,681,281
0.68%
3.04%
2.17%
3.64%
£
€
€
€
€
CHF
€
€
0.2225
13.1000
8.2700
8.4200
11.2000
27.3000
5.2000
19.6000
285,308
1,198,650
827,000
842,000
448,806
965,968
1,219,691
784,000
0.62%
2.59%
1.79%
1.82%
0.97%
2.09%
2.64%
1.70%
£
SEK
€
$
£
0.6250
8.6000
14.3400
2.7500
1.1850
1,127,020
743,880
788,700
747,989
1,210,912
2.44%
1.61%
1.71%
1.62%
2.62%
$
29.9500
4,979,872
10.77%
56.77%
$
$
$
$
NOK
€
$
£
$
$
0
0
0.1112
0.5843
6.0000
0
0
0.7000
0
0
0
0
99,834
42,168
578,767
0
0
360,646
0
0
0.00%
0.00%
0.22%
0.09%
1.25%
0.00%
0.00%
0.78%
0.00%
0.00%
888,880
91,500
100,000
100,000
40,072
55,000
234,556
40,000
1,000,000
67,750
100,000
45,000
40,072
55,000
234,556
1,250,000
800,000
55,000
310,810
708,358
250,000
800,000
55,000
190,000
190,000
Invested Capital
168,765
700,000
1,900,001
900,000
8,358
82,464
148,812
-745,761
-45,566
200,000
200,000
€
€
$
€
Cash
Other net assets (3)
TOTAL
(1)ARC, Crucell, Danionics and Tanox are quoted companies, but are considered as unquoted companies for the privak investment restrictions according to article 47 of the Royal Decree of 1997.
(2)Valuation based on the last report of the directors of the Venture Fund.
(3)Other net assets include formation expenses, unsettled trades, amounts receivable, amounts payable, deferred charges and accrued income, accrued charges and deferred income.
A list of all transactions during the year is available on request from the company’s offices.
27
Quest for Growth 2002-2003
COLT TELECOM
ERICSSON
NOKIA
OPTION
VODAFONE
Software
Nasdaq Europe
Nasdaq
Euro NM Germany
Oslo
Electr. & Hardware
Copenhagen
Switzerland
Euro NM Germany
Euro NM Germany
IT Services
Madrid
Pharma & Biotech
London
Euronext Amsterdam
London
Nasdaq
Semiconduct. & Equipment
London
Euronext Amsterdam
Euronext Amsterdam
Euro NM Germany
Euro NM Germany
Switzerland
Euronext Paris
Euronext Paris
Telecom & Equipment
London
Stockholm
Helsinki
Nasdaq Europe
London
Company profiles
Company profiles
Quest for Growth 2002-2003
28
Unquoted companies
ANGIOSONICS INC. is a medical device company developing the use of ultrasound as a
means of treating a range of conditions. Currently the company is undergoing a major
restructuring.
ENDPOINTS, INC. is a U.S. based fabless semiconductor company focused on the design,
development and marketing of semiconductors for imaging products. EndPoints’ chips are used
in mass-market products such as digital video and still cameras that capture and display digital
images and communicate them across the Internet and other networks. Because of the
persisting weak economy, EndPoints has difficulty reaching suitable sales levels and generating
enough cash.The company is currently undergoing a major restructuring.
EQUATOR TECHNOLOGIES INC., founded in 1996, is a U.S. based privately held fabless
semiconductor company. Equator Technologies provides high performance, programmable,
power efficient System-on-a-chip (SoC) processors designed for video streaming and image
processing applications across a wide range of consumer and enterprise end markets. In March
2003, Equator has secured another $ 11 million in financing, which should carry the company
through to profitability in 2004 and help fund the continued development of the next generation
of Equator’s BSP silicon family, enabling the company to take advantage of expanding
opportunities in the digital media and security spaces.
GALILEO PHARMACEUTICALS, INC. is a California based biotechnology company
focused on developing drugs that target redox signaling pathways. GalileoPharma has built
a comprehensive drug discovery platform based upon three primary proprietary assets -a cellular system that faithfully models cellular energy metabolism, a vast library of
unexploited oxidoreductase-targeting compounds, and a powerful characterization
approach involving advanced charge transfer chemistry. In April 2003, the company has
closed a $31 million financing through a preferred stock offering.
MAMUT ASA is a provider of CRM and Internet solutions to small and medium sized
businesses. The company, which was founded in 1995, is today represented in different
countries in Europe and has 130 employees working at its headquarters in Oslo, Norway.
Mamut is well positioned in an increasingly consolidating and price-conscious market. It
uses a consumer marketing approach with a direct sales model and an aggressive pricing
strategy. More than 75,000 customers currently use Mamut software.
NASDAQ EUROPE, which is a subsidiary of The Nasdaq Stock Market, Inc was
designed as a pan-European stock exchange. On June 26th, 2003, the shareholders of
Nasdaq Europe voted to discontinue operations of the market. An orderly wind down will
be conducted pursuant to a transition plan to be agreed with the Belgian Banking and
Finance Commission. Completion is expected no later than January 5, 2004.
Nasdaq Europe remains a 50% shareholder of Nasdaq Deutschland.
OMRIX BIOPHARMACEUTICALS INC., headquartered in Brussels, is a marketing stage
biotechnology company that develops and markets a unique surgical sealant, as well as a suite of
immunology and hemophilia products.The company currently sells its products in Israel, Latin
America and most European countries. Expansion into other markets is ongoing. In March 2003,
Omrix received approval from the U.S. FDA to sell Omrix first all-human derived fibrin sealant
available in the U.S. for use in liver surgery.The American Red Cross will market and distribute
the product in the U.S. under agreement with Omrix.
29
genetic analysis on collections of family samples so as to understand the mechanisms and
causes of common diseases. Their products are information and patents relating to new
drug targets or diagnostic markers, which will enable better treatment of these diseases.
Oxagen currently has collaborative agreements with a range of pharmaceutical companies
including Astra Zeneca and Pfizer.
PAGOO INC. is a U.S. based developer of Internet voice technologies, currently offering two
Internet services direct to the consumer - Internet Call Waiting and Virtual Calling Cards.When
you are connected to the Internet, Pagoo picks up and records callers' voice messages just like
an answering machine. As soon as a message is recorded, you are notified immediately and can
listen to it on your computer, without getting off-line. In view of the difficult market conditions,
Pagoo is currently going through a significant restructuring exercise.
PHYTERA is a plant based genomics company active in the discovery and development
of novel pharmaceutical and agricultural products from nature using combinatorial
biology. Phytera has assembled a diverse collection of plant species in culture and has
industrialised their growth and manipulation in the laboratory. Phytera has sold its main
technology platform assets to Galileo Pharmaceuticals from which Quest for Growth has
received equity and which is now is acting as a holding company for the residual assets.
Venture capital funds
KIWI VENTURA SERVIÇOS S.A. is a EUR 110 million investment fund advised by Pino
Venture Partners of Milan. Kiwi has made equity investments in early stage companies providing
products and services in telecommunications, new media and information technology in
Europe, with a major focus on Italy. The most significant of its investments to date has been
Tiscali, an Italian ISP, which was subsequently floated on the Milan Stock Exchange in October
1999. The Kiwi I fund is currently fully invested, and its management is focusing on the
operations of portfolio companies and implementing exit strategies. Currently, Kiwi still has a
portfolio of investments in 11 independent, active companies (i.e. excluding inactive or written
off companies and excluding exits), reduced from the peak of 52 initiatives.
MITISKA NETFUND EUROPE is a European early-stage venture capital fund that
exclusively invests in European internet related companies.The fund was founded in April
1999 by Mitiska, its committed capital amounts to EUR 71.5 million. Given the state of the
internet related sector, the fund had to take substantial write-offs for many of its
investments. The management currently focuses on implementing exit strategies for its
existing portfolio companies and doesn’t consider new investments.
SCHRODER VENTURES INTERNATIONAL LIFE SCIENCES FUND II (ILSF II)
makes equity or near equity investments in life sciences companies principally in the USA
and Europe. "Life Sciences" is defined to include biotechnology, pharmaceuticals, clinical
diagnostics, medical devices and instruments, medical electronics, healthcare products and
services, agricultural biotechnology and environmental applications.
The fund is in its fourth year of activity and has made 36 investments to date. As of 31
December 2002, the fund portfolio consists of four publicly traded companies and 28
private companies.
Quest for Growth 2002-2003
OXAGEN is a genomics company with a broad technology base, performing large-scale
Quest for Growth 2002-2003
30
VENTECH CAPITAL 2 is a EUR 112 million French venture fund based in Paris, active
since July 2000.Ventech II is an early stage investor, investing in technology and life sciences
companies, either in the process of being formed or recently started up.Ventech invests in
the information technology sector, with a particular emphasis on new-generation networks,
software applications, online activities, the Internet and mobile telephony, and in services,
commerce and the media. In the life sciences sector, they have a particular focus on applied
genomics.Ventech Capital 2 is 37% invested in monetary terms.The fund has 14 portfolio
companies in ICT and 3 portfolio companies in Life Sciences as of March 31, 2003.
Quoted companies
ACAMBIS is a biotechnology company discovering, developing and manufacturing novel
vaccines to prevent and treat infectious diseases. It is based in Cambridge, UK and
Cambridge, Massachusetts, USA.
Recognised internationally as the leading producer of smallpox vaccines,Acambis provides
governments around the world with the full portfolio of related smallpox vaccine products
required to protect their citizens against the threat of smallpox virus being used as a
bioterrorist weapon.
Acambis is establishing a travel vaccines franchise, including vaccines against yellow fever,
Japanese encephalitis, dengue fever and typhoid.
It also has the most advanced vaccine in development targeting the West Nile virus, which
has spread to over 40 US States in the last three years.
ASM INTERNATIONAL (ASMI) is a leading supplier of equipment for both the front
end wafer fab and back end assembly segments of the semiconductor market. The
company is the only major semiconductor capital equipment manufacturer to participate
in both markets.We believe the company’s broad product and service offerings position it
well to participate in future growth of both markets while reducing its exposure to
volatility in either market. ASMI’s back end business is managed through its 55%-owned
subsidiary, ASM Pacific Technology (ASMPT) Limited, with principal operations in Hong
Kong, Singapore and China. ASMPT is a Cayman Islands limited liability company that is
based in Hong Kong and listed on the Hong Kong Stock Exchange.
ASML is a world leader in the manufacturing of advanced technology systems for the
semiconductor industry. The company offers an integrated portfolio for manufacturing
complex integrated circuits (also called ICs or chips).
ASML designs, develops, integrates, markets and services advanced systems used by
customers – the major global semiconductor manufacturers – to create chips that power
a wide array of electronic, communications and information technology products. Its
technology is supported by process solutions, enabling customers to gain and sustain a
competitive edge in the marketplace.
ASML’s corporate headquarters is in Veldhoven, the Netherlands. Manufacturing sites and
research and development facilities are located in Connecticut, California and the
Netherlands. Technology development centers and training facilities are located in Japan,
Korea, the Netherlands,Taiwan and the United States. Additionally, ASML provides optimal
service to its customers via over 50 sales and service organizations in 16 countries.
31
of intellectual property capable of being customised and embedded into Systems-on-Chip
designs. One distinctive feature of its processors (sold under the brand name Tangent) is
that they are ‘soft cores’, thus customers can choose to implement only parts of the
processor to save on costs or extend functionality in particular ways to tune performance
for specific tasks. Arc’s recourses span many areas within the embedded systems world –
not just processor intellectual property, but development tools (such as compiler)
support and interface software development. The embedded processor marketplace
cleaves into CISC (complex instruction set processors e.g. Intel processors) and RISC
(reduced instruction set processors e.g. ARM Holdings processors). The appropriate
choice of processor depends on the target application, although engineers may develop
irrational loyalty towards specific designs.
ARTWORK SYSTEMS develops software for the preparation of professional color
printing or pre-press.Artwork Systems' software runs on personal computers but equals
or even betters the quality and productivity of specialised and much more expensive
integrated computer systems.The strategy is to extend its current leading position in the
packaging and labeling market, which is a fast growing niche market, and to become the
market leader in the global software pre-press market. Therefore, Artwork Systems
released new products such as Nexus, which is an open and modular software solution,
and they acquired Enfocus. Enfocus designs tools to extend the basic features of PDF. The
software, integrated in the Acrobat applications, enables customers to adapt the content
of a PDF-file.
BUSINESS OBJECTS is a leading player in business intelligence (BI) and recognised
leader in the 'query and reporting' segment. A high ROI, low unit price and the massadoption of BI within organisations has sustained market growth.The accretive acquisition
of Crystal Decisions - market leader in enterprise reporting products - was proposed in
July 2003. Expected to close in Q4 03, this will add scale and open cross-selling
opportunities. Integration risks are heightened by the fact that Business Objects is
beginning a major upgrade cycle, with Enterprise 6.0. Competitors include Cognos,
Hyperion and Informatica.
COLT TELECOM is one of the new competitive telecommunications companies
operating in Europe. Founded in 1992, COLT operates an integrated IP based panEuropean network linking the financial and business centers of Europe, providing the full
range of telecommunications services to high value corporate and carrier customers. Colt
is a competitive telecommunications provider operating in 27 cities. The company has
metro fibre networks in all 27 cities and is constructing a pan-European long-haul fibre
network. In addition, COLT has 13 web-hosting facilities. COLT offers voice, data, hosting
and Internet services to enterprises and other carriers.
Quest for Growth 2002-2003
ARC INTERNATIONAL develops and supplies microprocessors, shipped in the form
Quest for Growth 2002-2003
32
CRUCELL discovers and develops biopharmaceuticals that use the human immune system
to combat cancer, infectious diseases and other conditions. Crucell leverages its patented
technologies, MAbstractTM, AdVacTM, and PER.C6TM, for discovery, development and
production of antibodies and vaccines. Crucell offers its technologies to the pharmaceutical
and biotechnology industry and also uses them to create its own product pipeline. Partners
include Merck & Co. for the HIV vaccine, the National Institutes of Health (NIH) for the
Ebola vaccine and Centocor, a Johnson & Johnson company, for the CD46 antibody for
treatment of various types of cancer. In addition, Crucell has over 20 licensees for its
PER.C6TM technology. These include Novartis, GSK, Aventis and Schering AG. With
headquarters in Leiden,The Netherlands, the company currently employs 200 people.
DANIONICS, which is headquartered in Odense, Denmark, commenced its present
activities in January 1994 with the aim of developing a new generation of batteries and
super capacitors for commercial application in the portable electronics industries. The
Company aims specifically at the battery markets for notebook computers, mobile
telephones and handheld devices (such as PDAs and palmtop computers), all market
segments experiencing significant growth and demanding advanced battery technologies.
The batteries are based on the lithium-ion polymer technology, where the Company has
developed its own proprietary technology in the field of lithium-ion polymer taking the
lithium-ion technology to the next level.The Company has also acquired an extensive and
unique manufacturing know-how.
ERICSSON is the largest supplier of mobile systems in the world.The world’s 10 largest
mobile operators are among Ericsson’s customers and some 40% of all mobile calls are
made through Ericsson systems.
Ericsson provides total solutions covering everything from systems and applications to
services and core technology for mobile handsets.With Sony Ericsson we also are a top
supplier of complete mobile multi-media products.
Ericsson has been active worldwide since 1876 and the company has today around 61.000
employees in more than 140 countries.The headquarters is located in Stockholm, Sweden
Listed in March 1999, after the Spanish government sold its 66% stake, INDRA is among
Spain’s leading IT services providers with an estimated market share of c15%.Within the IT
business, Indra specialises mainly in system integration. Most recently, the company has
started an incipient Internet business. Other activities provided by the company include
the manufacturing of simulation and automatic testing systems and the design,
development and manufacturing of electronic defence systems.
INFINEON is the world’s third-largest DRAM vendor and top-10 semiconductor
manufacturer. Infineon has four operating divisions which focus on Memory
Semiconductors, Wireline Communications, Wireless Communications (including
Smartcards and Security Chip Cards), and Automotive and Industrial. Its largest customers
are Siemens (15% of sales) and Nokia (<10%).
33
through comprehensive restructuring action, as well as several acquisitions and disposals.
Today, Jenoptik is focused on two major business areas: Clean Systems – which comprises
facility engineering and management – and Photonics, which is a high-tech electro optic and
mechanical systems business. Clean Systems remains the most important division of the
group but contributes a disproportionately low share to group profitability only because of
its engineering character and inflated sales level (sub-contracting).
LOGITECH sells desktop peripherals to both the OEM (10-20%) and retail (80-90%) channel
segments. It product portfolio spans pointing devices, video/still web cameras, gaming devices,
keyboards, and the audio and mobile accessory markets. Logitech has successfully innovated
with cordless technology and built a brand image facilitating premium pricing. In addition,
management has successfully executed its expansion programme over the last two years with
regard to production, logistics and distribution. Overall, Logitech remains a best-in-breed player
within the PC desktop peripherals segment.
MEDION is a recognized leader in multimedia computing and consumer electronics in
Europe. The Company supports retailers and manufacturers in selective sales campaigns
involving products from the fields of PC/multimedia, entertainment/household electronics
and communications technology.
In terms of product groups, Medion focuses on three areas: PC/multimedia (PCs, notebooks,
scanners, printers, modems, software, plug'n'play offers), entertainment/household electronics
(electric appliances for personal care, home equipment, TVs, DVD-players, VCRs, HiFi, MDplayers, cameras and video cameras) and communications technology (telephones, answering
machines, fax machines, decoders, SAT-systems).
The assortment of these product groups is continuously extended and adapted to meet
the latest technical and design developments. In this context the most favorable pricequality relation possible for each product plays a key role. In its product design Medion
pursues a "best value" concept in order to keep up with the consumer trends to buy highquality, yet inexpensive articles in order to satisfy buyers who make purchase decisions
based on price and those interested in innovations and high quality.
MICRONAS SEMICONDUCTOR HOLDING AG is a semiconductor company
with headquarters in Zurich and worldwide operations.
At its locations in Germany (Freiburg and Munich) and Austria (Villach), the company
develops microchips – integrated circuits (ICs) and sensors.With its in-house marketing,
sales, and application support network, Micronas is present where the markets are – in
Germany (Freiburg, Munich, and Nuremberg), China, Japan, Korea, Malaysia, Singapore,
South Europe,Taiwan, United Kingdom, and in the US.
Micronas ICs are mainly used for the consumer electronics (TV, video, and radio
equipment), multimedia, and automotive electronics industries. The company has
established a strong market position in promising, high-growth semiconductor
applications for these sectors. The products are specifically tailored to industry and
customer needs.
Quest for Growth 2002-2003
After German reunification, JENOPTIK developed from state-owned VEB Carl Zeiss Jena
Quest for Growth 2002-2003
34
NOKIA, based in Finland, is a leading manufacturer of mobile communication
technologies. The company holds the number one position in terms of share of global
mobile handsets shipped, and has a strong position in the GSM, GPRS, EDGE and WCDMA infrastructure markets. Nokia is also a leading developer of enabling mobile
technologies, such as location-based services and Bluetooth, one of the major shortdistance wireless communication standards.
OPTION, founded in 1986, operates in the fast growing mobile data communications business.
Option is specialised in designing and developing miniaturised mobile voice and data
communications solutions for users of portable computers, PDA’s (Personal Digital Assistants)
and hand-held organisers. Option has R&D centers in Leuven (Belgium) and Cambridge (UK), a
software centre in Adelsried (Germany) and a manufacturing facility in Cork (Ireland). Option
has designed, developed and produced a tri-band GSM/GPRS adaptor module for the Compaq
iPAQ PDA to provide users with wireless voice and date connectivity. Option’s main product is
the Globetrotter card, which is delivered to 20 mobile operators.
PSI develops complete software solutions in the area known as Resource Management. In
the newly deregulated energy sector, PSI is market leader in the development of software
for energy management systems. Their systems control and monitor the generation,
transportation, and distribution of energy - in the forms of electricity, oil & gas. As market
leader in Germany, PSI provides logistics solutions for the metal, chemical and printing
industries. Its services range from production control to storage and transportation
systems and in the optimisation of business processes. For the small to mid-sized discrete
manufacturing companies, PSI has developed the ERP software PSIPENTA, which
distinguishes itself by possessing groundbreaking technology and object oriented
architecture. This enables the user to quickly adopt the product and to implement the
processes of change without causing major disruptions to their workflow.
SKYEPHARMA’S technologies are designed to improve the safety and efficacy of existing
drugs.Applying its controlled release technologies to pharmaceutical products in the areas of
oncology, neurology, dermatology, pain management and asthma, SkyePharma enhances the
release profile of a client’s drug. Moreover, reducing the frequency of administration of a drug
through delivery technology can often mean lower side effects and greater patient
compliance, both of which can lead to the patient getting better – faster.
By developing its inhalation, oral, injectable, topical and enhanced solubility (nanoparticulate) drug delivery platforms, SkyePharma has assembled a broad platform on which
to target multiple therapeutic areas and global markets.
SINGULUS develops, manufactures and sells installations used in the production of
optical storage media. The company is one of the leading providers of high quality and
cost-effective systems for making Compact Disc (CD) and Digital Versatile Disc (DVD)
formats. Singulus offers completely integrated production lines and metallising
installations, which represent a key area for CD and DVD production. Apart from these
products which are very established on the market, the company has recently successfully
completed development work on its new production line SUNLINE for re-writable discs
(CD-RW and DVD-RW as well as DVD RAM formats).
35
derivative of SOI (Silicon-On-Insulator) technologies. Smart-Cut improves on traditional
silicon's intrinsic properties. It increases speed by 20-100% and reduces energy
consumption by 25-75%. Soitec has an 80% share of the SOI market. In their search for
sufficiently powerful and economical substances to satisfy the demands of new
applications such as 3G mobile handsets, PDAs and portable computers, some industry
majors, including Philips, IBM and Honeywell, have already included SOI in their business
plans. Confirming the positive market trend. Soitec's technology has been warmly received
by the majors in the industry, such as IBM and STMicroelectronics, and the French
company is building a customer base made up of several first-tier names.
TANOX is focused on the discovery and development of therapeutic products in the
area of immunology (asthma/allergy, autoimmune diseases), infectious diseases and
oncology.The company’s lead candidate is Xolair, an anti-IgE antibody for the treatment
of moderate to severe allergic asthma and allergic rhinitis. In the middle of 2001 Tanox’s
partners, Genentech and Novartis announced that the FDA requested additional
preclinical and clinical data analyses, as well as pharmacokinetic information. In
November 2001, Genentech and Novartis announced plans to submit an amendment to
the Biologics License Application (BLA) for Xolair to the FDA in the fourth quarter of
2002. Given a fourth-quarter filing, we could expect FDA approval of Xolair as early as
the fourth quarter of 2003.
VMETRO provides board-level products for high-performance embedded real-time
systems, with products based on open architectures.Two distinct product categories are
offered. (i) With the MIDAS (Modular Intelligent Data Acquisition Systems) family of
products Vmetro offers unique sensor I/O interfaces and Disk Array recording solutions
for radar/sonar/imaging/intelligence systems. (ii) Vmetro’s Bus Analysers offer unique
test and debugging capabilities for system integration and manufacturing.Vmetro’s main
customers are system integrators and OEMs in leading companies in the aerospace and
telecommunications industries as well as manufacturers of medical diagnostics and
seismic equipment.
VODAFONE, through the acquisitions of AirTouch in 1999 and Mannesmann in 2000,
has transformed itself into a global telecoms player.With a 45% stake in Verizon Wireless,
controlling stakes or 100% control in the UK, Germany, Italy, Spain and the Netherlands
(to name but a few), as well as a recently increased stake in J-Phone in Japan (an effective
60%),Vodafone is by far the leading global cellular operator.
Quest for Growth 2002-2003
SOITEC, based in Bernin, near Grenoble (France), owns a process called Smart-Cut, a
FINANCIAL DATA DATA
FINANCIAL
Quest for Growth 2002-2003
36
1. Balance sheet
ASSETS
2003
JUNE 30TH
€
2002
JUNE 30TH
€
30,736,693
42,596,048
554,719
573,324
30,181,974
42,022,724
Fixed Assets
Formation expenses
Financial assets
2003
2002
TH
JUNE 30
JUNE 30TH
€
€
LIABILITIES
Capital and Reserves
46,223,375
60,422,315
Issued capital
117,227,567
117,227,567
(71,004,191)
(56,805,252)
66,388
266,523
66,388
238,849
0
0
5,596
27,275
0
0
60,792
211,574
Profit /
Loss carried forward
Current Assets
15,553,070
Amounts receivable within one year
Term Deposits
18,092,790
1,830
38,921
15,217,000
17,459,065
240,650
179,511
Cash at Bank and in hand
Amounts payable
Amounts payable within 1 year
Financial debts
Trade debts
Taxes
Other amounts payable
Deferred charges and accrued income
TOTAL ASSETS
93,590
415,293
46,289,763
60,688,838
Accrued charges and deferred income
TOTAL LIABILITIES
0
27,674
46,289,763
60,688,838
2. Profit and loss account
2003
JUNE 30TH
€
2002
JUNE 30TH
€
2001
JUNE 30TH
€
2000
JUNE 30TH
€
(10,878,677)
(45,340,117)
(18,206,833)
60,462,882
Operating income and charges
Gross operating income
Depreciation and other amounts written off
Other operating charges
Operating profit / Loss
Financial income
Financial charges
Profit / Loss on ordinary activities before taxes
Income taxes
Profit / Loss for the period
(199,593)
(182,201)
(118,110)
(4,407)
(2,623,904)
(2,680,930)
(2,572,382)
(1,605,142)
(13,702,174)
(48,203,248)
(20,897,325)
58,853,333
1,191,970
694,714
2,629,872
1,217,971
(1,688,735)
(1,802,602)
(1,256,123)
(3,645,226)
(14,198,939)
(49,311,136)
(19,523,576)
56,426,078
0
0
0
0
(14,198,939)
(49,311,136)
(19,523,576)
56,426,078
37
2003
JUNE 30TH
€
2002
JUNE 30TH
€
2001
JUNE 30TH
€
2000
JUNE 30TH
€
1999
JUNE 30TH
€
(14,198,939)
(49,311,136)
(19,523,576)
56,426,078
3,126,851
Profit brought forward from previous periods (56,805,252)
(7,494,116)
12,029,460
20,105
3,126,851
Profit / Loss for the period
Profit available for distribution
56,446,183
Total dividend payments
44,416,723
3,106,746
12,029,460
20,105
Profit / Loss to be carried forward
(71,004,191)
(56,805,252)
(7,494,116)
4. Off balance sheet positions
COMMITMENT
CURRENCY
COMMITMENT IN €
99,999
$
87,511
270,483
€
€
1,100,000
Schroder Ventures International Life Sciences Fund II
NetFund Europe
Ventech Capital 2
1,100,000
270,483
5. Post balance sheet events
5.1. On July 18th, Quest for Growth invested GBP 250,000 in Futura Medical plc, a developer of medical and consumer
products for the sexual health market. The company listed on London’s Alternative Investment Market (AIM) on 22 July.
5.2. The company’s net asset value is below 50% of its subscribed capital. In accordance with article 633 of the Belgian Company
Code, the board of directors will convene an extraordinary general meeting of shareholders.
Quest for Growth 2002-2003
3. Profit distribution
Quest for Growth 2002-2003
38
6. Notes to the financial
statements
1. The conversion of foreign currencies to the Euro has been
done at the following rates in the balance sheet:
€ 1.00 =
$ 1.1427
£ 0.6932
NOK 8.2935
DKK 7.4299
8. In august 2002, Quest for Growth received $347,152 cash
from the partial liquidation of Pagoo. At first the new shares
of the remaining company were valued at its cash level.
Pagoo currently is still not making profit. It is expected that
either the company will be sold at a low valuation or will be
liquidated in the coming six months. Quest for Growth does
not expect to receive any material proceeds.
9. Phytera has sold its main platform to Galileo Laboratories
last year. In this transaction Quest for Growth was granted
57,865 shares of Galileo. Quest for Growth believes the
remaining assets of Phytera have no material value anymore
therefore the valuation remains at zero.
CHF 1.5544
SEK 9.2488
2. In December 2002 and May 2003 Quest for Growth
received dividends from Kiwi I Ventura Serviços Fund for the
total amount of € 71,602.93. For the remaining portfolio
(investments in 11 independent active companies) Quest for
Growth follows the valuation as determined by Pino
Ventures, directors of the fund, dated 31st March 2003.
3. The valuation of Schroder International Life Sciences Fund II was
reduced by 11.7 % based on the company’s financial statements
of 31st March 2003. A further $ 200,000 was drawn down from
existing commitments during the fiscal year.
4. The valuation of Netfund Europe was reduced by 38.5%
based on the company’s annual report of 31st December
2002. NetFund Europe is continued for the phasing out of
its portfolio.
10. Galileo Laboratories has closed a $ 30 mio fund raising in
which Quest for Growth has taken part for its pro rata
amount of $ 24,599 in order to avoid heavy dilution.
11. The investment in Mamut has experienced no change in
valuation. Differences are due to exchange rate fluctuations
of the NOK. The company is slowly growing.
12. Endpoints is basically insolvent, but tries to restructure its
debt. Quest for Growth doesn’t expect to get anything out
of a likely liquidation and therefore its valuation in Endpoints
was further reduced to zero.
13. Nasdaq Europe has started the wind down of its Nasdaq
Europe platform. The same is expected for Nasdaq
Deutschland in which Nasdaq Europe holds 50%. Quest for
Growth does not see any hope for recovery for Nasdaq
Europe. The company is valued at zero.
6. The investment in Angiosonics was reduced to zero value in the
previous fiscal year because the company has ceased trading and
the shares are not considered to have material value.
14. The investment in Omrix was valued at zero last year
because the company had difficulties to meet its business
plan, was running out of cash and had failed in an effort to
raise additional funds. Meanwhile, in October 2002 Omrix
closed a bridge financing. In March 2003 the company
received an FDA approval for their plasma fractionation and
manufacturing plant in Israel. If Omrix can keep its current
momentum Quest for Growth will consider a potential
increase in valuation.
7. Equator has closed a financing round of $ 11mio in March
2003 at a substantially lower valuation. Quest for Growth
did not participate, therefore its stake was diluted heavily
to €99,834.
15. The valuation of Oxagen Ltd did not change during the last
year. Differences are due to the exchange rate fluctuations of
the £.The company is still operating according to its original
business plan.
5. The valuation of Ventech Capital 2 was reduced by 23.4%
based on the company’s annual report of 31st March 2003.
Another €200,000 was drawn down from existing
commitments during the fiscal year.
39
17. Quest Management NV is paid a management fee of 2% (pro
rata temporis) on the subscribed capital. For the accounting
year ended June 30th 2003, € 2,344,551 was paid.
18. Dexia Bank acts as depositary bank for Quest for Growth.
The cost structure is as follows:
ASSET
COMMISSION
CLEARING FEE
PER
TRANSACTION
Quoted shares:
0.07 % per annum
€ 37.1840
Unquoted shares:
0.01 % per annum
Not applicable
Deposits and liquidity:
0.01 % per annum
Not applicable
22. Statement of the fixed assets (investment portfolio) in €:
ACQUISITION COST
At the end of the preceding period
69,349,894
Movements during the period
o Acquisition, including fixed assets
o Sales and disposals
54,374,172
(74,653,695)
o Transfers from one heading to another
At the end of the period
49,070,371
REVALUATION SURPLUSES
At the end of the preceding period
2,545,728
Movements during the period
o Recorded
o Reversals
(728,350)
o Transfers from one heading to another
At the end of the period
1,817,378
DEPRECIATION AND AMOUNTS WRITTEN DOWN
The above-mentioned commission is due quarterly at the end
of each quarter. Clearing fees are due at settlement date. No
other fees are due for the activity as depositary bank.
At the end of the preceding period
29,872,897
Movements during the period
o Recorded
The commission paid to Dexia Bank amounted to € 35,301
for this financial year.
19. No Remuneration was paid to other companies that have a
professional relationship with the statutory auditor.
o Written down after sales and disposals (9,167,123)
At the end of the period
20,705,775
FINANCIAL ASSETS AT THE END
OF THE PERIOD
30,181,974
20. Deferred charges and accrued income:
Transfer agents:
€0
Deferred charges:
€ 20,331
Accrued income:
€ 73,259
21.Accrued charges and deferred income:
Transfer agents:
€0
Accrued charges:
€0
23. Shareholders who have notified an interest of 5% or more in
the company:
Dexia Bank Belgium NV
Pachecolaan 44, 1000 Brussels, Belgium
431,911 shares, representing 7.97%
Quest for Growth 2002-2003
16. For certain transactions Quest for Growth has worked
through the intermediary of Dexia Bank, a strategic partner
of the company. As mentioned in the report of the
independent board members, these transactions were
concluded at market value.
Quest for Growth 2002-2003
40
7. Valuation rules
closing price is not a fair reflection of the market and another
Investments are valued in accordance with the Royal Decrees of
October 8, 1976 and March 8, 1994.These are treated as
collective investments with variable participation rights, in
accordance with the Royal Decree of April 18, 1997 covering
investments in non-quoted partnerships and growth companies.
Under these Decrees investments in financial instruments, which
are not quoted on a regulated market are initially valued at cost.
the reasons for the values it selects.
1. Investments in financial instruments of early stage
companies that are not quoted on a regulated
market.
value is justified, this value will be used.The Board will set out
c) Investments in other currencies are converted into Euro
at the Euro foreign exchange reference rates, procured
daily by the Central European Bank.
d) Equity Option Agreements are valued according to the rules set
for by the Belgian Commission For Accountancy Principles:
●
Option premiums are immediately taken into the
result of the current period;
Not applicable.
●
The option risk is covered by a provision that reflects
the value of the option (the option premium) at the
2. Investments in financial instruments of mature
companies which are not quoted on a regulated
market:
a) The investments are valued at cost.
end of the reporting period;
●
The option commitments of the options are reflected
off-balance;
●
The additional costs to option agreements are imme
diately deducted from the result of the current period;
b) The investment is revalued if there are sufficient objective
indications at hand, like (but not limited to)
● A significant third party transaction at a new value;
● Net assets that have clearly changed;
● Profit trends indicating a change in value.
c) The value shall be reduced when (but not limited to):
● Significantly less favorable results than foreseen
indicate a permanent decrease in value;
● There is a need for additional financing to avoid
settlement, judicial agreement or failing;
● A significant third party transaction at a new value has
been concluded.
●
When executed, the premium of an option agreement
is registered as a part of the purchase or selling price
of the underlying stocks.
e) In accordance with article 7 §2 of the Royal Decree of March
18, 1994, stocks and other financial instruments are booked
at cost.Additional costs are immediately deducted from the
result. Disposals of stocks and other financial instruments are
booked at their selling price. Additional costs are also
immediately deducted from the result.
f) Provisions are made for financial instruments that are
subject to lock-up provisions.
3. For financial instruments, which are quoted on a
regulated market:
a) Instruments traded on a regulated and liquid market: the
published closing price.
b) If these instruments are not traded on a regulated or liquid
market, and in the opinion of the Board of Directors, the
4. Formation costs are capitalised and written off over
5 years.
5. The costs of financial instruments are determined
by the weighted average prices of acquisition.
REPORT OF THE BOARD
REPORT OF THE BOARD
OFOFDIRECTORS
DIRECTORS
41
In accordance with the Law and the bylaws of the Company we
are pleased to report to you on the activities of Quest for
Growth NV and to present, for your approval, the annual
accounts for the year ending June 30th, 2003.
Activities
Quest for Growth NV was created as a privak in June 1998 with
the objective of providing individual and institutional investors
access to a range of investment opportunities relating to
European technology based growth companies. The Company
invests in quoted growth companies, participates in private
placements of potentially listed companies and is a limited
partner in certain venture funds.The daily management of Quest
for Growth NV is entrusted to Quest Management NV, a
company specialising in managing portfolios of emerging
technology growth companies.
The Privak structure provides you, the shareholders of Quest
for Growth NV. with a fully tax transparent treatment of your
investment and assures the highest quality standards in terms of
transparency and corporate governance.
The Board of Directors has delegated authority for investments
in quoted companies to Quest Management NV. Unquoted
investments are made following proposals from Quest
Management NV, which are approved by an Investment
Committee comprising five members of the Board of Quest for
Growth NV. Quest Management NV provides monthly reports
to the Board of Directors on all its activities and investment
performance. Quarterly and annual reports are available to
shareholders on request and also on the company’s web site
www.questforgrowth.com
Quoted companies are judged on their long-term growth
potential, the quality of the management and the sustainability of
their competitive position. Holdings in these companies are
increased or reduced on the basis of the judgement of the stock
market valuation by Quest Management NV. In choosing stocks
for investment, care is taken to ensure that the portfolio
remains diversified both by industry and by geography.
Investments in unquoted companies are based on similar criteria
to public companies with the additional condition that they
should have a reasonable chance of obtaining a public market
listing within 3 years from the date of Quest for Growth’s
investment (changed from 18 months in January 2003). In
practice, some companies may reach the public markets sooner
than this and others will inevitably require longer than expected.
Details of investments can be found in the Portfolio section of
the annual report.
Annual Accounts
For the accounting year ending on 30th June 2003 the company
had a net loss of € 14,198,939 (2002: a loss of
€ 49,311,136) or € 2.62 per share (2002: a loss of € 9.10 per
share).The gross operating income included realised net loss of
€ 40,023,223 and unrealised net gain of € 29,144,547. On 30th
June 2003 total assets were € 46,289,763 (2002:
€ 60,688,838) and the Net Asset Value per share stood at
€ 8.53 (2002: € 11.16).
The Quest for Growth share price at June 30th was €5.30 and
the 2005 warrant price was € 0.41
In accordance with article 96, 6° of the company code, the
Board of Directors expresses its intention to continue business,
notwithstanding the losses submitted over the last two
accounting years. These losses are the result of a consistent
application of our valuation rules that require a conservative
approach of the valuation of our investments in unquoted
companies and a valuation of our investments in quoted
companies at closing market value. The financial statements
were made on a going concern basis.
We would also like to draw your attention to the special report
of the Board of Directors that was submitted to the
Extraordinary General Meeting in accordance to the article 633
of the company code.
At the end of the financial year, due to the company’s decision only
to make prudent investments in unquoted companies, the company
was not in compliance with privak rules on asset allocation.
The Directors have no knowledge of other facts, after the end of
the accounting year that might have a significant influence on the
development of the company.
In view of the objectives of the company, there are no activities
planned or undertaken in the area of research and development
of an industrial nature
Appropriation of the result
The Board of Directors proposes to the Annual Meeting of
Shareholders to carry forward the net loss of
€71,004,191 to the next accounting year. In view of this negative
result, the board is not able to propose a dividend for this
accounting year.
Discharge
We request you, by separate votes, to give discharge to the
Directors and the Auditor for the execution of their mandates
over the past year.
Leuven, July 22nd, 2003
The Board of Directors of Quest for Growth NV
Quest for Growth 2002-2003
Ladies, Gentlemen,
REPORT OF THE
REPORT OF THE
INDEPENDENT DIRECTORS
INDEPENDENT
DIRECTORS
Quest for Growth 2002-2003
42
REPORT OF THE INDEPENDENT DIRECTORS CONCERNING THE RESULTS
OF THE FINANCIAL YEAR ENDED ON JUNE 30th, 2003
To the shareholders,
In accordance with the legal provisions – in particular article 25, §1 of the Royal Decree of April 18th, 1997 on the
Privaks – and the statutory provisions, in particular article 23, second paragraph, we report to you on the execution of
the supervision assignment that has been entrusted to us.
The above-mentioned provisions anticipate that the undersigned supervise the daily management of Quest For Growth.
Our supervision refers, in particular, to the transactions that are performed by the company, whereby one of the
persons, mentioned in article 25, §1 of the above-mentioned Royal Decree directly or indirectly acts as counter party or
obtains any proprietary legal benefits from the transaction.
Our supervision had access to all investment proposals that were approved by the Board of Directors during the past
financial year.We have confirmed that persons involved in Quest For Growth as counter parties or benefiting from any
proprietary legal benefits have not taken part in the negotiations, nor have they taken part in the voting.
Furthermore we have verified the calculation of the remuneration of the depository bank over the accounting year.
For the transactions in quoted shares, we have checked all transactions of a number of randomly selected Exchange
days. Our inspection has not revealed any transactions that were not in conformity with the market.
In our opinion there are no remarks to be formulated on the way in which the daily management of the company has
been performed.We have ascertained that the company and all persons involved have always acted in a correct manner
in situations where possible conflicting interests could occur, in accordance to the legal and statutory provisions and the
Ethical Code that these people have imposed on themselves.The transactions and decisions were taken and executed
for the benefit of the company and in conformity with its investment policy.
Leuven, July 18th, 2003
Prof. Koen Debackere
Gengest BVBA
Independent Director
Independent Director
Represented by Mr. Rudi Mariën
REPORT OF THE
REPORT OF THE
STATUTORY AUDITOR
STATUTORY
AUDITOR
43
In our opinion, taking into account the prevailing legal and
STATUTORY AUDITOR’S REPORT ORIGINALLY
regulatory requirements, the financial statements present
PREPARED IN DUTCH
fairly the Company’s net worth and financial position as of
June 30, 2003 and the results of its operations for the year
Report of the Statutory Auditor (Commissaire/ Com-
then ended and the disclosures made in the notes to the
missaris) on the statutory accounts submitted to the Annual
financial statements are adequate.
General Meeting of QUEST FOR GROWTH NV PRIVAK
Statutory accounts for the year ended 30 June 2003
In accordance with legal and statutory requirements, we are
reporting to you on the completion of the mandate which you
have entrusted to us.
Notwithstanding the significant losses incurred during the year
ended June 30, 2003, which have had a negative impact on the
Company's financial position, the statutory accounts have been
prepared assuming that the Company will continue as a going
concern. Without having the intention to change the abovementioned statement, we draw your attention to the annual
report, in which the Board of Directors, according to Belgian
We have audited the financial statements as of and for the year
ended June 30, 2003 with a balance sheet total of
Company Law, justifies the application of the valuation rules in
the assumption of the continuity of the company.
EUR 46.289.763,24 and a loss for the year of EUR
14.198.939,29. These financial statements have been prepared
Additional assertions
under the responsibility of the Board of Directors of the
Company. In addition we have carried out the specific additional
As required by generally accepted auditing standards the
audit procedures required by Company law.
following additional assertions are provided. These assertions
do not alter our audit opinion on the financial statements.
Unqualified audit opinion on the financial
statements, with explicatif paragraph
●
The directors’ report contains the information required by
law and is consistent with the financial statements. The
directors’ report also contains a clarification concerning the
We conducted our audit in accordance with the standards
non-compliance of the rules of the current PRIVAK legislation
of the "Institut des Réviseurs d'Entreprises-Instituut der
Bedrijfsrevisoren". Those standards require that we plan and
perform the audit to obtain reasonable assurance about
whether the financial statements are free of material
●
complies with the legal and statutory provisions.
●
we have to report to you.
●
financial statements have been prepared in accordance with
Company’s administrative and accounting organisation as well as
have provided us with all explanations and information, which
Without prejudice to certain formal aspects of minor
importance, the accounting records are maintained and the
In accordance with these standards we have considered the
its internal control procedures. The Company's management
There are no transactions undertaken or decisions taken in
violation of the Company’s statutes or Company Law which
misstatement, taking into account the legal and regulatory
requirements applicable to financial statements in Belgium.
The appropriation of results proposed to the general meeting
the applicable Belgian legal and regulatory requirements.
●
Article 633 of the Company Law is still applicable. The rules
described in the Belgian Company Law have been followed.
we required for our audit. We examined, on a test basis,
evidence supporting the amounts in the financial statements.
Leuven, 22 July 2003
We assessed the accounting policies used and significant
Klynveld Peat Marwick Goerdeler
accounting estimates made by the Company, as well as the
Bedrijfsrevisoren - Réviseurs d'Entreprises
overall presentation of the financial statements. We believe that
Statutory Auditor
our audit provides a reasonable basis for our opinion.
represented by Erik Clinck
Quest for Growth 2002-2003
FREE TRANSLATION OF UNQUALIFIED
GLOSSARY
GLOSSARY
Quest for Growth 2002-2003
44
Bevak:
A Belgian collective investment scheme, which is established in the form of a closed-end investment company.
Bylaws:
are the operating rules of a corporation.They are adopted by the company's Board of Directors and govern
such things as the election of directors, the size of the Board of Directors, and the election and function of
each of the company's officers. Bylaws can normally be amended by the company's directors and are more
easily changed than the company's charter, which can only be amended with shareholder approval.
Depository bank:
Due diligence:
holds all the assets of the privak
●
Is responsible for the payment of the purchased financial instruments
●
Handles the delivery of sold financial instruments and the reception of the purchased securities
●
Will take care of the dividend and interest payments on portfolio assets
is the independent investigation of a company, its management team, and its prospects for success by an
investor before funding is approved. It is usually intensive and thorough. It customarily includes verifications of
statements made in the business plan, and studies of the company's product and market, material, contracts,
facilities, real property owned, subsidiaries, lawsuits, insurance, patents and other intellectual property rights,
licenses and permits, and tax status.
Growth companies:
are defined by the Royal Decree of 18th April 1997 as companies, listed on an official exchange, a regulated or
another organized, recognized market provided that this exchange or market is designated to young and
growth companies.The Banking and Finance Commission publishes a list of qualifying markets. At 30th June
2001 this included NASDAQ Europe, Euro.NM, NASDAQ and AIM.
Growth stocks:
stocks issued by companies that are expected to grow fast and create a healthy return on investment
for their investors.
IPO:
or "Initial Public Offering" is the registered public offering of securities of an issuer to the public for the first time.
ISD:
or "Investment Services Directive"; European Directive of 10 May 1993 liberating the investment services in
the securities field.This directive introduces the European passport for investment firms.
Joint venture:
refers to business projects undertaken co-operatively by two or more parties where each contributes
different skills and resources and shares in the result of the endeavour.They usually include active participation
by all joint ventures. They can be structured as contractual arrangements or can appear as specialized
partnerships. They can even appear as corporations with special contractual arrangements among the
shareholders.
Net income:
net income is defined in the Royal Decree of 18 April 1997 as the net profit of the year, excluding depreciation
of holdings, reduction of depreciation and unrealised capital gains. At least 80% of the net income of the privak
must be paid out as a dividend.
Privak:
a listed private equity bevak, governed by the Royal decree of 18 April 1997, and designed for investments in
growth companies and in securities, which are not listed.
45
the Royal decree of 18 April 1997 on collective investment schemes for investments in unquoted companies
and growth companies.
Private placement:
The offer and sale of securities not involving a 'public offering'.The definition of 'public offering' varies from
country to country. Typically, a private placement implies that the stock will be placed with only a limited
number of mainly institutional investors.
Qualifying financial instruments:
financial instruments which are defined as such by the Privak-decree
●
Shares and assimilated financial instruments;
●
Bonds and other debt instruments;
●
Other negotiable securities by which the above mentioned financial instruments can be pur
chased or obtained in exchange;
●
Call or put options on the above mentioned financial instruments, on condition that the
underlying asset is a qualifying holding;
●
Qualifying holdings:
Units in collective investments schemes.
According to the Privak-decree qualifying holdings are
●
Qualifying financial instruments, issued by unquoted companies;
●
Qualifying financial instruments, issued by growth companies;
●
Shares or units, issued by other collective investment schemes or holding companies with an
investment policy which is in essence compatible to that of the privak itself.
RDT’s:
"Revenues Définitivement Taxés". Shareholders, normally subject to Belgian Corporation tax, are not taxed on
dividends for 95% of the amount of the dividend if:
●
They are holding at least 5% of the company which pays the dividend or
●
If the acquisition value of the holding represents at least 50 million BEF;
●
The company that pays out the dividend has committed in its Articles of Association to pay
out at least 90% of distribuable profits.
Unquoted companies: companies whose shares are not listed or traded on an official stock exchange, a regulated market nor on
another organised, recognised market.
Venture capital:
is money invested in a company at high risk to the investor, usually in situations in which the company is
unable to secure needed funds from traditional lending sources, such as a commercial loan from a bank.
Venture capital can be invested through the purchase of stock (equity), by making a loan (debt), or through
the combination of the two. Venture capital investors require a very high rate of return and thus only invest
in companies with good prospects for rapid growth.
Quest for Growth 2002-2003
Privak-decree:
Quest for Growth 2002-2003
46
GENERAL
INFORMATION
GENERAL INFORMATION
47
Quest for Growth 2002-2003
General
information about
the Company
Hans BERQUIN at Brussels on the
The
thirtieth of June, nineteen hundred and
amended by deed passed before Notary
ninety-eight,
of
Eric SPRUYT on the seventeenth of
which was published in the Annexes to
September two thousand and published
the Belgian Gazette on the following
in the Annexes to the Belgian Gazette on
nineteenth of September under the
the tenth of January two thousand and
Name, Legal form and
registered office
number 980919-328.
one under the number 20010110-533.
were
The Articles of Association were last
The company is a public limited company
amended by deed passed before Notary
amended by deed passed before Notary
trading under the name of "Quest for
Eric SPRUYT at Brussels on the twenty-
Luc HERTECANT, at Overijse, on the
Growth". It is incorporated as an
second of July, nineteen hundred and
nineteenth of September two thousand
investment company with a fixed capital
ninety-eight,
of
and two and published in the Annexes to
for investment in listed and unlisted
which was published in the Annexes to
the Belgian Gazette on the twenty-ninth
companies, hereinafter called "the Privak"
the Belgian Gazette on the following
of October two thousand and one under
(private
nineteenth of September under the
the number 0132476.
collective
company). The
The
venture
company’s
capital
registered
the
Articles
announcement
of
the
Association
announcement
Articles
of
Association
were
number 980919-327.
office is situated at B-3000 Leuven, Lei 19,
A deed amending the Articles of Association
The company is established for an
box 3. The company is registered in
including a decision to increase the capital
indeterminate period of time and shall
Belgium under Leuven trade registry
was drawn up before Notary Eric SPRUYT
start trading on the date of its formation.
number 99 856.
at Brussels on the twenty-fifth of August,
nineteen hundred and ninety-eight, the
Financial year and audit
Formation, changes to the
articles of association, duration
announcement of which was published in
The Company’s financial year begins on the
the Annexes to the Belgian Gazette on the
first of July and ends on the thirtieth of June.
The company was incorporated in the
following twenty-fifth of November under
The annual accounts are audited by Klynveld
form of a public limited company (NV/SA)
the number 981125-302.
Peat Marwick Goerdeler Bedrijfsrevisoren
by deed passed before Notary Hans
The Articles of Association were last
Burg. CV, represented by Mr Erik Clinck,
BERQUIN at Brussels on the ninth of
amended by deed passed before Notary
Bourgetlaan 40, B-1130 Brussels
June, nineteen hundred and ninety-eight,
Hans BERQUIN at Brussels on the
the
twenty-second of September, nineteen
announcement
of
which
was
hundred
Gazette of the following 24 June under
announcement of which was published in
The company’s Articles of Association are
the number 980624-595.
the Annexes to the Belgian Gazette on
available
the following eleventh of November
Commercial Court at Leuven. The annual
under the number 981111-003.
accounts of the Company are filed with the
The
Articles
of
Association
were
amended by deed passed before Notary
and
ninety-eight,
the
Consultation of company
documents
published in the Annexes to the Belgian
from
the
Registry
of
the
Quest for Growth 2002-2003
48
National Bank of Belgium.These documents,
as well as the annual and semi-annual
reports and all published information
intended for shareholders can also be
obtained at the company’s registered office.
The company‘s quarterly, semi-annual and
annual report is sent every year to all
registered shareholders and other persons
who so desire.
Company objectives
The objects of the Privak are the
collective investment of funds collected
from the public pursuant to the Royal
Decree of the eighteenth of April
nineteen hundred and ninety-seven in
short term investment certificates. From
the second year of operations onwards
such liquid funds shall in principle be
limited to ten percent (10%) of the assets
unless a special decision by the Board of
Directors temporarily authorises a
higher percentage.
Day-to-day management is carried out by
Quest Management NV, acting as the
Managing Director.
General meeting
The General Meeting shall be held on the
third Thursday in September at 11am.
Where that date falls on a public holiday,
the meeting shall take place the next
working day.
On 22 July 1998, the share capital was
increased by 140,000,000 BEF up to
708,000,000 BEF through the issue of
140,000 ordinary shares
On 22 September 1998, the share
capital was increased by 2,000,000,000
BEF up to 2,708,000,000 BEF through a
public offer to subscribe for 2,000,000
new ordinary shares.
On 17 November 2000, the share capital
was increased by 50,098,000 EUR to
117,227,566.51 EUR through a public
offer to subscribe for 2,708,000 new
ordinary shares.
listed and unlisted growth companies and
The subscribed capital of the Company
funds with a similar objective to the
is
Privak. It shall be governed in its
investment policy by the aforesaid Royal
Decree and by the provisions in these
Articles
of
Association
and
the
prospectus published with regard to the
issue of shares to the public.
The Privak shall focus its investment policy
on investment in growth industries in
various sectors of the economy including
but not limited to the sectors of medicine
and health, biotechnology, information
technology, software and electronics and
new materials.
Furthermore
the
company
may
incidentally keep liquid funds in the form of
savings accounts, investments at notice or
General
information about
the Company’s
capital
Issued capital of the Company
The Company was incorporated on 9
June 1998 with share capital of
201,000,000 BEF through the issue of
200,000 ordinary shares, 750 A shares
and 250 B shares.
On 30 June 1998, the share capital was
increased by 367,000,000 BEF up to
568,000,000 BEF through the issue of
367,000 ordinary shares.
117,227,566.51
represented
by
EUR
and
5,415,000
it
is
ordinary
shares, 750 A shares and 250 B shares
without nominal value.
All ordinary shares have the same rights
and
privileges, represent
the
same
fractional value of the capital of the
Company and are fully paid-up. All these
ordinary shares have the same voting
rights, dividend entitlements and rights to
the liquidation surplus.
The holders of Class A and Class B shares
shall receive a preference dividend. That
preference dividend shall be paid out of the
part of the net profit that exceeds the
amount necessary to pay to all the
49
Quest for Growth 2002-2003
shareholders a dividend equal to ten percent
(10%) nominal calculated on the basis of the
invested capital including any issue premiums
at the end of the financial year to which the
dividend relates. Of that surplus amount
twenty percent (20%) shall be paid out to
holders of Class A and Class B shares as
preference dividends. The remaining eighty
percent (80%) shall be distributed equally
among all shareholders. If the aforesaid ten
percent (10%) is not achieved in any one
year, the shortfall must be recuperated
before the preference dividend can be paid
out. The calculation shall be made on a
nominal basis.If the capital is increased during
the year, the new capital contributed shall be
included in the calculation pro rata temporis.
The General Meeting can increase or
The result of the exercise of the warrants
reduce the subscribed capital. In the event
as well as the number of non-exercised
of an increase in capital by issuing shares
warrants that will be sold through the
in return for a contribution in cash, it is
scrips, will be published in the press on
not possible to deviate from the priority
October 27th 2005.
right of the existing shareholders.
The purchasers of the scrips can
Warrants
subscribe for new shares by exercising
5,416,000
the scrips during the Fourth Exercise
warrants were issued. Each warrant gives
Period that will be closed on November
its holder the right to subscribe to one
4th 2005 and this at the Exercise Price
new ordinary share in the Company, on
and in the proportion of 1 ordinary
exercise of the warrant during one of the
share for 1 scrip.
On
26
September
2002
exercise periods, against payment of the
Exercise Price of € 8.00 per ordinary
share. The warrants may be exercised by
their holders from October 1st up to and
Authorised capital of
the Company
including October 20th at 4.00 PM of the
The updated text of the Articles of
Association as on 17 September 2000 has
expressly permitted the Board of
Directors to increase the share capital in
one or more times by a maximum
amount of 117,227,566.50 EUR.
(Second Exercise Period) and 2005 (Third
This authorisation is granted for a period
of five years, counting from publication of
the Act of Capital increase of the
Company on 17 November 2000,
announced in the Appendix to the Belgian
Official Gazette (Moniteur Belge /Belgisch
Staatsblad). It can be renewed one or
more times, for a maximum period of five
years on each occasion.
years 2003 (First Exercise Period), 2004
Exercise
Period), by
submitting
The net proceeds of the sale of the scrips,
after deduction of the expenses, costs
and other charges incurred by the
Company, will be distributed evenly
between all the warrants that were not
exercised during the Exercise Period.
an
Information on share ownership
irrevocable exercise declaration to the
The following shareholders have notified
Domiciliary Bank.
the Company of their interest of 5% or
more in the Company:
The warrant holders who at the latest on
October 20th 2005 at 4.00PM have not
used their right to exercise their
warrants, will not be able to use their
right after that day. The non-exercised
warrants will be represented by scrips
that will be offered for sale on Euronext
Brussels as soon as possible after the
closing of the Third Exercise Period and in
principle on October 28th, 2005.
Name and address
DEXIA BANK NV
Pachecolaan 44, 1000 Brussel
Number of shares
431,911
%
7.97
Date declaration
20/11/00
FINANCIAL
CALENDAR
FINANCIAL CALENDAR
Quest for Growth 2002-2003
50
SHAREHOLDERS MEETINGS: Extraordinary General Meeting: 18 September 2003
Annual General Meeting:
18 September 2003
Annual General Meeting:
16 September 2004
PUBLIC ANNOUNCEMENTS: Results Q1:
ANALYST MEETINGS:
PRESS CONFERENCES:
24 October 2003
Results Q2:
23 January 2004
Results Q3:
23 April 2004
Results Q4:
23 July 2004
23 October 2003
04.00 PM
22 January 2004
04.00 PM
22 April 2004
04.00 PM
22 July 2004
04.00 PM
23 October 2003
11.00 AM
22 January 2004
11.00 AM
22 April 2004
11.00 AM
22 July 2004
11.00 AM
PUBLICATION NET ASSET VALUE:
NAV end of:
Cash!
F.E.T.
L’Echo
QfG website
Sep-03
Oct-03
Nov-03 Dec-03
Jan-04
Feb-04
Mar-04
Apr-04
May-04
Jun-04
9-Oct
6-Nov
4-Dec
3-Jan
7-Feb
9-Mar
3-Apr
8-May
5-Jun
3-Jul
4-Oct
8-Nov
6-Dec
8-Jan
5-Feb
4-Mar
8-Apr
6-May
10-Jun
8-Jul
4-Oct
8-Nov
6-Dec
8-Jan
5-Feb
4-Mar
8-Apr
6-May
10-Jun
8-Jul
3-Oct
5-Nov
3-Dec
2-Jan
4-Feb
3-Mar
2-Apr
5-May
4-Jun
2-Jul
WARRANT EXERCISE DATES: 1 October 2003
-
20 October 2003
1 October 2004
-
20 October 2004
3 October 2005
-
20 October 2005
28 October 2005
-
4 November 2005
KEY
KEYINFORMATION
INFORMATION
51
Dr. Jos B. Peeters, Chairman
Quest Management NV, Managing Director, represented by Philip Fearnhead BVBA,
Managing Director of Quest Management NV
Bergendal & Co SPRL, Vice Chairman, represented by Comte Diego du Monceau
de Bergendal
Tacan BVBA, Vice Chairman, represented by Mr. Johan Tack
Philippe Haspeslagh BVBA, Director, represented by Prof. Philippe Haspeslagh
Joedheco NV, Director, represented by Mr. Leo Claeys
Mr. Patrick Millecam, Director
Mr. René Avonts, Director
Gengest BVBA, Independent Director, represented by Mr. Rudi Mariën
Prof. Koen Debackere, Independent Director
Mr. John Boeckmann, Director
AUDIT COMMITTEE
Bergendal & Co SPRL, represented by Comte Diego du Monceau de Bergendal
Tacan BVBA, represented by Mr. Johan Tack
Gengest BVBA, represented by Mr. Rudi Mariën
Prof. Koen Debackere
ASSET MANAGER
Quest Management NV, Lei 19 Bus 2, B-3000 Leuven
AUDITORS
Klynveld Peat Marwick Goerdeler Bedrijfsrevisoren Burg. CV,
represented by Mr Erik Clinck, Bourgetlaan 40, B-1130 Brussels
DEPOSITARY BANK
DEXIA BANK, Pachecolaan 44, B-1000 Brussels
Share
Warrant
INCORPORATION
June 9th, 1998
OFFICIAL LISTING
September 23rd, 1998 on Euronext Brussels
SECURITY NUMBER
ISIN: BE0003730448
ISIN: BE0099924145
STOCK PRICE
Bloomberg: QFG BB EQUITY
Bloomberg: QFGW4 BB EQUITY
Reuters: QUFG.BR
Telekurs: 950524
COMPANY REPORTS
Quarterly, the next report will be the quarterly report, to be published in October 2003.
ESTIMATED
NET ASSET VALUE
Published every first Saturday of the month in "De Financieel Economische Tijd", in "L’Echo", "Cash!"
and on the Quest for Growth website.
Quest for Growth 2002-2003
BOARD OF DIRECTORS
Quest for Growth 2002-2003
52
QUEST FOR GROWTH NV
Privak, fixed capital investment company established under Belgian Law
Lei 19, bus 3 B-3000 Leuven - Phone: +32 (0)16 28 41 28 Fax: +32 (0)16 28 41 29
Internet: http://www.questforgrowth.com
E-mail: [email protected]


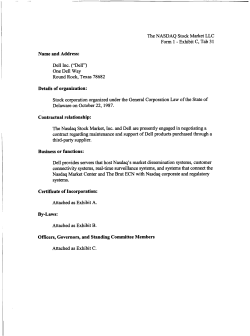


© Copyright 2026